
Calmar Ratio Explained: Return Per Unit of Pain in a PMS
Learn the Calmar ratio: its formula, a worked PMS example in rupees, how to read the number, and how it differs from the Sharpe and Sortino ratios.

The Calmar ratio divides a portfolio's annual return by its maximum drawdown, the deepest peak-to-trough fall in the same period, so it tells you how much return you earned for each unit of the worst loss you would have sat through. Terry W. Young introduced it in 1991 for commodity trading advisers, using a 36-month window. A strategy earning 17% a year with a 25% worst fall scores about 0.68; one earning 13% with a 10% worst fall scores about 1.32, which is the better trade-off. Read it as a rule-of-thumb ranking tool, always on the same window and data frequency, and alongside the Sharpe and Sortino ratios rather than instead of them.
Why the Calmar Ratio Asks a Different Question
Most PMS conversations start with a return number: one strategy delivered 24% CAGR over three years, another 18%. In a bull market that is usually where the conversation ends.
But an investor does not experience a CAGR. You experience a path. Somewhere on that path there is a month when your Rs 1 crore portfolio statement shows Rs 75 lakh, the news is grim, and you have to decide whether to stay. That moment, the deepest fall from a previous high, is called the maximum drawdown, and it is the single biggest reason HNIs exit good strategies at the worst possible time.
The Calmar ratio puts that moment into the return conversation. Instead of asking "how much did this strategy make?", it asks "how much did it make for every unit of pain it put me through?" That is why it is often described as return per unit of drawdown.
This guide covers the definition, origin, formula, a full rupee worked example, how to read the result, and how it sits next to the Sharpe and Sortino ratios. A sister article evaluates its strengths and limitations in depth, so limits appear here only briefly.
What the Calmar Ratio Measures, in Plain English
The Calmar ratio is a risk-adjusted return measure. Like every ratio in that family, it has a reward on top and a risk on the bottom. What makes it different is the choice of risk.
- Reward (numerator): the annual return of the portfolio over a chosen period, usually expressed as a CAGR.
- Risk (denominator): the maximum drawdown over the same period, written as a positive number.
So a Calmar ratio of 1.0 means the strategy earned, in a typical year, roughly as much as it lost in its worst peak-to-trough fall. A ratio of 0.5 means the worst fall was twice the size of a year's return. A ratio of 2.0 means a year's return was twice the size of the worst fall.
Two features make the ratio intuitive for PMS investors:
- It uses the loss you actually feel. Standard deviation, used by the Sharpe ratio, measures how widely returns swing around their average, up and down alike. Maximum drawdown measures how far the portfolio actually fell from a high before it recovered. Investors rarely complain about upside swings; they complain about the fall.
- It is anchored in a real event. The drawdown in the denominator happened. It has a start date, a bottom and a size, which you can check against what the market did at the time.
The same feature is its main weakness: the ratio rests on one event.
Where the Calmar Ratio Came From: Terry Young and Futures Magazine
The Calmar ratio was created by Terry W. Young and first published in 1991 in the trade journal Futures, in an article titled "Calmar Ratio: A Smoother Tool". Young ran California Managed Accounts, a firm in Santa Ynez, California, that also published a newsletter called CMA Reports. "Calmar" is a contraction of CALifornia MAnaged accounts Reports.
Young's audience was the managed-futures world: commodity trading advisers (CTAs) whose returns could swing wildly and whose investors cared intensely about drawdowns. His definition was precise: the average annual rate of return for the last 36 months divided by the maximum drawdown for the last 36 months, calculated on a monthly basis. He argued that it "changes gradually and serves to smooth out the overachievement and underachievement periods" of a CTA's performance better than the Sterling or Sharpe ratios.
The Sterling and MAR Ratios That Came Before
Young did not invent the idea of dividing return by drawdown. Two earlier measures already existed:
- The MAR ratio, popularised by Leon Rose's newsletter Managed Account Reports (founded 1979), divides compound annual return since inception by maximum drawdown since inception. It uses the whole history, so a crash from ten years ago stays in the number forever.
- The Sterling ratio, commonly attributed to Deane Sterling Jones in the early 1980s, divides return by the average annual drawdown (originally with a 10% adjustment) rather than the single worst one. The attribution is thinly documented.
The Calmar ratio sits between the two. It uses the single worst drawdown, like MAR, but only within a rolling 36-month window, so old disasters eventually drop out. That rolling window is what Young meant by "smoother".
How the Definition Has Drifted Since 1991
Over three decades, practitioners have bent the definition in several directions:
- CAGR instead of average annual return. Most modern calculators use the compound annual growth rate in the numerator. Young's original wording was "average annual rate of return".
- Longer windows. Many databases now show Calmar over five years or since inception, which makes it look more like MAR.
- A risk-free adjustment. Some later versions subtract the risk-free rate from the return, which turns the ratio into a drawdown-based cousin of the Sharpe ratio.
- A geometric version. Quant blogger Ilya Kipnis proposed in 2018 dividing return by the gain needed to recover from the drawdown, rather than by the drawdown itself.
None of these is wrong, but they produce different numbers from the same data, so when someone quotes a Calmar ratio, ask which version, window and data frequency.
The Calmar Ratio Formula and Its Three Inputs
The standard Calmar ratio formula is:
Calmar ratio = Annualised return over the period ÷ |Maximum drawdown over the same period|
The vertical bars mean you take the drawdown as a positive number. A 25% fall goes into the formula as 0.25, not −0.25. There are three inputs to get right.
Input One: The Annual Return (CAGR or Average?)
You can measure a "typical year" in two ways:
- CAGR (geometric): (Ending value ÷ Starting value)^(1 ÷ number of years) − 1, the standard compound annual growth rate formula. This is the rate that, compounded, turns the starting value into the ending value.
- Arithmetic average: add up each year's return and divide by the number of years.
For a steady strategy the two are close. For a volatile one, the arithmetic average is higher, sometimes by a percentage point or more, which flatters the ratio. CAGR is the better choice for PMS investors because it matches the time-weighted rate of return (TWRR) that SEBI requires portfolio managers to report. If you are comparing two strategies, the rule is consistency: use the same numerator for both.
Input Two: Maximum Drawdown
Maximum drawdown is the largest percentage fall from any running peak to a subsequent trough during the period:
Drawdown at month t = (Portfolio value at t ÷ Highest value reached up to t) − 1
Maximum drawdown = the most negative of those monthly drawdowns.
Two details matter. First, the peak is a running peak, not the starting value: a portfolio that rises from Rs 1 crore to Rs 1.5 crore and falls back to Rs 1.2 crore has had a 20% drawdown, even though it is still up 20%. Second, the frequency of the data changes the answer. Monthly data catches falls that year-end data hides; daily data catches falls that monthly data hides. Our guide to understanding drawdown in a PMS covers how deep PMS drawdowns typically go.
Input Three: The Measurement Window
Young used 36 months. That window is long enough to include some bad patches and short enough to reflect the current team and process. Longer windows (five years, since inception) are more likely to contain a full market cycle. Shorter windows (one year) are noisy and often produce flattering ratios if no correction happened.
Whatever the window, both inputs must use it. Pairing a five-year CAGR with a three-year drawdown, or a since-inception drawdown with a three-year return, produces a number that means nothing.
How to Calculate the Calmar Ratio: A Worked PMS Example
Here is how to calculate Calmar ratio figures for two hypothetical PMS strategies, each starting with Rs 1 crore and tracked over 36 months using month-end portfolio values. The figures are illustrative, not real funds.
| Point in the 36 months | Strategy A (aggressive) | Strategy B (steady) |
|---|---|---|
| Start (month 0) | Rs 1.00 crore | Rs 1.00 crore |
| End of year 1 (month 12) | Rs 1.30 crore | Rs 1.12 crore |
| End of year 2 (month 24) | Rs 1.20 crore | Rs 1.24 crore |
| Highest running peak | Rs 1.48 crore (month 20) | Rs 1.30 crore (month 29) |
| Lowest point after that peak | Rs 1.11 crore (month 27) | Rs 1.17 crore (month 32) |
| End of year 3 (month 36) | Rs 1.60 crore | Rs 1.45 crore |
Step 1: Compute the CAGR for Each Strategy
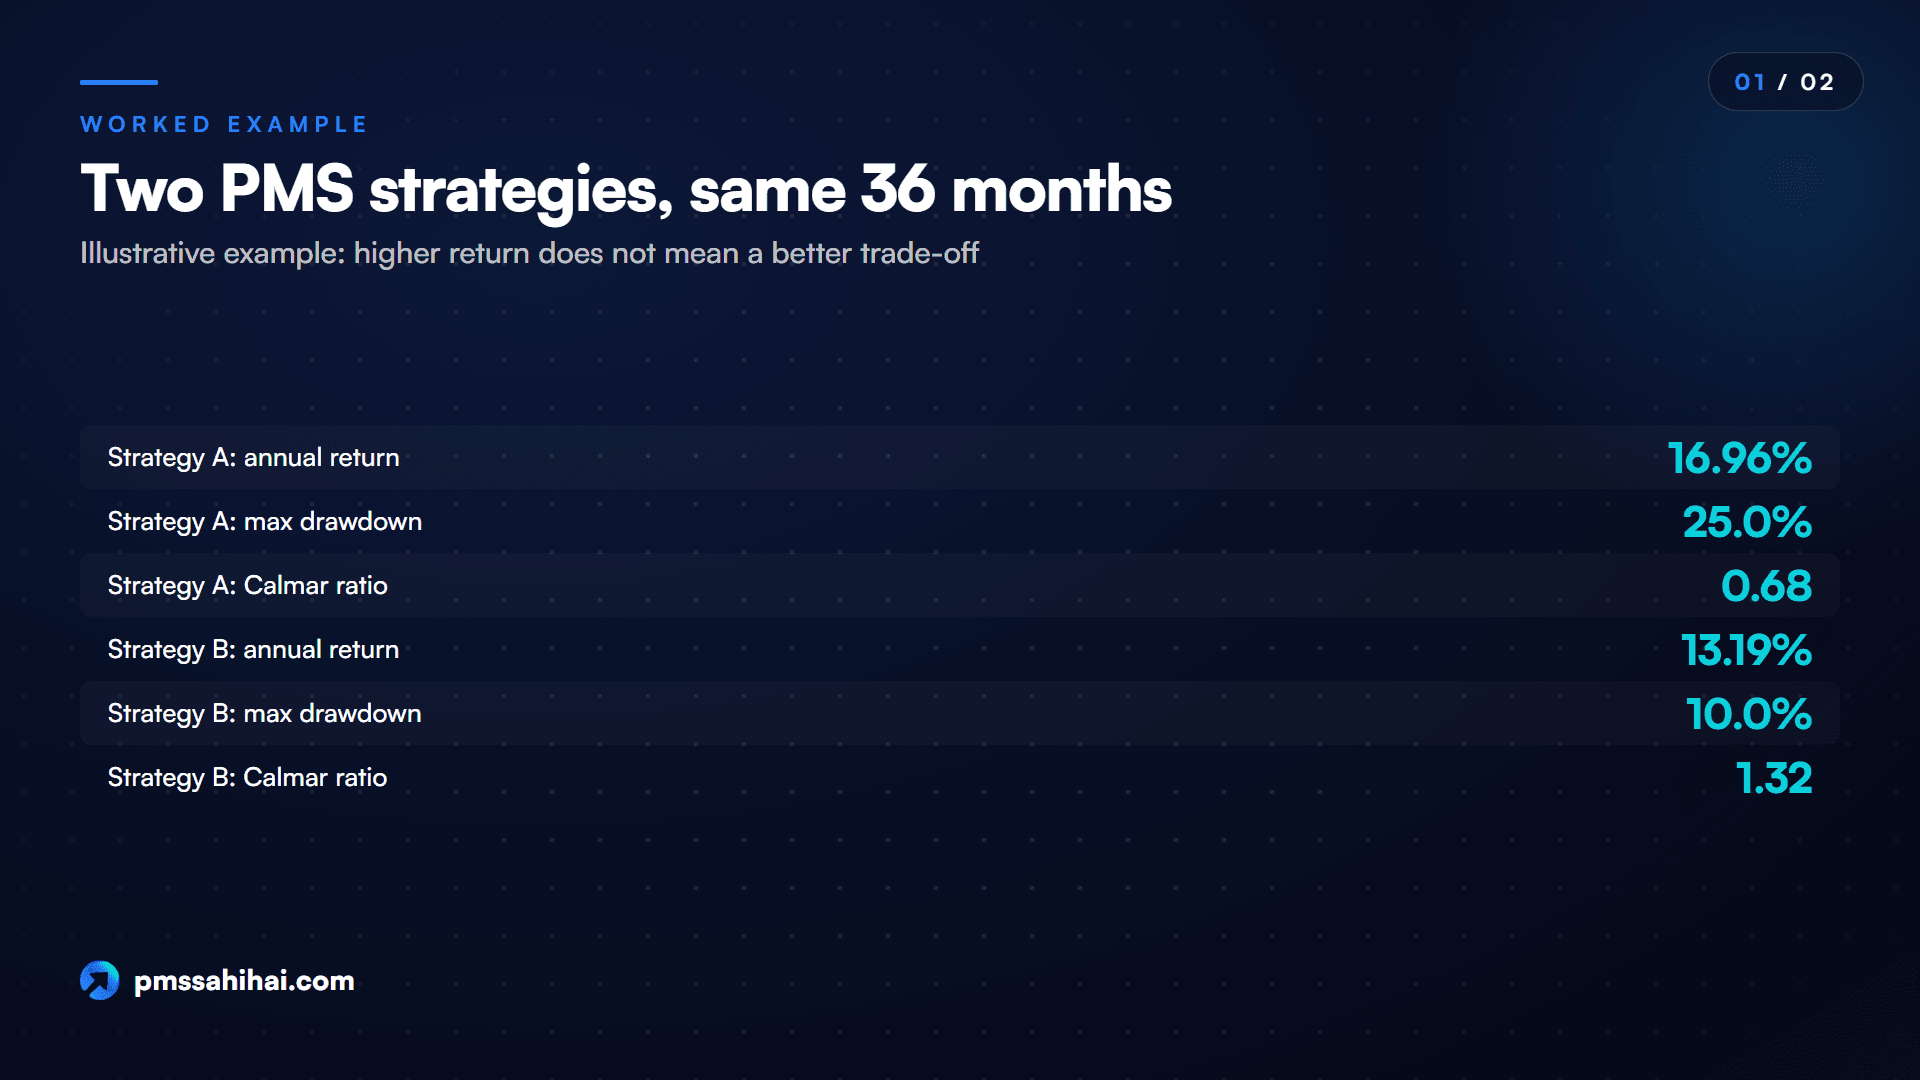
- Strategy A: (1.60 ÷ 1.00)^(1/3) − 1 = 16.96% a year
- Strategy B: (1.45 ÷ 1.00)^(1/3) − 1 = 13.19% a year
On returns alone, A wins by nearly four points a year.
Step 2: Find the Maximum Drawdown
- Strategy A fell from its Rs 1.48 crore peak to Rs 1.11 crore: 1.11 ÷ 1.48 − 1 = −25.0%
- Strategy B fell from its Rs 1.30 crore peak to Rs 1.17 crore: 1.17 ÷ 1.30 − 1 = −10.0%
An investor in A watched Rs 37 lakh of paper gains disappear over seven months. An investor in B watched Rs 13 lakh disappear.
Step 3: Divide Return by Drawdown
- Strategy A: 16.96% ÷ 25.0% = 0.68
- Strategy B: 13.19% ÷ 10.0% = 1.32
B earns nearly twice as much return per unit of drawdown. That is the core insight of this Calmar ratio example: the strategy with the lower headline return delivered the better trade-off between reward and pain.
Step 4: Sense-Check the Inputs
Three quick checks show how much the method matters:
- Arithmetic average instead of CAGR. A's yearly returns were +30.0%, −7.7% and +33.3%, an average of 18.55%. Using that, A's ratio rises to 0.74. B's yearly returns (+12.0%, +10.7%, +16.9%) average 13.22%, so B barely changes. Volatile strategies gain more from the arithmetic shortcut.
- Year-end data instead of monthly. Looking only at year-end values, A's worst fall is from Rs 1.30 crore to Rs 1.20 crore, just −7.7%. Its ratio would jump to about 2.20, more than three times the monthly figure. The seven-month slide from Rs 1.48 crore simply disappears.
- Subtracting a risk-free rate. If you assume an illustrative 6.5% risk-free return and subtract it first, A falls to 0.42 and B to 0.67. The ranking holds, but the levels are not comparable with figures calculated without the adjustment.
Doing It in Excel or Google Sheets
With month-end values in column B (B2 for month 0 down to B38 for month 36):
- Running peak in C2: =MAX($B$2:B2), then fill down
- Drawdown in D2: =B2/C2-1, then fill down
- Maximum drawdown: =MIN(D2:D38)
- CAGR: =(B38/B2)^(1/3)-1
- Calmar ratio: =CAGR/ABS(maximum drawdown)
If your PMS statement gives monthly returns rather than values, build the value series first: start at 100 and multiply by (1 + monthly return) each month. Use the strategy's TWRR series, not your personal XIRR, if you want to judge the manager rather than the timing of your own cash flows.
What Is a Good Calmar Ratio? Reading the Number
There is no official answer to what counts as a good Calmar ratio. Different sources publish different thresholds, and none is a regulatory standard. A fair summary of common rules of thumb:
| Calmar ratio (multi-year window) | Common reading |
|---|---|
| Below 0 | Negative return over the window: no compensation for the drawdown at all |
| 0 to 0.5 | Weak: the worst fall was more than two years of return |
| 0.5 to 1.0 | Modest: the worst fall was between one and two years of return |
| 1.0 to 2.0 | Generally acceptable to favourable |
| 2.0 to 3.0 | Strong |
| Above 3.0 | Excellent, or a sign that the window contains no real stress: check the track record |
Indian asset manager Bajaj AMC's investor guide calls a ratio above 1.0 generally acceptable for diversified strategies and 1.5 to 2.0 relatively favourable. Quant-education site Quantt calls its table "guidelines, not hard rules". Both points are worth keeping.
Context matters more than the bucket. In a review of hedge-fund performance through the COVID-19 sell-off of the first half of 2020, data provider Preqin computed Calmar ratios from median three-year annualised returns and median maximum drawdowns: relative value strategies scored 0.60, macro 0.42 and event driven 0.15, against 0.12 for the MSCI AC World Index. Every one of those numbers is below 1, because the window contained a crash. A ratio of 0.6 measured through a crash can be more impressive than 2.0 measured through a calm rally.
The "Years of Return" Reading and Where It Breaks
A handy way to read the number is to flip it: 1 ÷ Calmar tells you how many years of typical return the worst drawdown was worth. Strategy A's 0.68 means its worst fall equalled about 1.5 years of return; Strategy B's 1.32 means about nine months.
That reading is only approximate. Losses and gains do not cancel symmetrically: a 25% fall needs a 33% gain to get back to the peak, and a 50% fall needs a 100% gain. Kipnis's geometric version divides return by that required gain instead. On that basis Strategy A scores 0.51 and Strategy B 1.19. The deeper the drawdown, the bigger the gap between the simple and geometric readings, which is why the simple ratio is kinder to aggressive strategies than their investors' experience suggests. How long a recovery actually takes is a separate question, covered in the companion piece on drawdown recovery time.
When the Calmar Ratio Turns Negative
If the annualised return over the window is negative, the Calmar ratio is negative. A negative value is not "very risky"; it simply means there was no reward to set against the drawdown. Comparing two negative ratios is not meaningful: a strategy at −0.2 is not necessarily better than one at −0.5, because a smaller loss divided by a smaller drawdown can produce the same figure as a larger loss divided by a larger one. When returns are negative, look at the return and the drawdown separately.
Calmar Ratio vs Sharpe and Sortino Ratios in Brief
All three ratios divide return by a measure of risk. The difference is what they count as risk. The detailed mechanics of the other two are covered in our Sharpe ratio guide, our Sortino ratio guide and the Sharpe vs Sortino comparison; here is the short version of calmar ratio vs sharpe ratio, with Sortino alongside.
| Ratio | Numerator | Risk measure | What it rewards | Blind spot |
|---|---|---|---|---|
| Sharpe | Return minus risk-free rate | Standard deviation of returns | Smooth, consistent returns | Treats upside swings as risk; can look fine before a rare crash |
| Sortino | Return minus a target (minimum acceptable return) | Downside deviation below the target | Few and small below-target months | Still measures typical downside, not the worst episode |
| Calmar | Annualised return (usually CAGR) | Maximum drawdown | A shallow worst-case fall | Rests on one event; ignores how often falls happen |
The Sharpe ratio, devised by William Sharpe in 1966, and the Sortino ratio both measure dispersion of returns; the Calmar ratio measures one episode. The practical difference shows up in strategies with rare but severe losses. A portfolio that earns steady small gains for years and then suffers one deep fall can show a respectable Sharpe ratio, because most months were calm, and a poor Calmar ratio, because that one fall was large. Conversely, a strategy with frequent small swings but no deep fall may look average on Sharpe and strong on Calmar.
Used together, the three answer different questions: Sharpe asks how consistent the ride was, Sortino how bad the typical bad month was, and Calmar how bad the worst stretch was. When they disagree, the disagreement tells you something about the shape of the returns.
The MAR ratio, mentioned earlier, is the Calmar ratio's since-inception cousin. When a factsheet quotes "Calmar since inception", it is effectively a MAR ratio.
How the Calmar Ratio Is Used in Today's Fund Analytics
The Calmar ratio began in a newsletter; today it lives mostly in software.
- Analytics libraries. Open-source tools in Python and R compute it from a return series in a few lines: build the wealth index, track the running peak, take the minimum drawdown, divide the annualised return. That makes it cheap to calculate on rolling windows, so analysts can chart how a manager's ratio has moved month by month rather than relying on one snapshot.
- Fund databases and allocator reports. Hedge-fund and managed-futures databases show the Calmar ratio beside the Sharpe and Sortino ratios, and research houses use it to rank strategy groups, as Preqin's 2020 review did.
- Backtesting platforms. Systematic-strategy and backtesting tools display it as a standard output, because a strategy that looks good on returns but carries a deep drawdown is usually one that will be abandoned by real investors.
- Indian PMS reporting. In India, the Calmar ratio is not a regulatory disclosure. SEBI's circular of 16 December 2022 on performance benchmarking and reporting, whose provisions now sit in the Master Circular for Portfolio Managers of 16 July 2025, requires portfolio managers to present the TWRR of each investment approach alongside the trailing return of a selected benchmark, with APMI prescribing up to three benchmarks per strategy. It does not prescribe any risk ratio. For mutual funds, SEBI's 17 January 2025 circular mandated daily disclosure of the information ratio for equity-oriented schemes, again not the Calmar ratio.
The upshot for an Indian investor is that you will rarely be handed a Calmar ratio for a PMS. You will usually be handed the two ingredients, a CAGR and a maximum drawdown, and you can do the division yourself. That is also how the calmar ratio in PMS analysis tends to work in practice: computed by the investor or adviser, not by the manager's marketing team.
Why the Calmar Ratio Makes PMS Comparisons Easier
The Calmar ratio is simple enough to compute on a phone and pointed enough to change a decision. Its main advantages:
- It speaks the investor's language. "This strategy earned 1.3 years of return for every year-equivalent of worst-case loss" is easier to explain to a family than standard deviation.
- It focuses on the loss that drives behaviour. Investors exit strategies during deep drawdowns, not during high-volatility rallies. A ratio built on maximum drawdown measures the risk most likely to make you sell at the bottom.
- It separates similar-return strategies. Two PMS strategies with 18% CAGR can feel completely different. The one with a 12% worst fall and the one with a 35% worst fall have Calmar ratios of 1.5 and about 0.5. Return tables alone hide that difference.
- It needs only two numbers. Most PMS factsheets and research platforms show a CAGR and a maximum drawdown, so the ratio can be built without a full return series.
- It punishes hidden tail risk. Strategies that earn smooth returns by taking risks that occasionally blow up, such as concentrated small-cap bets or leveraged positions in other markets, show it in their maximum drawdown even when their volatility looks calm.
- It changes gradually. Over a rolling 36-month window it moves slowly, as Young intended, which makes trends in a manager's risk discipline easier to see than in noisy monthly figures.
For an HNI building a shortlist, the workflow is simple: rank candidates by CAGR, re-rank by Calmar on the same window, and look hardest at strategies whose position changes most. That is where the return number hides the most pain.
How PMS Sahi Hai Helps You Work Out a Strategy's Calmar Ratio
You do not need a quant terminal to put a PMS through the Calmar test. You need the two ingredients, measured the same way for every strategy on your shortlist, and that is where PMS Sahi Hai is built to help.
The inputs are on every strategy page. Each PMS page on the PMS Sahi Hai compare universe shows 3Y CAGR, 5Y CAGR and since-inception CAGR net of fees, the selected benchmark, and a risk block with Max drawdown, Worst 1-yr window, Volatility and Sharpe ratio. Divide the CAGR by the maximum drawdown and you have a Calmar-style figure. One honest caveat: PMS Sahi Hai does not publish a Calmar ratio itself, and a strategy page does not label the period its maximum drawdown covers. Before you divide, confirm the drawdown window. If it is since inception, pair it with since-inception CAGR, which gives you a MAR-style ratio rather than a strict 36-month Calmar.
Line strategies up on equal terms. The compare tool lets you filter by category, fund house, benchmark, AUM and style, and shortlist up to four strategies side by side. That makes the five-step routine above practical: same window, same frequency, same benchmark, one table.
Nyra already weighs the pain. Nyra, PMS Sahi Hai's AI research analyst, scores strategies on five fixed-weight pillars set out in the Nyra methodology. One of them, Downside Protection (20%), uses maximum drawdown, volatility and beta; another, Risk-Adjusted Return (25%), uses the Sharpe and Sortino ratios. Strategies with less than 12 months of track record are shown as Not Rated rather than given a flattering score, which is exactly the short-record problem that inflates Calmar ratios.
Check what you already hold. The free portfolio scan reviews existing PMS, AIF, mutual fund and stock holdings, and its risk lens looks at "max drawdown and recovery, not just the headline number". If a manager's high CAGR came with a deep fall, that is where it shows up.
Nyra is an analytical tool, not a SEBI-registered investment adviser, so treat its output as research to discuss with your adviser, not a recommendation.
Calmar Ratio Limitations in Brief
The Calmar ratio is a useful filter, not a verdict. A separate article examines its strengths and weaknesses in depth, so here are only the headline cautions:
- One event decides the denominator. A single bad quarter can depress the ratio for three years, and a strategy that has not yet faced a crash can look far better than it is.
- Window and frequency change the answer. As the worked example showed, the same strategy can score 0.68 on monthly data and 2.20 on year-end data.
- It ignores recovery time and frequency. Two strategies with the same worst fall score the same, even if one recovered in four months and the other took three years, or if one had a single fall and the other had five. Measures such as the Ulcer index, devised by Peter Martin in 1987, count every drawdown instead.
- There is no single definition. CAGR or average, with or without a risk-free rate, 36 months or since inception: always check which.
Putting the Calmar Ratio to Work in Your PMS Review
The Calmar ratio earns its place in a PMS review because it forces a question that return tables avoid: what did this strategy cost me, at its worst, to earn what it earned? A short routine keeps it honest:
- Collect CAGR and maximum drawdown for the same window from the factsheet or research platform, ideally three and five years.
- Check the data frequency. Month-end or daily drawdowns are comparable; year-end ones are not.
- Compute the ratio for every shortlisted strategy and its benchmark. A PMS with a Calmar ratio below its benchmark's took more pain per unit of return than the index.
- Check what the window contained. A ratio above 3 measured over a calm stretch tells you little.
- Read it next to Sharpe, Sortino, recovery time and fees. Agreement builds confidence; disagreement tells you to look at the return path.
Used this way, it stops you buying the top return without asking what it cost. PMS Sahi Hai's strategy pages put CAGR and maximum drawdown side by side, and Nyra's Downside Protection pillar keeps the worst fall in view, so the routine takes minutes rather than an afternoon with spreadsheets.
Start Comparing PMS Strategies on Return and Pain
Before you commit Rs 50 lakh or more to a PMS, put every shortlisted strategy through the same two-number test: CAGR and maximum drawdown on the same window, divided into a Calmar ratio, set beside its benchmark. If a manager cannot show you a monthly drawdown history, ask for one. And if the strategy with the biggest return has the smallest Calmar ratio, make sure you know exactly what you would be signing up to sit through.
PMS Sahi Hai makes that test quicker: browse and shortlist PMS strategies with CAGR and maximum drawdown on every page, ask Nyra to explain how a strategy scores on downside protection, or run your current holdings through the free portfolio scan. Investments in securities markets are subject to market risks; past performance does not indicate future results.
PMS Sahi Hai is a distributor of Portfolio Management Services and Alternative Investment Funds, APMI-registered (Registration No. APRN08358). This article is for education only and is not investment advice, a recommendation, or an offer to buy or sell any security. Investments in securities markets are subject to market risks; read all scheme-related documents carefully. Past performance is not indicative of future results. Consult your advisor before investing.
Ishaan founded PMS Sahi Hai to make India's PMS, AIF and GIFT City markets legible to serious investors, comparing every SEBI-registered manager on the same comparative basis, with no shelf products and no commission bias.
Frequently asked
What is the Calmar ratio in simple terms?
The Calmar ratio is a portfolio's annual return divided by its maximum drawdown, the largest peak-to-trough fall, over the same period. It shows how much return you earned for each unit of worst-case loss. Terry W. Young introduced it in 1991 using a 36-month window. A higher ratio means more return per unit of drawdown, so it helps compare strategies that earned similar returns with very different falls.
What is the Calmar ratio formula?
The Calmar ratio formula is annualised return divided by the absolute value of maximum drawdown, both measured over the same window, traditionally 36 months. Most calculators use CAGR as the return; Young's original used the average annual return. Some versions subtract a risk-free rate first. For example, a 16.96% CAGR with a 25% maximum drawdown gives 16.96 ÷ 25 = 0.68.
How do you calculate the Calmar ratio from monthly returns?
Build a value series by starting at 100 and multiplying by one plus each monthly return. Track the running peak, compute each month's drawdown as value divided by peak minus one, and take the most negative figure as maximum drawdown. Compute CAGR from the first and last values. Divide CAGR by the absolute maximum drawdown. In Excel, MAX, MIN and ABS do most of the work.
What is a good Calmar ratio?
There is no regulatory standard. Common rules of thumb treat a multi-year Calmar ratio above 1.0 as acceptable, 1.0 to 2.0 as favourable, above 2.0 as strong and below 0.5 as weak. Context matters: a ratio measured through a crash is usually lower than one measured through a rally, so compare strategies on the same window and against their benchmark.
Is a higher Calmar ratio always better?
Usually, but not always. A higher ratio means more return per unit of worst-case loss on the chosen window. Very high values often come from short track records or calm periods with no real stress, and they can change sharply after a single bad quarter. Check the window, the data frequency and whether the period included a market correction before trusting a high number.
What is the difference between the Calmar ratio and the Sharpe ratio?
Both divide return by risk, but they define risk differently. The Sharpe ratio uses the standard deviation of returns, so it penalises upside and downside swings alike. The Calmar ratio uses maximum drawdown, the single worst peak-to-trough fall. A strategy with rare but deep losses can show a decent Sharpe ratio and a poor Calmar ratio, which is why analysts read both together.
What is the difference between the Calmar ratio and the MAR ratio?
The MAR ratio, popularised by the newsletter Managed Account Reports, divides compound annual return since inception by maximum drawdown since inception. The Calmar ratio uses only a recent window, traditionally the last 36 months, so old drawdowns eventually drop out. The two are often confused, and a "Calmar ratio since inception" on a factsheet is effectively a MAR ratio.
Does SEBI require PMS managers to disclose the Calmar ratio?
No. As of November 2026, SEBI's PMS performance-reporting rules require the time-weighted rate of return of each investment approach alongside a benchmark's trailing return, and they do not prescribe the Calmar ratio or any other risk ratio. Investors can compute it themselves from a strategy's CAGR and maximum drawdown for the same period, using the TWRR series rather than their personal XIRR.
Keep reading
All articles
What Is a Real Estate AIF? How Category II Property Funds Work
What a real estate AIF is, how equity, structured debt and mezzanine deals work, plus returns, tenure, exits, tax and risks for Indian investors.

What Is Venture Debt? The AIF Asset Class Funding Indian Startups
Venture debt explained for investors: how Category II AIFs lend to startups, how warrants add upside, real return data, risks and how to invest.
What Is Arbitrage PMS? Market-Neutral Returns and Tax Explained
Arbitrage PMS explained: cash-futures mechanics, why returns track rates, 2026 STT costs, tax vs arbitrage funds and who it suits.
Read it. Now pressure-test it.
Ask Nyra how this applies to your portfolio, or talk to our team, no pitch, no pressure.