
Downside Capture Ratio: What It Reveals About Bear-Market Losses
Downside capture ratio shows how much of a benchmark's fall a fund or PMS took. See the formula, worked examples and why a low number can mislead.

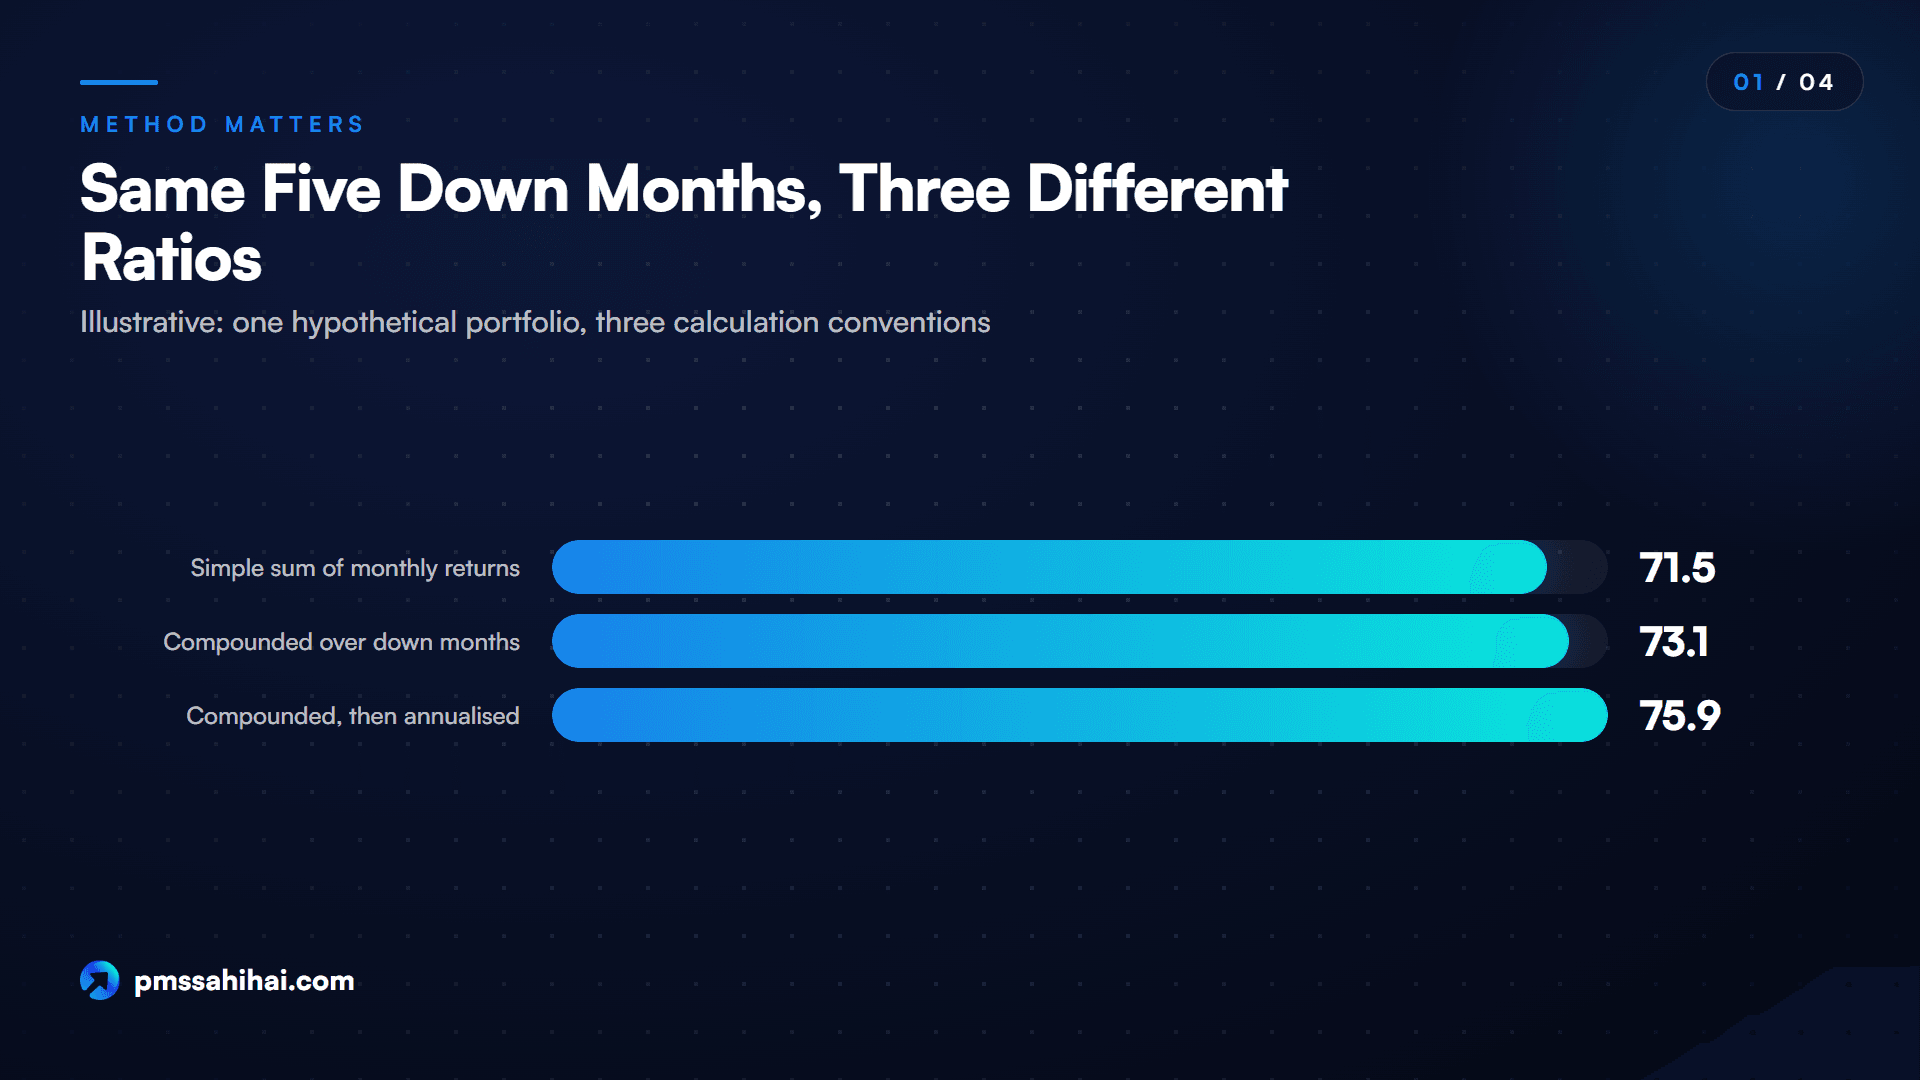
The downside capture ratio compares a fund's or PMS's return with its benchmark's return in the months when the benchmark fell, then multiplies by 100. A reading of 75 means the portfolio took about three-quarters of the benchmark's decline in those months. It is useful, but the number depends on the benchmark, the period and the calculation method, and our worked examples show the same data giving 71.5, 73.1 or 75.9. A low reading can also sit beside a deeper drawdown than the index, so read it with upside capture and maximum drawdown before you trust it.
Why Downside Capture Matters When Markets Fall
Every equity manager looks clever in a rising market. The harder question is what happened to clients' money when the index dropped, and whether the manager earned the fee in those months. The downside capture ratio is one of the simplest attempts to answer it.
Losses also matter more than gains of the same size, because of plain arithmetic. A portfolio that falls 30% needs a 42.9% gain to get back to where it started. A portfolio that falls 21% needs only 26.6%. The table below shows how that plays out if a benchmark falls 30% and a portfolio takes a given share of the fall.
| Share of a 30% fall taken | Portfolio loss | Rs 1 crore becomes | Gain needed to recover |
|---|---|---|---|
| 70 | 21% | Rs 79 lakh | 26.6% |
| 100 | 30% | Rs 70 lakh | 42.9% |
| 120 | 36% | Rs 64 lakh | 56.3% |
These are illustrative figures, and a real fund's ratio does not hold steady through a single fall. Still, they show why investors look at downside protection and not just headline returns: the portfolio that lost less has a shorter climb back.
This article explains what the ratio measures, how to compute it by hand, why two websites can show different numbers for the same fund, and how to use it for a Portfolio Management Service (PMS). Every example below uses made-up returns, labelled as such, and the arithmetic has been recomputed. None of it describes a real fund.
What the Downside Capture Ratio Actually Measures
The downside capture ratio, also called the down-market capture ratio, measures how a portfolio performed relative to a benchmark during the periods when the benchmark fell. Morningstar's Indian site describes the reading simply: below 100 means a fund has lost less than its benchmark in falling markets. Investopedia gives the same interpretation, saying a ratio of 80 means the portfolio declined only 80% as much as the index.
Three inputs define every reading:
- The portfolio's returns, usually monthly.
- A benchmark, which decides which months count as "down" and what the portfolio is measured against.
- A window, such as three or five years.
Change any one of them and the number changes. That is why a capture figure without its benchmark and window is close to meaningless.
How to Read Readings Below, At and Above 100
| Reading | What it says | What it does not say |
|---|---|---|
| Below 100 | Fell less than the benchmark in its down months | That the portfolio avoided losses |
| About 100 | Moved roughly with the benchmark in its down months | That the manager adds nothing overall |
| Above 100 | Fell more than the benchmark in its down months | That the fund is a bad holding, if upside is much stronger |
| Below 0 | Gained, on aggregate, while the benchmark fell | That this will repeat |
A reading is a ratio of losses, so it can look reassuring even when the money lost was large. A capture of 70 in a period when the benchmark fell 40% still means a loss of 28%.
Down Months Are Not the Same as a Bear Market
Here is the point most explainers skip. Despite the "bearish markets" label, the standard ratio does not isolate bear markets. A bear market is commonly defined as a fall of at least 20% from a recent high, and even that threshold is arbitrary. The ratio uses a much looser filter: any month in which the benchmark's return was negative.
So a five-year figure blends small monthly dips during a bull run with whatever real crash happened in that window. A month when the index fell 0.2% passes that filter just as a month when it fell 20% does. Compounding does give large moves more weight, but a manager with many mild down months can build a flattering number that says little about a severe sell-off. We work through exactly that case later.
If you want to know how a manager behaved in a specific bear market, ask for returns over that specific peak-to-trough period and compare them with the benchmark over the same dates. That is a separate, sharper question than the ratio answers.
How the Downside Capture Ratio Formula Works
The basic formula that nearly every source gives is:
Downside capture ratio = (portfolio return in benchmark down periods / benchmark return in the same periods) x 100
The only real debate is how to combine the monthly returns in the numerator and denominator. Morningstar's Indian site says it uses the geometric average for both the fund and the index. Many Indian explainers simply divide two figures, and some sum or average the months.
Step-by-Step Worked Example With Twelve Months of Returns
Take one hypothetical year for a portfolio and its benchmark.
| Month | Benchmark | Portfolio | Counts as down month? |
|---|---|---|---|
| 1 | -3.0% | -2.0% | Yes |
| 2 | +4.0% | +3.0% | No |
| 3 | -5.0% | -3.5% | Yes |
| 4 | +2.0% | +1.8% | No |
| 5 | -2.0% | -1.5% | Yes |
| 6 | +3.5% | +2.5% | No |
| 7 | -6.0% | -4.5% | Yes |
| 8 | +5.0% | +4.0% | No |
| 9 | +1.5% | +1.0% | No |
| 10 | -4.0% | -2.8% | Yes |
| 11 | +2.5% | +2.0% | No |
| 12 | +3.0% | +2.5% | No |
Step 1: Keep only the months when the benchmark fell. That leaves months 1, 3, 5, 7 and 10. The portfolio's return in the other months is ignored, whatever it was.
Step 2: Compound each series across those months. Convert each return to a growth factor (for example, -3% becomes 0.97), multiply them, and subtract 1.
- Benchmark: 0.97 x 0.95 x 0.98 x 0.94 x 0.96 - 1 = -18.51%
- Portfolio: 0.98 x 0.965 x 0.985 x 0.955 x 0.972 - 1 = -13.53%
Step 3: Divide and multiply by 100. -13.53 / -18.51 x 100 = 73.1.
The portfolio took about 73% of the benchmark's compounded loss in its down months. On Rs 1 crore, those five months would leave Rs 81.49 lakh in the benchmark and Rs 86.47 lakh in the portfolio. The benchmark would then need a 22.7% gain to recover, against 15.6% for the portfolio.
Over the full twelve months, the portfolio returned +2.06% and the benchmark +0.67%. The up months tell the other half of the story: the portfolio compounded +18.03% against +23.54%, for an upside capture of 76.6. This manager is quite defensive, not magical.
Why the Same Data Can Give Three Different Answers
Run those same five months through the conventions you will find in the market:
| Convention | Benchmark | Portfolio | Ratio |
|---|---|---|---|
| Simple sum, or simple average, of monthly returns | -20.00% | -14.30% | 71.5 |
| Compounded total over the down months | -18.51% | -13.53% | 73.1 |
| Compounded, then annualised to a 12-month rate | -38.81% | -29.46% | 75.9 |
A monthly geometric average also rounds to 71.5 here. Same data, same portfolio, and a spread of more than four points. None of these is wrong. MetricGate's documentation offers both compounded and arithmetic options and notes that compounding is the more common choice because it matches how wealth accumulates, while Motilal Oswal's explainer warns that providers using different methods may report different figures.
The practical rule follows directly. Compare two funds only when the same source calculated both, using the same method, benchmark and window. A difference of two or three points across two different websites may be nothing but method.
What a Negative Downside Capture Ratio Means
A negative reading comes from opposite signs. If the benchmark falls 5% and the portfolio rises 2%, the ratio is 2 / -5 x 100 = -40. That is good news arithmetically: the portfolio made money while the benchmark lost it. The freefincal calculator notes this usually appears only over short periods, and Fincash points out that simple division over one such period gives a figure that means little.
The figure also becomes unstable if the benchmark's aggregate return is close to zero, because you are dividing by a very small number. Treat readings far outside the normal range as a prompt to look at the underlying months, not as a finding.
How Capture Ratios Became a Standard Fund Metric
We could not find a reliable source naming who invented capture ratios or when, and we will not guess. What can be documented is how the measure reached ordinary investors.
By September 2012, Morningstar's Indian site was explaining upside and downside ratios to fund investors, publishing them for one, three, five, ten and fifteen years with category benchmarks. Its example fund showed a three-year upside of 103.83 and downside of 76.94 against the BSE 100 at that time. Independent Indian writers then built tools around the idea: the freefincal blog published a method explainer in 2016 and keeps a downside protection calculator built on monthly returns, last updated in January 2023 when we read it.
Today large Indian brokers and fund houses, including Angel One, 5paisa, Kotak Neo and Nippon India Mutual Fund, publish explainers on it. The evolution is really one of access. A calculation that needs only a monthly return series went from a data-vendor field to a standard item on a retail fund page.
Where Investors Use Downside Capture Today
Modern tools have made the ratio easy to produce. A spreadsheet needs just three columns: month, portfolio return, benchmark return. A filter on the benchmark column and a product formula do the rest. Analysts' calculators such as MetricGate add options for arithmetic or compounded aggregation and warn about having too few periods.
Investors and advisers use it in four main ways:
- Screening within a category. Kotak Neo's guide, like most, stresses comparing funds in the same category against a suitable benchmark.
- Checking a manager's claim. If a manager markets itself as defensive, a downside capture persistently near or above 100 deserves a question.
- Building a mix. Holding a low-capture manager beside a high-participation one changes how the combination behaves, though you would want to test the combined return series and not simply average the ratios.
- Monitoring over time. A jump in the ratio after a change in manager or process may be the first visible sign of a different portfolio.
Benefits of Tracking Downside Protection With This Ratio
Used carefully, the measure earns its place for several reasons.
- It is intuitive. "Took 75% of the fall" needs no statistics training, unlike a standard deviation figure.
- It is benchmark-relative. It separates a falling market from a failing manager. A 10% loss looks very different if the index lost 15%.
- It looks only at the months investors worry about. Volatility treats a sharp rally and a sharp fall alike. This ratio focuses on the falling side, though in a different way from the Sortino ratio, which measures a portfolio's own downside deviation rather than its behaviour against an index.
- It is checkable. Given monthly returns, you can recompute it in a few minutes, as above, instead of accepting a marketing line.
- It pairs naturally with upside capture. The two figures together show the shape of a manager's participation.
- It adds information beyond beta. Beta summarises sensitivity to the market in one number. Separate up and down figures can show whether that sensitivity differs by direction.
In practical terms, it turns a vague worry, "will this manager protect me?", into a number you can ask for and a set of follow-up questions.
How PMS Sahi Hai Helps You Read Downside Capture in Context
We are not aware of PMS Sahi Hai publishing downside capture ratios as a field, so check the strategy page you are viewing, and treat this as a way of working toward the number rather than a screen that hands it to you.
- Shortlist on the same benchmark. The compare page lists PMS, AIF and GIFT City strategies with filters that include category, fund house and benchmark, and lines up to four side by side. Since the ratio moves with the benchmark, filtering to one benchmark first keeps the later comparison fair.
- Use Nyra to frame the questions. Nyra is the platform's AI research tool. You can ask it in plain English what a term means or how two strategies differ, then take the checklist in this article to the manager.
- Read the score for what it is. Nyra's published methodology lists five pillars: return performance, risk-adjusted return, downside protection, consistency, and structure and stewardship. Strategies with under 12 months of track record show as "Not Rated". A pillar called downside protection is related in spirit to this ratio, but we have not confirmed that capture ratios feed into it, so do not treat the score as a capture figure.
- Keep the score in its place. The methodology page itself says that a high-scoring strategy can be completely wrong for your risk profile, horizon or tax position. Nyra describes itself as an analytical tool, not a SEBI-registered investment adviser.
- Bring it to a person. If the monthly data a manager sends you is hard to interpret, you can talk to the team before committing.
The aim is simple: use the platform to line up like with like, then ask each manager for the monthly numbers the ratio actually needs.
Reading Downside Capture for a PMS in India
Most ranking explainers stop at mutual funds, where monthly data is widely published. A PMS has some specific wrinkles, under rules current on 30 October 2026.
No rule that we can find requires it. SEBI requires portfolio managers to present the time-weighted rate of return (TWRR) of an investment approach with the trailing return of the selected benchmark, and to report each investor's XIRR with the minimum, maximum and median across investors. A text search of SEBI's 207-page Master Circular of 16 July 2025 found no mention of downside capture or drawdown as a reporting item. So if your factsheet does not show the ratio, that is not a compliance gap; you simply need to ask. The SEBI (Portfolio Managers) Regulations, 2026 take effect on 1 April 2027, and reporting detail may change, so check for a newer circular.
Ask for monthly TWRR. TWRR strips out the effect of client deposits and withdrawals, which is what you want when judging the manager. Do not build the ratio from your own account's XIRR, because that mixes in your timing. SEBI's mandated disclaimer itself says that your performance may vary from the approach's because of the timing of flows and differences in portfolio composition.
Performance is net, and that matters in a down month. The Master Circular says performance data must be reported net of all fees and all expenses, including taxes. As an illustration, a 2.5% annual fee is about 0.21% a month, so a gross -4.00% month becomes about -4.21%. Check that you are comparing a net PMS series with the total return variant of the index.
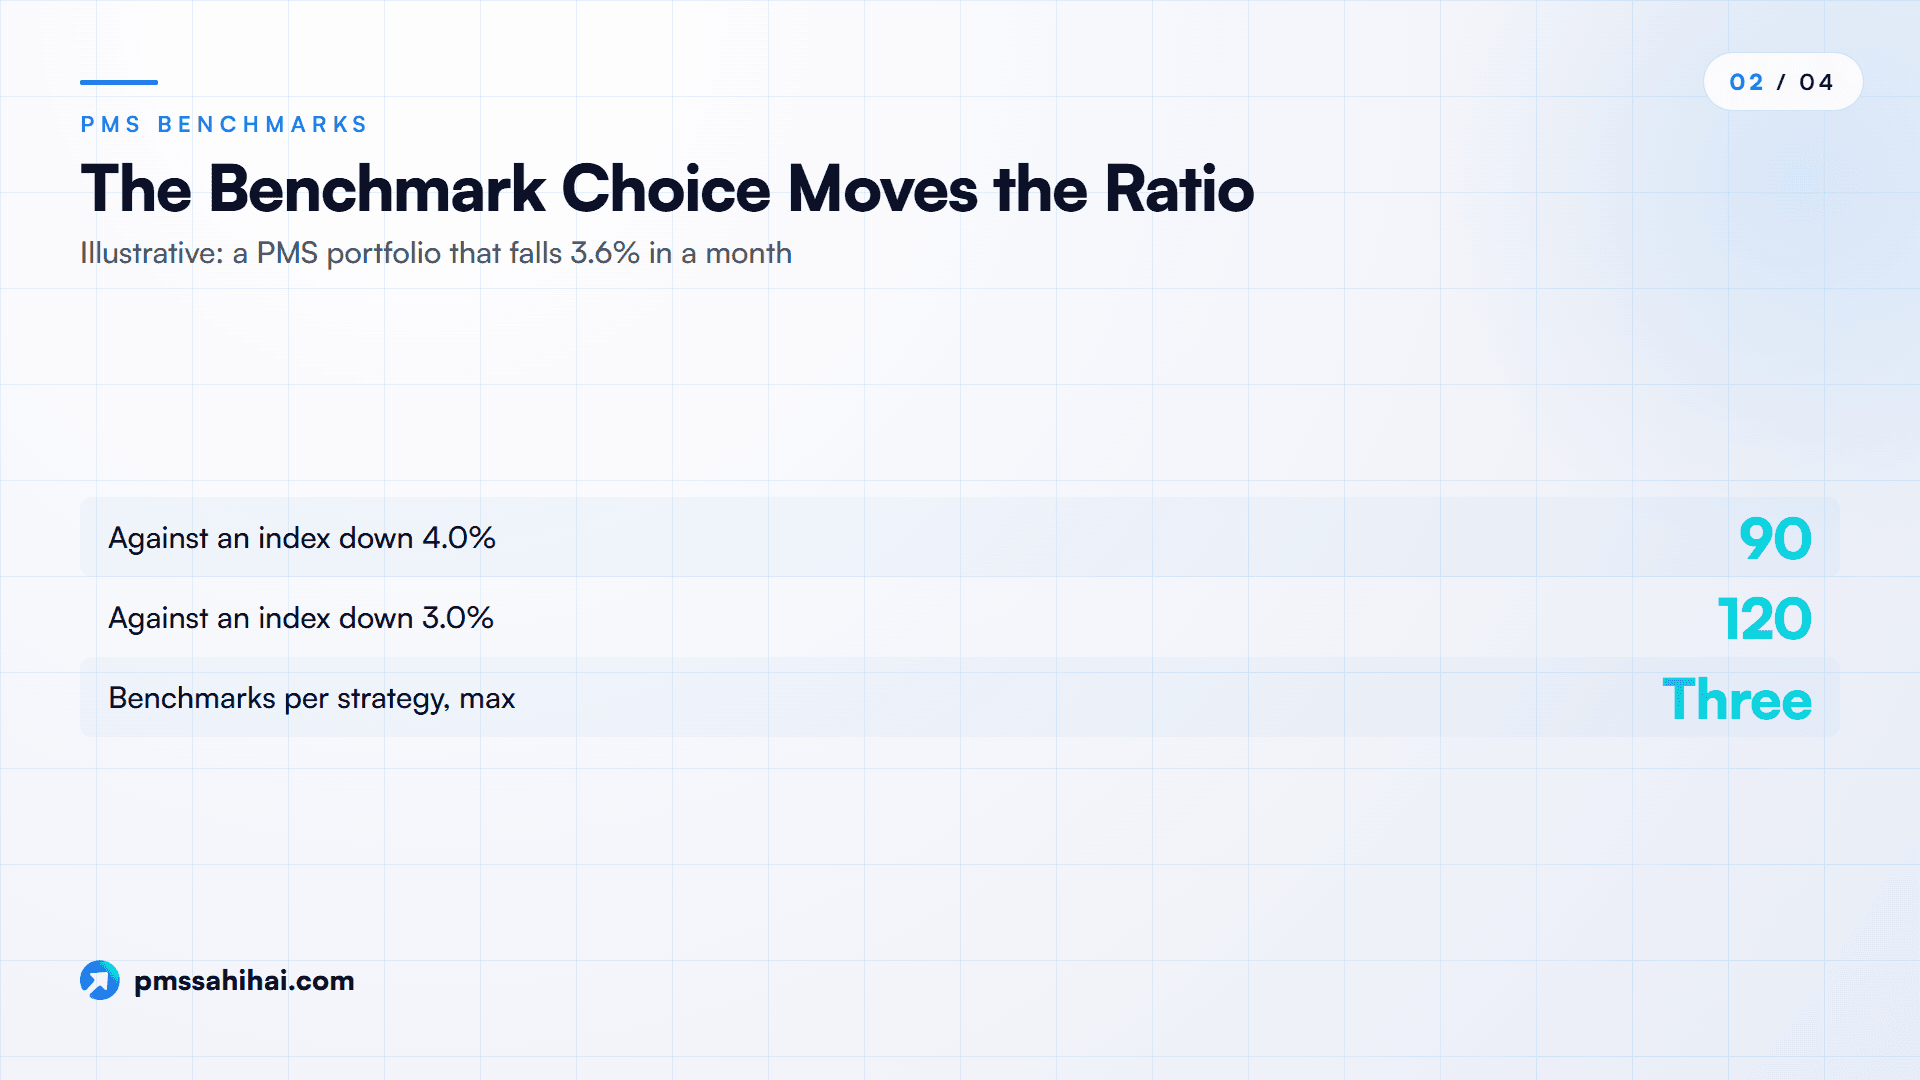
Check which benchmark was selected. Under the Master Circular, each investment approach is tagged to one strategy (Equity, Debt, Hybrid or Multi Asset) and APMI prescribes up to three benchmarks per strategy. APMI's annexure dated 31 March 2023 lists Nifty 50, S&P BSE 500 and MSEI SX 40 for equity and notes that all equity indices are total return indices. Check APMI's current list. The manager's choice directly moves the ratio. If a portfolio falls 3.6% in a month, the reading is 90 against an index that fell 4.0%, and 120 against one that fell 3.0%. For a small-cap approach compared with a large-cap index, a low capture can reflect a mismatch more than protection. Our guide to benchmark selection in PMS covers that trap in detail.
Cash counts, for better or worse. Performance must include cash holdings and liquid fund investments. So a portfolio holding 25% cash and matching the index with the rest would show a capture of 75 in a month when the index fell 20% (0.75 x -20 = -15). That is real protection for the investor, but it is an allocation call, and it will weigh on upside capture later. Ask how much of the reading came from cash and how much from stock selection.
Comparisons have limits. SEBI's own monthly data page cautions that the performance of one portfolio manager may not be comparable with another's, since portfolios are individual rather than pooled units. A PMS with concentrated holdings can also produce wider swings than a diversified fund, and changing a benchmark tag has consequences: the Master Circular says the earlier track record of that approach can no longer be used for performance reporting after a re-tag.
Limitations of the Downside Capture Ratio in Real Bear Markets
The measure has real weaknesses, and they show up when you most want to rely on it.
A blended number can hide a crash. Suppose a benchmark has six mild down months and one crash, all hypothetical:
| Period | Benchmark | Portfolio | Capture |
|---|---|---|---|
| Six mild months (-1, -1.5, -1, -2, -1.2, -1 for the benchmark; -0.5, -0.7, -0.5, -1, -0.6, -0.5 for the portfolio) | -7.46% | -3.74% | 50.1 |
| Crash month | -20.00% | -22.00% | 110.0 |
| All seven months | -25.97% | -24.92% | 96.0 |
The portfolio takes only half the loss through the mild months, then falls harder when it matters. The blended 96 gives no hint of that pattern. Over a longer calm stretch with more mild months, the headline would look better still.
It says nothing about months when the benchmark rose. This is the most surprising limitation. Below are two hypothetical portfolios against the same benchmark over twelve months.
| Month | Benchmark | Portfolio Q | Portfolio L |
|---|---|---|---|
| 1 | -4.0% | -2.5% | -4.5% |
| 2 | +3.0% | -2.0% | +3.0% |
| 3 | -5.0% | -3.0% | -5.5% |
| 4 | +2.0% | -2.5% | +2.5% |
| 5 | -3.0% | -2.0% | -3.5% |
| 6 | +2.0% | -2.0% | +2.5% |
| 7 | -4.0% | -2.5% | -4.5% |
| 8 | +3.0% | +1.0% | +3.5% |
| 9 | +2.0% | +1.5% | +2.5% |
| 10 | -2.0% | -1.0% | -2.5% |
| 11 | +2.0% | +1.5% | +2.5% |
| 12 | +3.0% | +2.0% | +3.5% |
| Measure | Benchmark | Portfolio Q | Portfolio L |
|---|---|---|---|
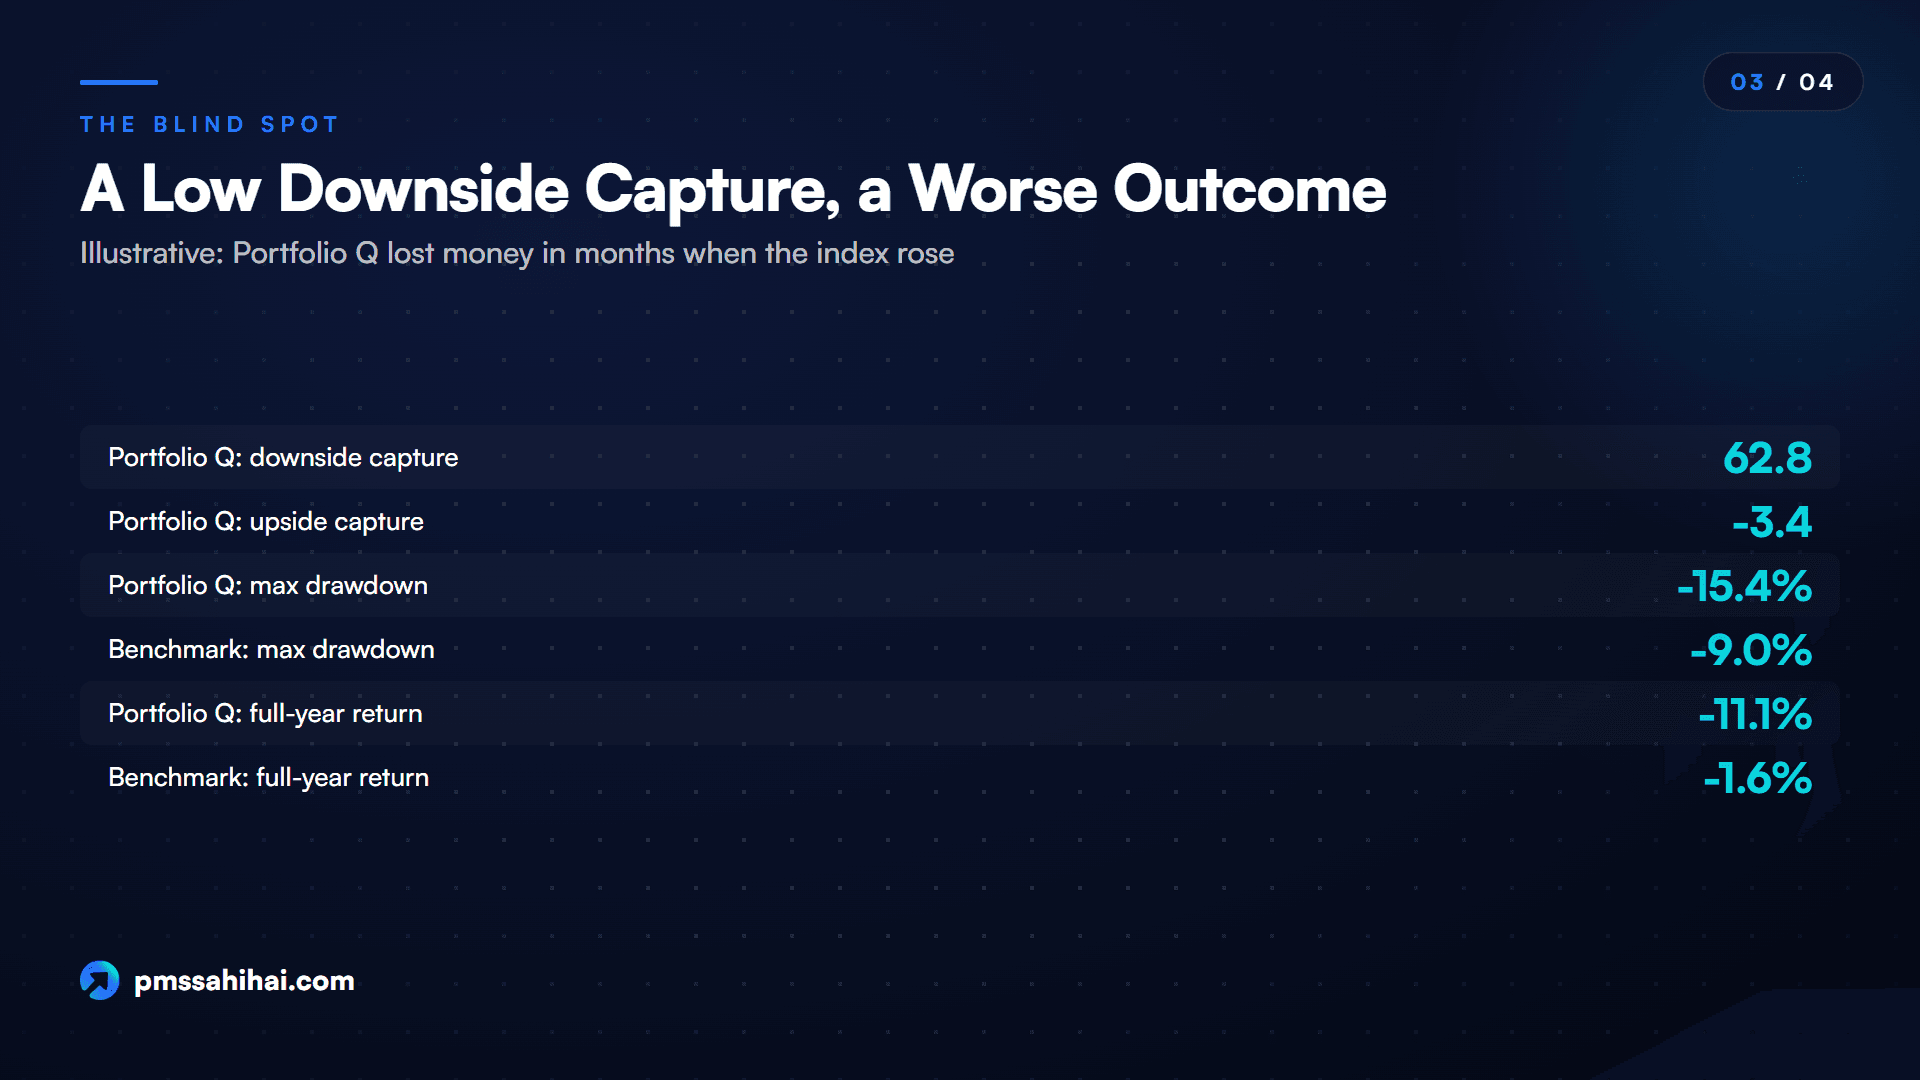
| Downside capture | 100.0 | 62.8 | 112.7 |
| Upside capture | 100.0 | -3.4 | 119.2 |
| Maximum drawdown | -9.0% | -15.4% | -10.0% |
| Full-year return | -1.6% | -11.1% | -1.2% |
Portfolio Q has the lovely downside figure and the worst outcome by a wide margin. It lost money in months when the index was rising, and those months never enter the downside calculation. Its maximum drawdown, the peak-to-trough fall in its own value, is far deeper than the benchmark's. Portfolio Q's pattern is deliberately extreme, but the lesson stands: a low downside capture is not proof of a shallow drawdown. Our piece on how far a PMS portfolio can fall covers drawdown properly.
It looks backward. Past behaviour describes the portfolio the manager held then. Several sources make the same point, including Angel One and Motilal Oswal, and they note that a new manager or changed process can make history a poor guide.
Small samples make it noisy. Fewer periods mean a less stable figure, and a few extreme months can dominate. A one-year reading may rest on a handful of down months, which is why several sources prefer three to five years or more. Morningstar's Indian site also cautions against judging on a single market cycle.
It ignores exit costs and your tax. Angel One's explainer lists exit loads and taxes among the things it leaves out. For a PMS, your own tax outcome depends on your transactions and residence, so speak to a tax adviser about that part.
There is also a selection effect. Lists of top capture figures only include funds still in existence, and survivorship bias flatters any such table. Strategies closed after a poor down market do not appear.
A defensive reading can have a cost. Morningstar's Indian site notes that most funds show a trade-off: strong upside tends to come with weaker downside protection, and defensive funds may lag when a bull run begins.
Pairing Downside Capture With Upside Capture
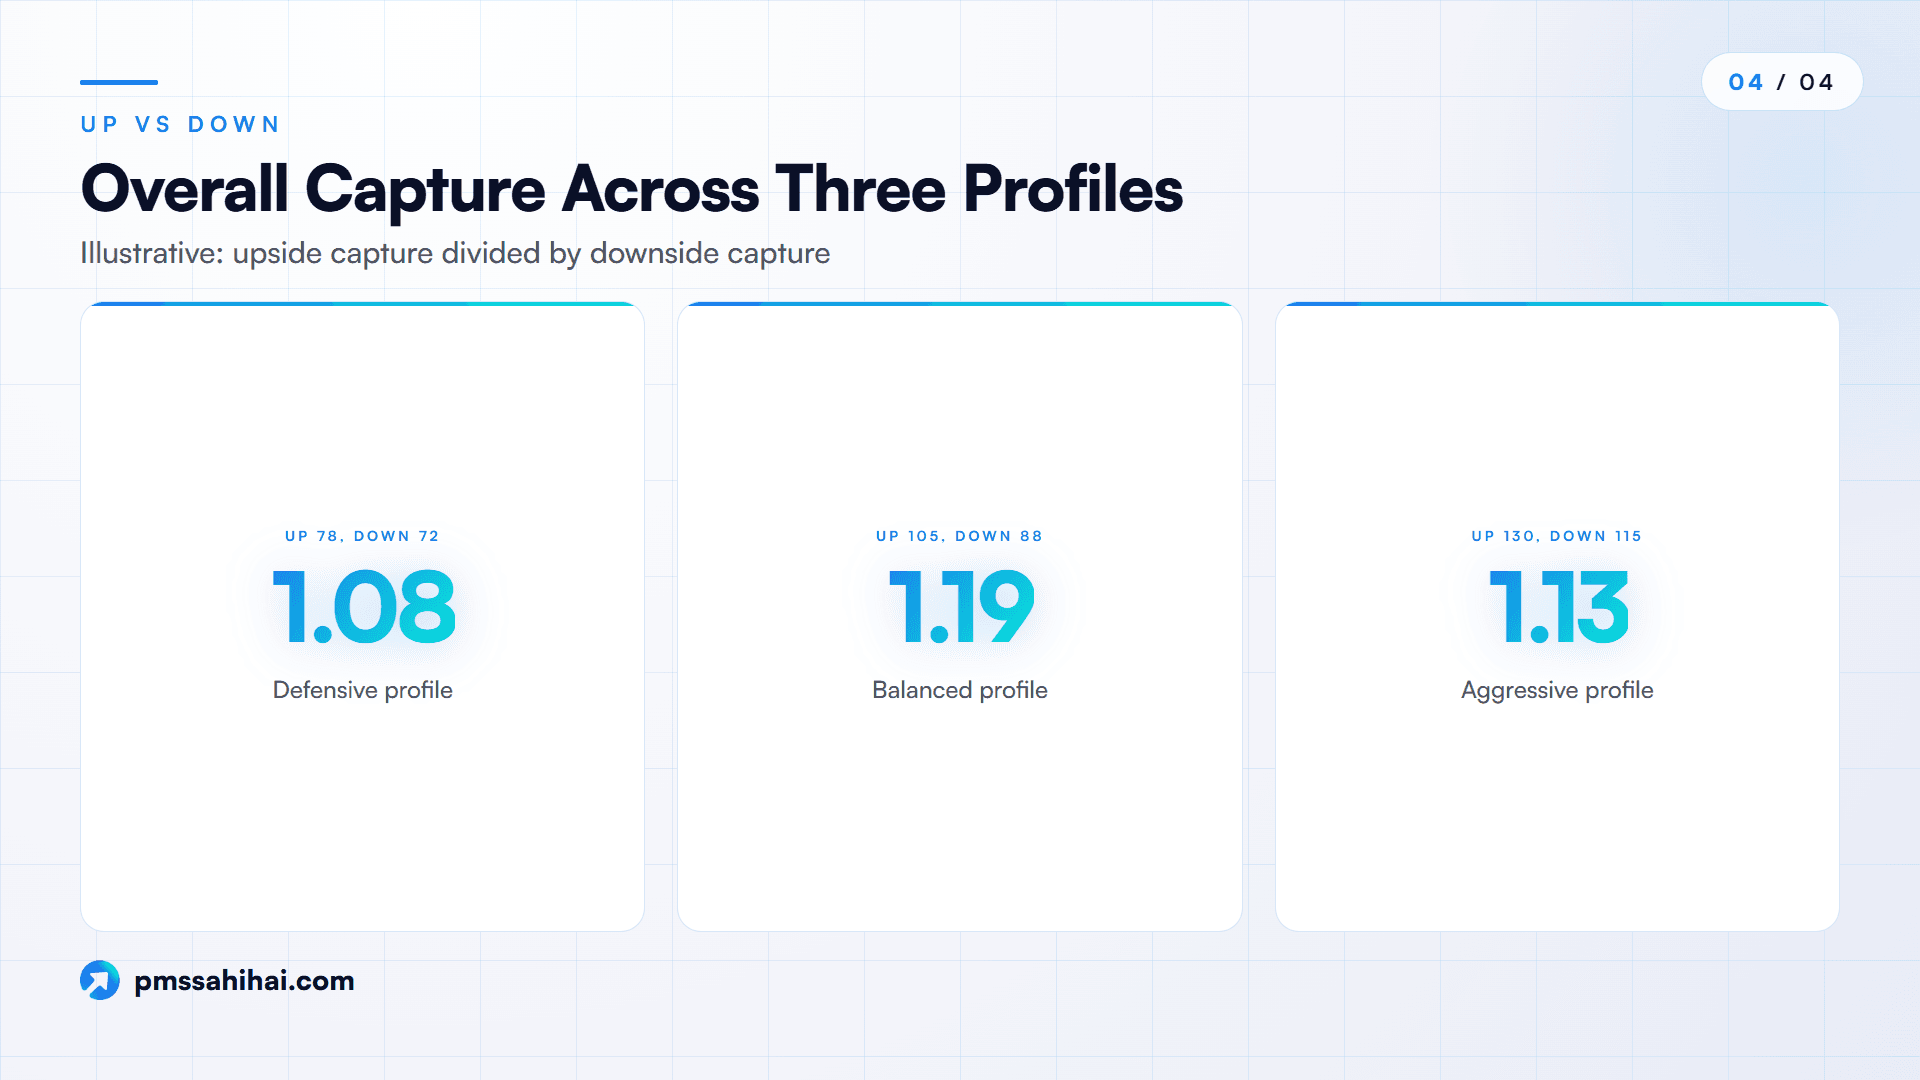
The figure means little alone. A common summary is the overall capture ratio: upside capture divided by downside capture. Investopedia's examples are 140 / 110 = 1.27 and 90 / 70 = 1.29. Both managers look similar on this measure, despite very different rides.
Here are three hypothetical profiles.
| Profile | Upside capture | Downside capture | Overall capture | Likely feel |
|---|---|---|---|---|
| Defensive | 78 | 72 | 1.08 | Smoother, lags rallies |
| Balanced | 105 | 88 | 1.19 | Keeps up, falls less |
| Aggressive | 130 | 115 | 1.13 | Runs ahead, falls harder |
Notice that the aggressive profile has a higher overall figure than the defensive one. If you are close to needing the money, you may still prefer the defensive shape, because the sequence of returns matters to you more than the ratio. The overall figure summarises a trade-off; it does not make your choice. Our companion pieces cover upside capture on its own, and our guide to reading a PMS factsheet shows where such numbers fit in a wider review.
So what is a good number? No source we read gives a universal target, and 5paisa says plainly that no single range suits every category. A reasonable reading for a long-only equity PMS is consistently below 100 over more than one window, with an upside figure that justifies the fee. Passive index funds generally sit close to 100, which gives you a sanity check: a high-fee active manager near 100 on both sides should explain what you are paying for. Compare a manager with category peers, not with an abstract target. Debt or hybrid approaches need their own benchmark and cannot be judged by the same figure.
A Practical Checklist Before You Trust the Number
When a manager, distributor or website quotes a downside capture ratio, work through these questions:
- Which benchmark, and is it a total return version? Is it the one tagged to the approach? SEBI moved mutual fund benchmarks to total return indices from 1 February 2018, and a price-only index flatters any manager in a falling month.
- What window, and how many down months does it contain? Does it include a severe fall, or just mild dips?
- Which method? Compounded, annualised or simple? Is the same source used for every fund you are comparing?
- Net or gross? Is it based on time-weighted return net of fees for the investment approach?
- Did the manager, process or benchmark change during the window?
- How much cash was held in the falls?
- What was the return in the worst specific fall? Ask for actual peak-to-trough numbers against the benchmark.
- What is the maximum drawdown and the upside capture for the same window? Add alpha and beta, and our alpha and beta guide explains those.
- Do the ratios hold over one, three and five years? Consistency is more telling than a single figure.
What the Downside Capture Ratio Can and Cannot Tell You
The downside capture ratio is an honest, easy test of how a portfolio behaved when its benchmark fell. It is not a measure of total risk, and it is not a forecast. Use it as the opening question in a conversation with a manager, and treat a low reading as a reason to look further, not a reason to invest. PMS Sahi Hai and Nyra can help you line up strategies and shape those questions, but the monthly data has to come from the manager.
Compare Downside Behaviour Before You Commit Capital
Pick two or three strategies on PMS Sahi Hai's compare page, ask Nyra to explain anything unclear, then ask each manager for monthly net TWRR and the benchmark series and calculate the downside capture ratio yourself using one method. If you want a second view, speak to the team. This article is general information, not investment advice; past results do not predict future returns.
PMS Sahi Hai is a distributor of Portfolio Management Services and Alternative Investment Funds, APMI-registered (Registration No. APRN08358). This article is for education only and is not investment advice, a recommendation, or an offer to buy or sell any security. Investments in securities markets are subject to market risks; read all scheme-related documents carefully. Past performance is not indicative of future results. Consult your advisor before investing.
Ishaan founded PMS Sahi Hai to make India's PMS, AIF and GIFT City markets legible to serious investors, comparing every SEBI-registered manager on the same comparative basis, with no shelf products and no commission bias.
Frequently asked
What is the downside capture ratio in simple terms?
It shows how much of a benchmark's decline a fund or PMS took during the periods when the benchmark fell. The calculation divides the portfolio's return in those periods by the benchmark's return and multiplies by 100. A reading of 80 means the portfolio fell about 80% as much as the benchmark in those months, and a reading above 100 means it fell more.
How do you calculate downside capture ratio from monthly returns?
Keep only the months in which the benchmark's return was negative. Compound the portfolio's returns across those months, compound the benchmark's returns too, then divide the portfolio figure by the benchmark figure and multiply by 100. In our example, -13.53% divided by -18.51% gives 73.1. Other providers may average or annualise, which changes the result slightly.
What is a good downside capture ratio?
There is no universal target, because the right range depends on category, benchmark and period. For a long-only equity strategy, a reading consistently below 100 across several windows is a reasonable starting test, especially if upside capture stays strong. Compare managers against category peers using one data source. A lower number is not automatically better if it comes with weak upside.
Is the downside capture ratio the same as maximum drawdown?
No. Downside capture compares a portfolio with its benchmark only in months when the benchmark fell. Maximum drawdown measures the largest peak-to-trough fall in the portfolio's own value, in any months. A portfolio can show a low capture and still have a deeper drawdown than the index, as our Portfolio Q example shows with 62.8 capture and a 15.4% drawdown.
What does a negative downside capture ratio mean?
It means the portfolio's aggregate return was positive while the benchmark's was negative in the months measured. For example, a 2% gain against a 5% fall gives -40. This is a favourable result, but it tends to show up over short windows. Check how many down months are involved, because a handful of periods can produce unusual readings that do not persist.
Do PMS factsheets have to show downside capture ratio?
We found no SEBI requirement for it. SEBI's rules require TWRR for the investment approach, the benchmark's trailing return and investor-level XIRR with a range across investors. A text search of the July 2025 Master Circular found no capture ratio reporting item. Some managers may show it voluntarily, so ask for the figure along with its benchmark, window and method.
Which period should I use to judge downside capture?
Use more than one, and prefer longer windows. Morningstar's Indian site publishes one, three, five, ten and fifteen years, while several guides suggest at least three to five years. Check that the window includes a meaningful market fall, since a calm period produces few down months. Then look separately at how the portfolio did in the worst specific fall.
Why do websites show different capture ratios for the same fund?
Usually because they use different benchmarks, windows, data dates or calculation methods. Our example gives 71.5 with simple sums, 73.1 with compounding and 75.9 with annualising, all from the same five months. So compare funds only within a single source, and read a small gap between sites as a likely method difference, not a real change in performance.
Keep reading
All articles
What Is a General Power of Attorney (GPA)? Scope, Risks and Limits
What a general power of attorney (GPA) can and cannot do in India: scope, stamp duty, registration, risks, revocation and when to avoid one.
Nifty Fell 16% From Its High in 2026: What It Means for Your PMS
Nifty fell 16% peak to trough in 2026. What it means for PMS holders: the ₹50 lakh floor, high-water marks, exit loads, loss set-off and switching costs.
What Is Micro Cap PMS? The Highest-Risk Corner of Portfolio Management
Micro cap PMS explained: no SEBI category, impact cost, SME stocks, ASM/GSM/ESM curbs, drawdowns, position sizing and who it really suits.
Read it. Now pressure-test it.
Ask Nyra how this applies to your portfolio, or talk to our team, no pitch, no pressure.