
What Is Factor Investing? Momentum, Quality and Value for PMS Investors
What factor investing means for PMS investors: momentum, quality, value and low volatility, Indian factor index data, cycles, costs and tax.


Factor investing means building a portfolio around measurable stock traits, such as recent price strength (momentum), strong balance sheets (quality) and low prices against fundamentals (value), that research has linked to returns over long periods. In India, NSE runs factor indices for each of these, and their numbers show how differently factors behave: over the five years to 30 September 2026, the Nifty200 Value 30 returned 22.91% a year while the Nifty200 Quality 30 returned 6.40%. Factors take turns, they can suffer deep drawdowns, and inside a PMS their turnover creates fees and tax that an index fund avoids. Before you put ₹50 lakh into any PMS, find out which factors it leans on and whether you are paying active fees for a tilt you could buy cheaply.
Why Factor Investing Matters to PMS Investors
Every portfolio manager has a story. One talks about "compounders with pricing power". Another talks about "riding sector leadership". A third promises "deep value in out-of-favour businesses". Strip the language away and most of these stories turn into a small set of measurable traits that academics call factors.
That is why factor investing matters even if you never buy a fund with "factor" in its name. A concentrated PMS of 25 stocks almost always leans towards one or two factors. If you know which ones, you can predict how it may behave when markets turn, judge whether its past returns came from skill or from a factor in favour, and ask whether a cheaper product gives the same exposure.
This guide explains each factor, shows how NSE builds its factor indices and what they returned up to 30 September 2026, why factors go in and out of favour, and what changes when you hold a factor tilt through a PMS. Our separate guide on quant PMS covers how model-driven managers run money; this article stays with the factors themselves.
What Factor Investing Means in Plain Terms
A factor is a characteristic shared by a group of stocks that helps explain why some stocks earn more than others over time. Factor investing is the practice of deliberately tilting a portfolio towards the characteristics you believe will be rewarded, using rules rather than one-off judgments.
Think of a cricket selector who picks players by strike rate and average instead of reputation. In the same way, a factor portfolio ranks every stock in a universe, such as the Nifty 200, on a score, keeps the top names and rebalances on a calendar.
Factors Versus Stock Stories
The main factors you will meet are:
| Factor | What it measures | Typical inputs | The idea behind it |
|---|---|---|---|
| Momentum | Recent relative price strength | 6- and 12-month returns | Winners tend to keep winning for a while |
| Quality | Financial strength and steadiness | ROE, debt-to-equity, earnings variability | Strong, steady businesses are under-rewarded |
| Value | Price against fundamentals | Earnings, book value, sales, dividends to price | Cheap stocks are often cheaper than they deserve |
| Low volatility | Price stability | Standard deviation of daily returns | Calmer stocks have delivered more than their risk suggests |
| Size | Company size | Free-float market capitalisation | Smaller firms were once thought to beat large ones |
None of these is a promise. Each is a tendency seen in long runs of historical data, with long periods when it did not work.
Factor Investing, Quant PMS and Smart Beta Are Different Labels
Three labels often get mixed up. Factor investing is the idea: target traits that explain returns. A quant PMS is one way to run money, where a model rather than a manager's judgment picks the stocks; most quant models use factors, but a discretionary manager can have a factor tilt too. Smart beta usually refers to rule-based indices and the index funds or ETFs that track them, of which factor indices are one family; we cover smart beta separately.
Where Factor Investing Came From: CAPM to Five Factors
In the 1960s, the Capital Asset Pricing Model (CAPM) said one factor mattered: a stock's sensitivity to the market, its beta. The data soon disagreed. In 1972, Black, Jensen and Scholes found the link between beta and return flatter than CAPM predicted, and Haugen and Heins, using US data from 1926 to 1971, found lower-variance portfolios had earned higher average returns, the seed of the low volatility factor.
Sanjoy Basu documented a value effect in 1977 and Rolf Banz a size effect in 1981. In 1992 and 1993, Eugene Fama and Kenneth French combined these into the Fama-French three-factor model: market, size (small minus big, or SMB) and value (high minus low book-to-market, or HML). In 1993, Narasimhan Jegadeesh and Sheridan Titman showed in the Journal of Finance that stocks with strong returns over the previous three to twelve months tended to keep outperforming, and Mark Carhart added momentum to the model in 1997. In 2015, Fama and French moved to five factors, adding profitability, often treated as the core of the quality factor, and investment.
MSCI's 2013 paper "Foundations of Factor Investing" named six equity factors that had historically earned a long-term premium: value, low size, low volatility, high yield, quality and momentum. In India, Sobhesh Agarwalla, Joshy Jacob and Jayanth Varma at IIM Ahmedabad began publishing Indian factor data in 2013. NSE launched the Nifty Alpha 50 in November 2012, the Nifty100 Low Volatility 30 in July 2016, the Nifty200 Quality 30 in April 2018, the Nifty200 Momentum 30 in August 2020 and the Nifty200 Value 30 in June 2024. According to INDmoney, assets in Indian factor funds grew from ₹6,863 crore in December 2022 to ₹37,749 crore in December 2024.
The Momentum Factor: Buying What Is Already Working
The momentum factor rests on a simple observation: stocks that have risen strongly relative to others over the past six to twelve months tend to keep doing so for a while. The effect was first documented in Jegadeesh and Titman's 1993 study of buying winners and selling losers, and the usual explanations are behavioural. Investors under-react to good news at first, then pile in late, so trends last longer than they should.
Momentum has the strongest long-run record of the Indian factors on one widely used measure. The IIM Ahmedabad factor data library for Indian equities, which runs from October 1993 to December 2025, puts the annualised return of its winners-minus-losers (WML) momentum portfolio at 10.65% a year since 1 January 1994, against a market premium of 4.93%. These are long-short research portfolios, not investable funds, but they show that the momentum effect is not a quirk of US data.
How NSE Builds the Nifty200 Momentum 30
The Nifty200 Momentum 30 is the benchmark most Indian momentum products track. According to the NSE Indices factsheet dated 30 September 2026, it works like this:
- Universe: the 200 stocks of the Nifty 200.
- Score: each stock's 6-month and 12-month price returns, adjusted for the volatility of its daily returns, are combined into a normalised momentum score.
- Selection: the top 30 stocks by score.
- Weighting: free-float market capitalisation multiplied by the momentum score, capped at the lower of 5% or five times the stock's plain market-cap weight.
- Rebalancing: semi-annual.
Even with the volatility adjustment, the index is far more active than its parent. HDFC Mutual Fund's review of the June 2026 rebalance found 22 new additions and only 8 continuing stocks, with Financial Services falling from about 48% of the index to about 21% and Capital Goods rising to about 26%, against 6.5% in the Nifty 200. Momentum goes wherever the trend is, and the trend moves.
The 2024–25 Momentum Drawdown
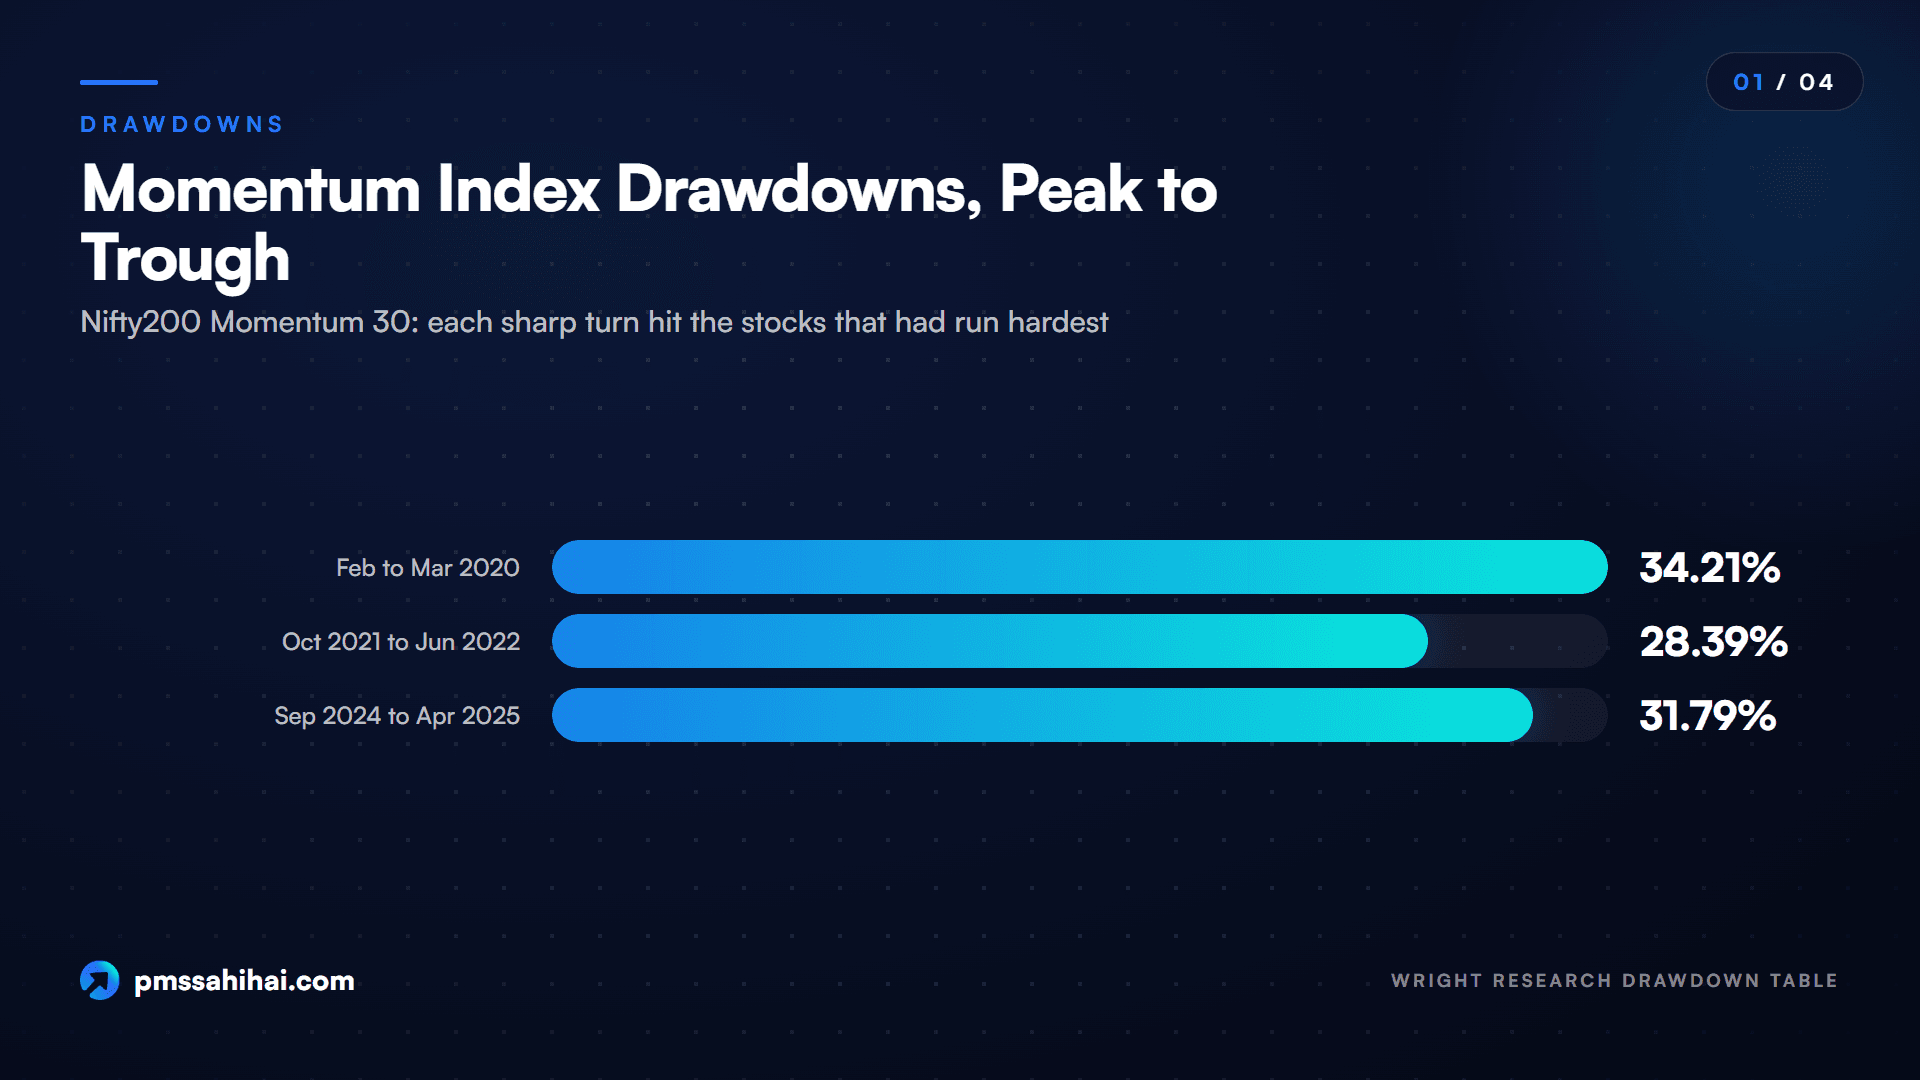
The cost showed up in 2024–25. A drawdown table published by Wright Research shows the Nifty200 Momentum 30 fell 31.79% from its peak on 27 September 2024 to 7 April 2025, and had not recovered by August 2025. INDmoney measured a 31.25% fall between 23 September 2024 and 15 March 2025, against 17.52% for the Nifty100 Low Volatility 30.
The same table lists a 34.21% fall in February–March 2020 and a 28.39% fall between October 2021 and June 2022. Each time, momentum held the stocks that had run hardest, and they fell hardest when the market turned. A momentum factor portfolio needs a holding period long enough to sit through such a fall without selling at the bottom.
The Quality Factor: Paying for Strong Balance Sheets
The quality factor favours companies with high and stable profitability, low debt and steady earnings. In everyday terms, it buys the businesses you would happily own if the market shut for five years. The case for quality is that investors underpay for boring reliability and overpay for exciting but fragile stories.
The Nifty200 Quality 30 makes this concrete. Its quality score uses three inputs measured over the previous five years: return on equity, financial leverage (the debt-to-equity ratio) and the variability of earnings-per-share growth. The 30 highest-scoring Nifty 200 stocks are weighted by a combination of quality score and the square root of free-float market capitalisation, with a 5% cap per stock, and the index rebalances semi-annually. At 30 September 2026, Fast Moving Consumer Goods (24.88%) and Information Technology (24.27%) made up nearly half the index.
What the Indian Evidence Says About Quality
The strongest Indian evidence for the quality factor comes from a study by Joshy Jacob, K P Pradeep and Jayanth Varma, released on SSRN in November 2022 and summarised by Quantpedia. Using data from April 1995 to March 2021, they found that a quality-minus-junk portfolio earned an average of 1.69% a month, more than momentum (1.62%) or the market (1.33%), with lower volatility than momentum (6.71% against 7.16%) and shallower average drawdowns. Its alpha after controlling for market, size, value and momentum was about 0.92% a month. The authors argued that quality matters even more in India than in developed markets, linking it to governance: where some promoters can divert profits, real and steady profitability is worth more.
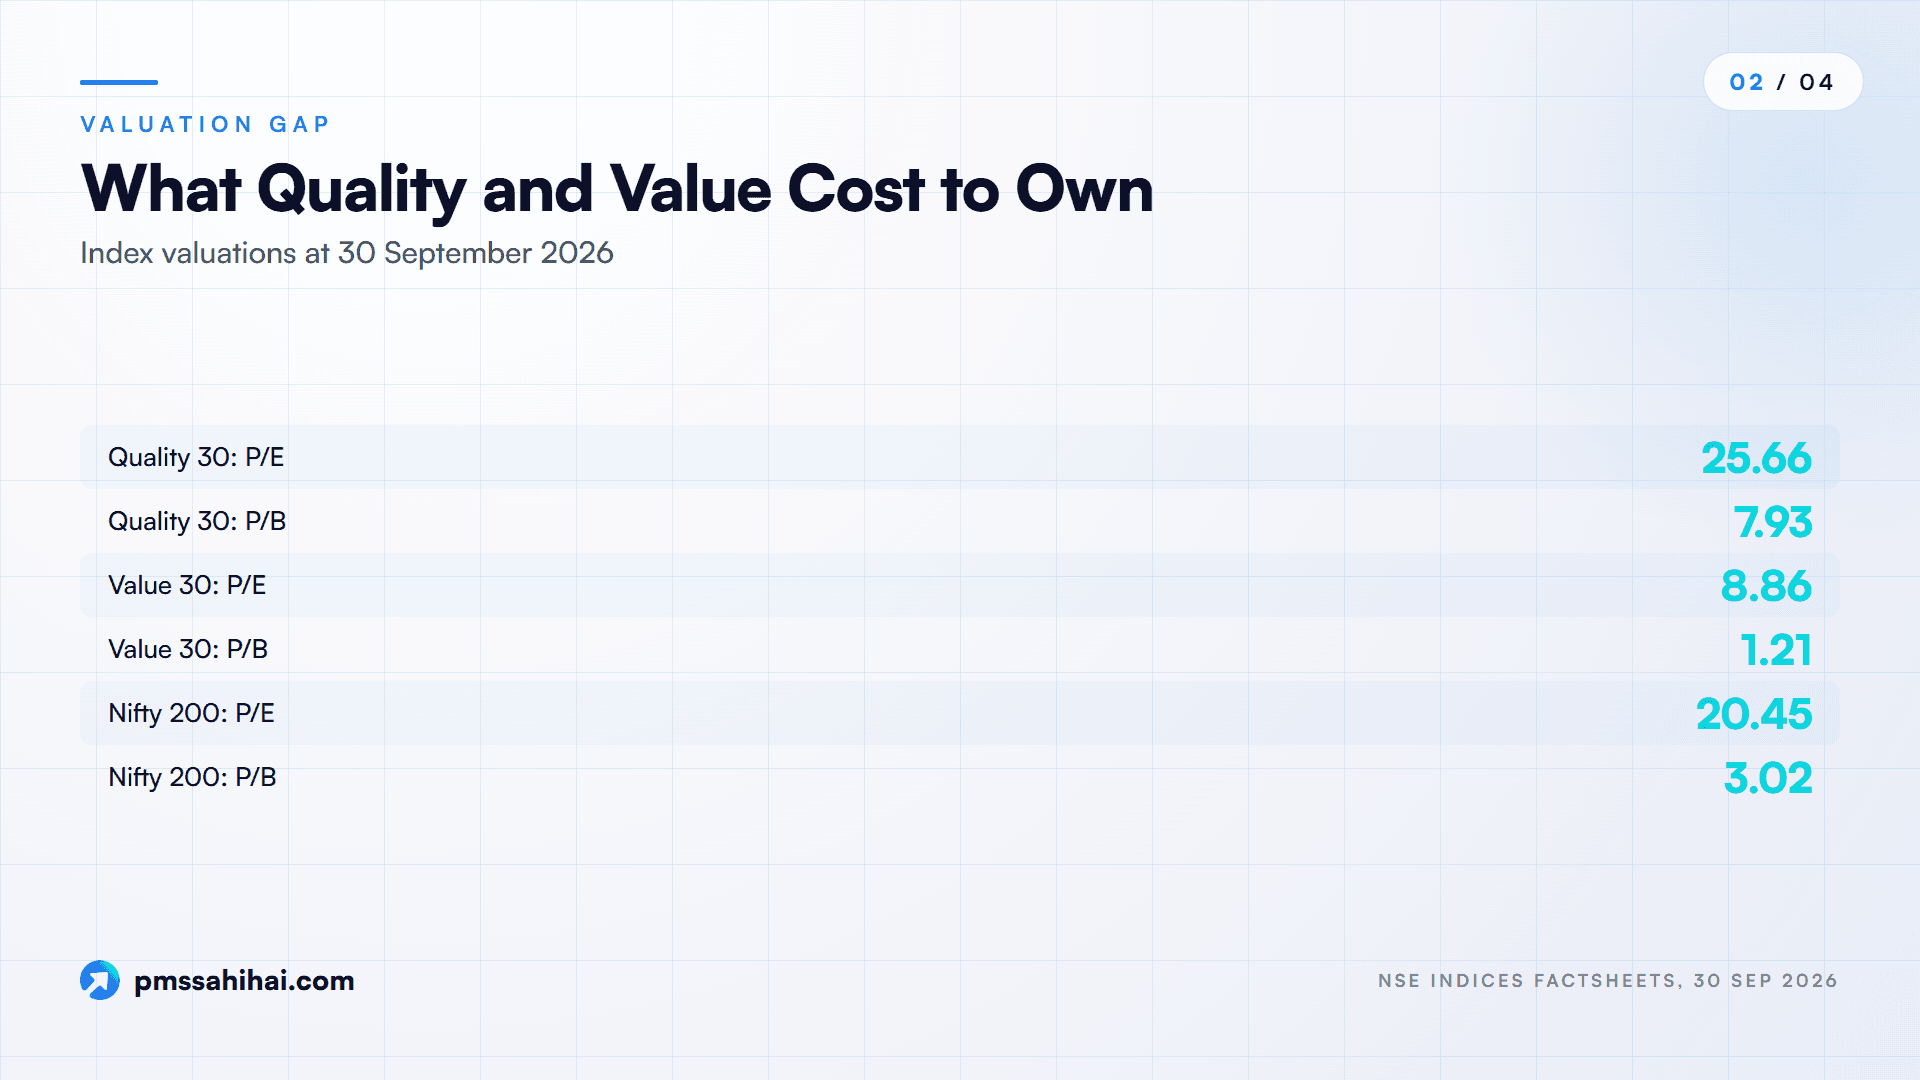
The catch is price. At 30 September 2026, the Nifty200 Quality 30 traded at a price-to-earnings ratio of 25.66 and a price-to-book ratio of 7.93, against 20.45 and 3.02 for the Nifty 200. Paying that much can leave future returns disappointing even when the businesses perform well.
The Value Factor: Buying Cheap Against Fundamentals
The value factor buys stocks that look cheap relative to what the business earns, owns, sells or pays out. The logic is that markets overreact to bad news and extrapolate weak periods too far, so unloved stocks are often priced below what they turn out to be worth.
The Nifty200 Value 30 scores each Nifty 200 stock on four ratios: earnings to price, book value to price, sales to price and dividend yield. It keeps the 30 best scorers, weights them by a mix of value score and free-float market capitalisation, and rebalances semi-annually. The result looks very different from the quality index. At 30 September 2026, the value index traded at a price-to-earnings ratio of 8.86 and a price-to-book ratio of 1.21, with Financial Services (32.44%) and Oil, Gas and Consumable Fuels (27.78%) as its two largest sectors.
The Indian evidence on value is mixed. On the IIM Ahmedabad data, the value factor (HML) returned 6.61% a year since 1994. In the Jacob, Pradeep and Varma study of 1995 to 2021, built differently, value returns were marginally negative. Yet over the five years to September 2026, the Nifty200 Value 30 led the main factor indices. Definition and timing change the answer.
Value also hides a trap: some stocks are cheap because their businesses are shrinking. A 2024 analysis of 17 Indian value mutual funds by Share.Market (PhonePe Wealth) Research found that returns over roughly a year lined up more closely with momentum scores than with value scores.
Low Volatility and Size: Two More Factors You Will Hear About
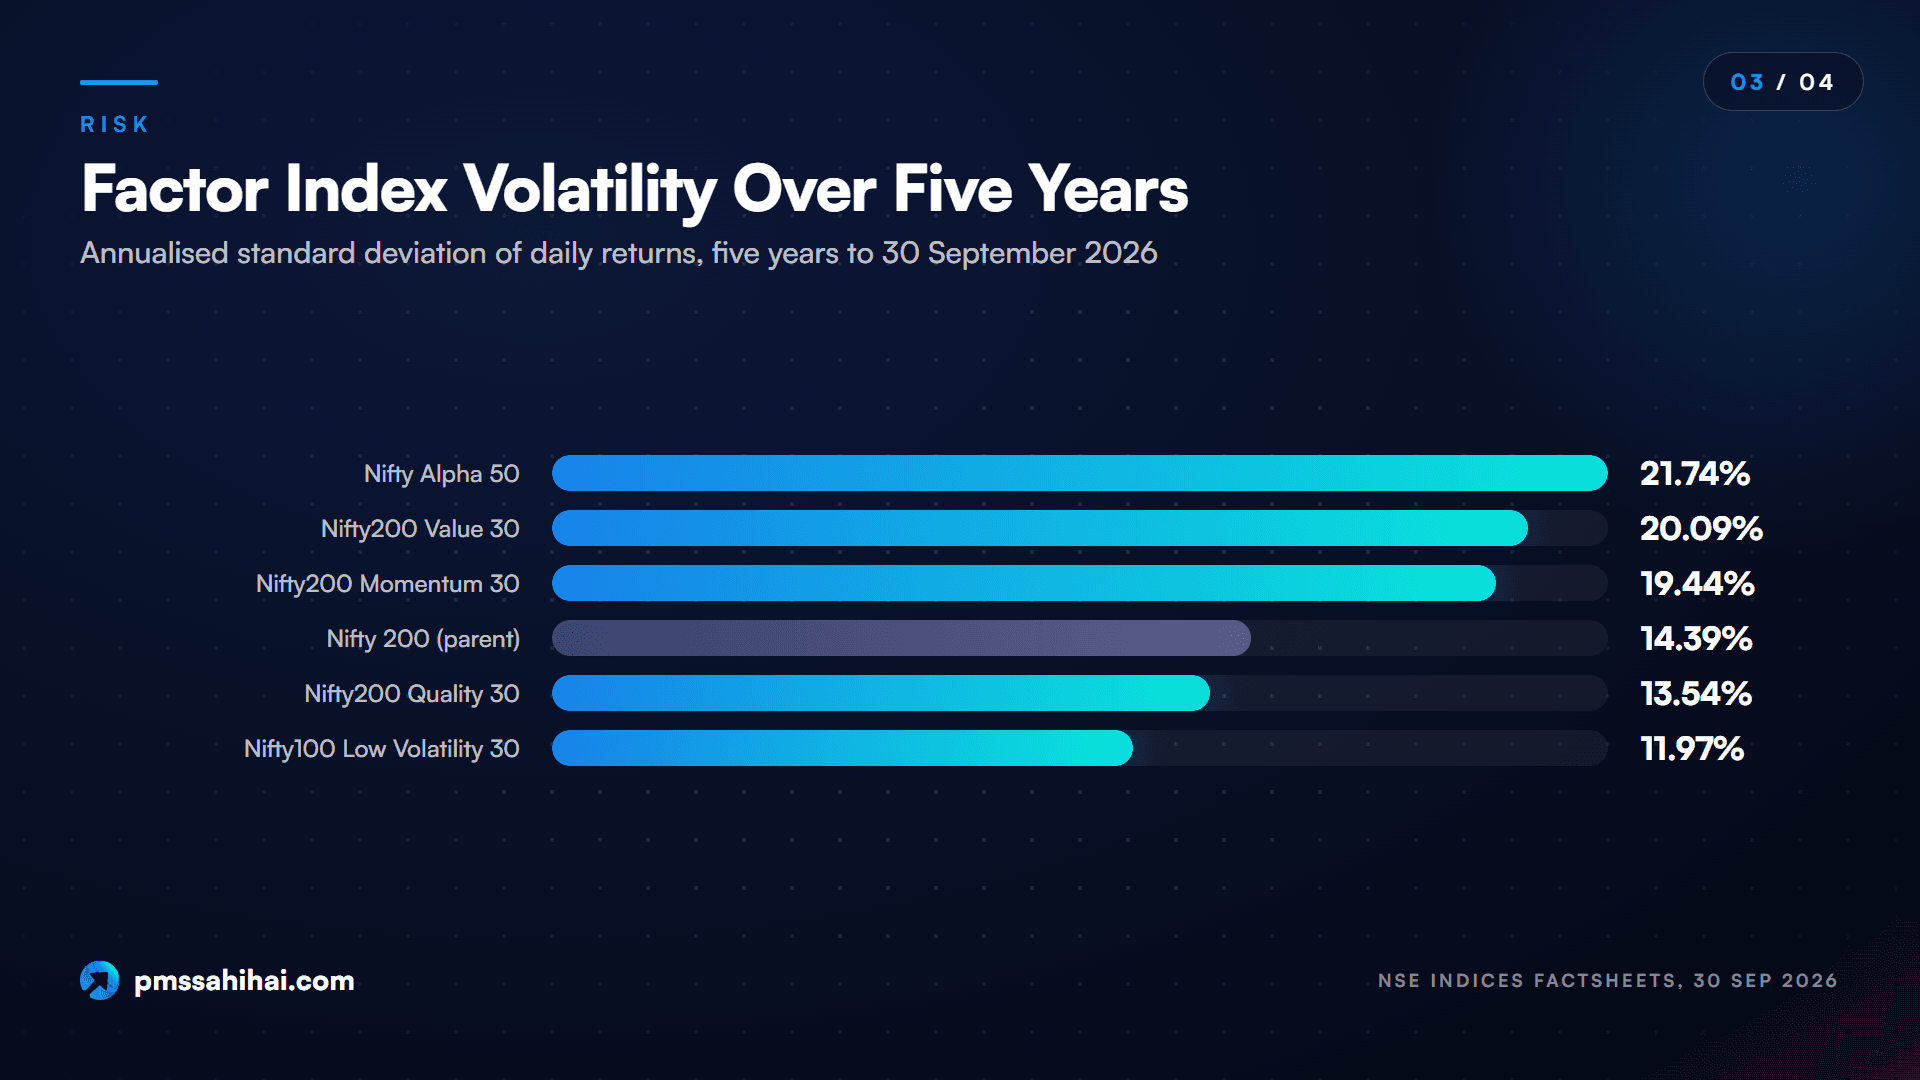
The low volatility factor favours stocks whose prices move less, an idea rooted in the low-volatility anomaly first seen in 1970s research. The Nifty100 Low Volatility 30 picks 30 stocks from the Nifty 100 that are available for derivatives trading, ranks them by the standard deviation of their daily price returns over the last year, weights the calmest stocks most and rebalances quarterly. Over the five years to 30 September 2026, its annualised standard deviation was 11.97% and its beta to the Nifty 50 was 0.79, both well below the Nifty 200 factsheet figures of 14.39% and 1.02. The low volatility factor tends to cushion falls and lag in strong rallies, which is exactly what investors in it should expect.
The size factor deserves the most caution in India. On the IIM Ahmedabad library, the small-minus-big (SMB) factor returned −3.71% a year from 1 January 1994 to December 2025, and −19.59% in 2025 alone. Small caps have had powerful runs, but over three decades the size factor, measured this way, has not paid. A PMS selling "small-cap outperformance" as a structural edge is selling something the long-run Indian data does not show.
How the Indian Factor Indices Compare on Return and Risk
The table below uses NSE Indices factsheets dated 30 September 2026. Returns are total returns including dividends; the five-year figure is a compound annual growth rate. Standard deviation is annualised from daily returns, and beta is measured against the Nifty 50.
| Index | Launched | 1-year return | 5-year return (CAGR) | 5-year std. deviation | 5-year beta | P/E |
|---|---|---|---|---|---|---|
| Nifty200 Momentum 30 | Aug 2020 | −0.47% | 9.28% | 19.44% | 1.18 | 23.21 |
| Nifty200 Quality 30 | Apr 2018 | −5.42% | 6.40% | 13.54% | 0.82 | 25.66 |
| Nifty200 Value 30 | Jun 2024 | 7.89% | 22.91% | 20.09% | 1.12 | 8.86 |
| Nifty100 Low Volatility 30 | Jul 2016 | −4.68% | 8.12% | 11.97% | 0.79 | 23.71 |
| Nifty Alpha 50 | Nov 2012 | 11.44% | 12.03% | 21.74% | 1.19 | n/a |
| Nifty 200 (parent) | — | −3.23% | 8.30% | 14.39% | 1.02 | 20.45 |
Three things stand out. The spread is enormous: value compounded at nearly 23% a year while quality managed 6.40%, below the plain Nifty 200. The risk profiles match the theory: momentum, value and Alpha 50 carried more volatility and beta than the parent; quality and low volatility less. And one window can mislead: these five years favoured cheap financials, energy and metals, while the 26 years in the Jacob, Pradeep and Varma study favoured quality.
Reading Back-Calculated Index History
Look closely at the launch dates. Every Nifty200 factor index above has a base date of 1 April 2005, but the momentum index launched in August 2020 and the value index in June 2024. Everything before launch is back-calculated: NSE applied today's rules to old data. That is standard practice, but it is a backtest, not live performance, and the rules were designed with the benefit of hindsight. The same applies to any factor PMS that shows a long "simulated" record. Treat only the post-launch years as evidence of how a rule behaves in real time.
Why Factors Take Turns: Cyclicality and Multi-Factor Portfolios
Factors are cyclical because each one is a bet on a particular kind of market. Momentum does best in long, trending rallies and worst at sharp turning points. Quality and low volatility tend to hold up in falling markets and lag in speculative ones. Value often leads in recoveries, when beaten-down sectors bounce, and can lag for years when investors chase growth.
The 2024–25 period shows the pattern. Momentum, loaded with the previous rally's winners, fell more than 30%; low volatility fell much less; cheap banks, energy and metals stocks carried value to the top of the five-year table. No rule changed. The market rotated from one set of traits to another.
That rotation is the main argument for combining factors. The Jacob, Pradeep and Varma study found quality did relatively better in weak markets, when momentum struggles. A multi-factor portfolio gives up owning only the best factor in exchange for a smoother ride. Two cautions apply: correlations between factors can rise in market stress, and blending factors can cancel tilts out, leaving you paying for something close to the index.
Timing factors is far harder than it sounds, because signals of a regime change usually arrive after much of the move. For most investors, the practical approach is a factor mix you can hold through a bad stretch, rebalanced, rather than last year's winner.
Factor Index Funds Versus Factor PMS: Costs, Tax and Control
You can get factor exposure in India in two broad ways. The first is a factor index fund or ETF that tracks an index such as the Nifty200 Momentum 30. According to INDmoney, several fund houses run such products, and factor funds typically charge expense ratios of about 0.20% to 0.50%, compared with roughly 0.05% to 0.30% for plain index funds. The second is a factor PMS, where a SEBI-registered portfolio manager runs a factor model in a separate account in your name, with a minimum investment of ₹50 lakh under SEBI's portfolio manager rules.
The differences go beyond the fee:
| Point | Factor index fund or ETF | Factor PMS |
|---|---|---|
| Minimum | Small amounts | ₹50 lakh |
| Rules | Published index methodology | Manager's own model, described in the disclosure document |
| Cost | Expense ratio only | Fixed fee, often a performance fee, plus GST at 18% and brokerage |
| Ownership | Units of a fund | Shares held directly in your demat account |
| Tax on rebalancing | Not taxed to you until you redeem units | Each sale is taxed in your hands |
| Customisation | None | Possible exclusions and tailoring |
Tax is the difference investors most often underestimate. In a PMS, every rebalance sale is your sale. Since Budget 2024's capital gains changes, short-term gains on listed equity are taxed at 20% and long-term gains at 12.5% above ₹1.25 lakh a year; under the Income-tax Act, 2025, in force from 1 April 2026, these sit in sections 196 and 198 (formerly 111A and 112A). A momentum model that replaces two-thirds of its holdings every six months generates mostly short-term gains. A mutual fund also trades at each rebalance, but unit holders are taxed only when they redeem. Consult a tax adviser before choosing a structure.
What SEBI Lets a PMS Say About Its FactorsSEBI does not have a "factor PMS" category. Under its circular of 16 December 2022 on performance benchmarking, each PMS investment approach is tagged to one of four Strategies (Equity, Debt, Hybrid or Multi Asset) and compared with a benchmark chosen from a short list set by the industry body APMI, so a momentum PMS will usually be benchmarked against a broad index rather than a momentum index. The same circular bars portfolio managers from citing model portfolio returns or the performance of cherry-picked investors in their communications. Ask for the actual time-weighted return of the investment approach since launch. A backtest is not a track record.
Advantages of Factor Investing for PMS Investors
Used well, factor investing gives a PMS investor real advantages:
- Transparency. Index methodologies list every input, and a factor PMS should explain its scoring in its disclosure document.
- Evidence behind the idea. Momentum and quality have long Indian records in academic data, not just in marketing.
- A diagnostic lens. Even a discretionary PMS can be described by its factor tilts, which helps you tell skill from style.
- Cheap benchmarks. If a factor PMS cannot beat the matching factor index fund after fees and tax, its fee is hard to justify.
- Diversification by behaviour. Factors that fail at different times can be combined.
- Discipline. Rules stop the urge to hold a falling favourite or sell in a panic.
How PMS Sahi Hai Helps You Read the Factor Exposure of a PMS
Knowing the factors is half the job. The other half is applying them to the strategies actually on offer, and that is where PMS Sahi Hai fits. To be clear about scope: we found no factor scores or factor labels for PMS strategies on the platform, and its strategy pages do not show holdings tables. What it gives you is a faster way to line up the evidence a factor check needs.
Start with the benchmark and the record. The PMS listing can be filtered by category label and benchmark, and each strategy page shows trailing returns from one month to five years and since inception beside the strategy's stated benchmark, with the difference shown as alpha. Put those yearly numbers next to the NSE momentum, quality and value indices. If a strategy's "alpha" vanished in late 2024 and early 2025 just as momentum fell, you have probably found its main factor.
Use Nyra to frame the questions. Nyra is PMS Sahi Hai's AI-powered research tool. Its published scoring methodology gives 30% of the Nyra Score to excess return over the stated benchmark across one, three and five years, and a strategy needs at least 12 months of record to be rated, so a young factor PMS may be unrated. You can ask Nyra what to ask a manager about turnover, rebalancing frequency and how the model behaved in its worst year. PMS Sahi Hai's pages describe Nyra as an analytical tool, not a SEBI-registered investment adviser, and the score is not a recommendation.
Go deeper on the mechanics. If a strategy calls itself quantitative, our guides on how quant PMS works and quant versus discretionary PMS cover the model side. For the cost of a high-turnover factor, read what portfolio turnover tells you and why PMS gains are taxed in your hands.
Limitations and Risks of Factor Investing
Factor investing also has real weaknesses, and a PMS wrapper can magnify some of them:
- Long droughts. A factor can lag for years. Quality returned 6.40% a year over the five years to September 2026, below the parent index, despite strong long-run evidence.
- Deep drawdowns. Momentum fell more than 30% in 2024–25 and in 2020.
- Data mining. Critics such as Rob Arnott and Campbell Harvey argue many published factors may be statistical accidents.
- Crowding. When a factor becomes popular, inflows push prices up and future returns can shrink.
- Costs and turnover. Momentum trades more, and inside a PMS that means short-term capital gains tax.
- Backtest bias. Histories before launch are simulations designed with hindsight.
- Concentration. A 30-stock factor portfolio can end up with large sector bets, such as the 26% capital goods weight in the momentum index at the June 2026 review.
How to Check Any PMS for Its Factor Exposure
You do not need a quant team to work out which factors a PMS leans on. Use these steps:
- Read the investment approach. "Relative strength" and "trend" point to momentum; "ROE", "low leverage" and "consistent compounders" to quality; "margin of safety" and "low P/E" to value.
- Compare the portfolio's ratios with the index. Ask for weighted P/E, P/B and ROE. A P/E far above the Nifty 200's suggests quality or growth; far below suggests value.
- Check turnover. High annual turnover is a mark of momentum. Low turnover fits quality and value.
- Line up returns against the factor indices. Compare the strategy's yearly returns with the Momentum 30, Quality 30 and Value 30 indices. If it rose and fell with one of them, that is its main factor.
- Look at the bad years. How the strategy behaved in late 2024 to early 2025, and in early 2020, tells you more than its best year.
- Ask about the record. Confirm how long the actual approach has been live and that any longer figures are not model or backtested returns.
- Count the after-tax cost. Add fees, GST and the likely tax on turnover, then compare with a factor index fund.

Making Factors Work in an Indian Portfolio
Factor investing is not a magic formula. It is a way of naming what drives a portfolio. Momentum, quality, value and low volatility each have research behind them and each has spent years out of favour; in the five years to September 2026, value compounded at more than three times quality's pace, while over the earlier 26-year study period quality led.
For a PMS investor, the lessons are simple. Know which factors your manager leans on. Hold factor exposure long enough to survive its bad cycle. Prefer a mix of factors that fail at different times. Judge any factor PMS against the matching factor index fund after fees and tax. And insist on live, time-weighted returns rather than backtests. Tools such as PMS Sahi Hai's listing and Nyra can speed up the shortlisting, but the disclosure document and the manager's answers have the final word.
Ready to Compare Factor-Driven PMS Strategies?
Factor investing gives you the questions to ask; the next step is to put real strategies side by side. Shortlist two or three PMS approaches, work out which factors each one leans on, and compare their live returns, drawdowns, turnover and total cost with the matching factor index funds. Use the PMS Sahi Hai comparison tool to set strategies against their benchmarks, put your open questions to Nyra, or book a 15-minute conversation with the team. Write down the answers before you commit ₹50 lakh, and choose the strategy whose bad years you can live with. This article is general information, not investment or tax advice.
PMS Sahi Hai is a distributor of Portfolio Management Services and Alternative Investment Funds, APMI-registered (Registration No. APRN08358). This article is for education only and is not investment advice, a recommendation, or an offer to buy or sell any security. Investments in securities markets are subject to market risks; read all scheme-related documents carefully. Past performance is not indicative of future results. Consult your advisor before investing.
Ishaan founded PMS Sahi Hai to make India's PMS, AIF and GIFT City markets legible to serious investors, comparing every SEBI-registered manager on the same comparative basis, with no shelf products and no commission bias.
Frequently asked
What is factor investing in simple words?
Factor investing means choosing stocks by measurable traits, called factors, that research has linked to better returns over long periods. The main factors are momentum (recent price strength), quality (strong, steady profitability and low debt), value (cheap against earnings or book value), low volatility and size. A factor portfolio ranks a universe of stocks on these traits using fixed rules and rebalances on a schedule, instead of relying on one-off stock stories.
Which factor has worked best in India?
It depends on the period. On IIM Ahmedabad data from 1994 to 2025, momentum earned about 10.65% a year as a long-short factor. A 1995–2021 study by Jacob, Pradeep and Varma found quality the strongest. Over the five years to September 2026, the Nifty200 Value 30 led with 22.91% a year. No single factor wins every cycle, which is why many investors combine factors.
Why did momentum funds fall so sharply in 2024–25?
Momentum portfolios hold the stocks that have risen most. When the market turned in late September 2024, those stocks fell hardest. Wright Research's data shows the Nifty200 Momentum 30 fell 31.79% from 27 September 2024 to 7 April 2025. Similar falls happened in 2020 and 2021–22. Sharp drawdowns at market turning points are a normal feature of the momentum factor, not a sign that it has stopped working.
Is factor investing the same as smart beta?
Not quite. Factor investing is the broader idea of targeting traits that explain returns. Smart beta usually refers to rule-based indices that weight stocks by something other than market value, and to the index funds and ETFs that track them. Factor indices such as the Nifty200 Quality 30 are one kind of smart beta index, but a PMS or an active fund can also follow a factor approach.
Does the size factor work in India?
The long-run Indian data says no. On the IIM Ahmedabad factor library, the small-minus-big (SMB) factor returned about −3.71% a year from January 1994 to December 2025. Small-cap stocks have had strong rallies, but they have not delivered a reliable size premium over three decades on this measure. Treat any claim that small caps structurally beat large caps with caution.
Is a factor PMS better than a factor index fund?
Not automatically. A factor index fund costs roughly 0.20% to 0.50% a year, follows published rules and does not pass rebalancing gains to you until you redeem. A factor PMS needs ₹50 lakh, charges higher fees plus 18% GST, and every rebalance sale is taxed in your hands. It makes sense only if its model adds return after all costs, or if you need customisation.
Can a PMS advertise backtested factor returns?
SEBI's circular of 16 December 2022 bars portfolio managers from citing model portfolio returns or the performance of cherry-picked investors in their communications. Performance must be reported for the actual investment approach against its benchmark. If a factor PMS pitch leans on long simulated records, ask for live time-weighted returns since the approach launched, and treat back-calculated figures as illustrations only.
Keep reading
All articles
What Is a Private Trust? How HNIs Use Trusts to Protect Wealth
What a private trust is under Indian law, revocable vs discretionary choices, 2025 Act tax rules, and how family trusts hold PMS and AIF portfolios.

What Is an HUF, and Can It Invest in PMS and AIFs?
Can an HUF invest in PMS or AIFs? SEBI eligibility, karta KYC documents, the accredited investor route and HUF tax under the 2025 Act.

What Is MF-Based PMS? SEBI’s PRIM Route From ₹25 Lakh Explained
MF-based PMS explained: what SEBI's PRIM rules say, the ₹25 lakh minimum, the 1% fee cap awaiting a circular, tax on switches and the April 2027 start.
Read it. Now pressure-test it.
Ask Nyra how this applies to your portfolio, or talk to our team, no pitch, no pressure.