
Information Ratio in PMS: Separating Manager Skill From Luck
What the information ratio in PMS tells you: the formula, a worked example, what counts as good, and how many years it takes to rule out luck.

The information ratio divides a portfolio's average return above its benchmark by the volatility of that gap, called tracking error. It rewards a manager who beats the benchmark steadily over one who beats it in bursts. Around 0.5 is the usual rule of thumb for good, yet a manager with no skill at all has about a one-in-five chance of crossing 0.5 over three years. To separate skill from luck, you need the ratio, the length of the record and a benchmark that fits. SEBI makes equity mutual funds publish the number daily, but PMS reporting rules do not, so PMS investors may have to calculate it themselves.
Why a PMS Return Number Cannot Prove Manager Skill
Picture two statements on your desk. Both PMS strategies beat the same index by 4 percentage points a year. One did it with small, regular gaps above the index. The other spent long stretches behind it and made everything back in two wild quarters. The headline number is identical, but you would not trust the two managers equally.
The ordinary return table cannot tell them apart. A return is one number, and one number cannot show how it was earned. Our own review of 429 strategies shows how little a single period settles: 309 of them, or 72.0%, beat their stated benchmark over the year to 30 June 2026, and the median strategy beat it by 4.50 percentage points. Those figures were not adjusted for risk, fees or taxes. Was that a good year for stock picking, a good year for the kinds of stocks PMS managers like to own, or a good year for benchmarks that were easy to beat? One year of returns cannot answer that.
The information ratio in PMS analysis is built for that question. It will not hand you a verdict, and this article will be blunt about why. But it gives you a number you can actually test, which a return figure is not. Here is what it measures, how to calculate it from a factsheet, what a good reading looks like, and how much history it takes before a good reading starts to mean anything.
What the Information Ratio Measures in a Portfolio
The information ratio answers one question: for every unit of risk the manager took by being different from the benchmark, how much extra return came back?
Active return is the gap between the portfolio and its benchmark. If a strategy returned 2.0% in a month and its benchmark returned 1.5%, the active return was 0.5 percentage points. It can be negative, and in many months it will be.
Tracking error is the standard deviation of those gaps. It does not measure how much the portfolio moves, only how much the gap moves. A portfolio that falls 20% when its benchmark falls 20% has a large loss and zero tracking error. A concentrated PMS with 20 stocks, by contrast, will usually have a much higher tracking error than a broad fund, because it looks nothing like the index.
Divide the first by the second and you get the ratio. Some analysts use a close cousin, the appraisal ratio, which puts Jensen's alpha on top and a regression-adjusted risk figure below. For most investors reading a factsheet, the simple form is the right one, and it is the form SEBI prescribes for mutual funds.
Notice what the ratio leaves out. It does not care about the risk-free rate, and it does not reward absolute return. A manager who lost 8% while the benchmark lost 12% has positive active return. If you want your money to grow, that matters, but it is a different question. This number asks only whether being different from the benchmark paid off, and how dependably.
How the Information Ratio Came Into Use
The idea grew out of a plain practical problem: how should an investor combine a passive index holding with the bets of an active manager? In 1973, Fischer Black and Jack Treynor published a model that does just that, splitting a portfolio between a market index fund and an active portfolio of stocks where the investor has a view. In that framework, what matters is how much return each active bet earns relative to the risk it adds.
The term itself comes later. William Sharpe's 1994 paper, "The Sharpe Ratio", generalised his earlier measure to the difference between a fund and a benchmark, describing it as a zero-investment strategy: long the fund, short the benchmark. He noted that authors associated with BARRA had used the term information ratio for such a general measure. He also spelled out the point this article leans on: the t-statistic equals the ratio times the square root of the number of returns.
In 1998, Thomas Goodwin's paper in the Financial Analysts Journal tried to clear up confusion over the calculation. It argued that the simplest form of the ratio is the most useful, explained its link to the t-statistic, compared four ways of annualising it and looked at how the ratio is distributed across investment styles.
India picked it up through fund factsheets. AMFI's recommendations of October 2007 set out a standard way to calculate it, using month-end data and, by default, 36 months of history for equity funds. Then, in January 2025, SEBI made it a mandatory disclosure for equity mutual funds.
Where Indian Rules Stand on the Information Ratio
This is the part most explainers miss, because almost all of them are written about mutual funds. The rules for the two products differ.
Mutual Funds Publish It Every Day
SEBI's circular of 17 January 2025 requires mutual funds to disclose the ratio on their websites alongside performance data, daily, for equity-oriented schemes only. The rules are specific. The ratio uses the scheme's Tier 1 benchmark, standard deviation is calculated on daily return values, and AMFI must host the data in a comparable, downloadable format. The prescribed format has columns for one, three, five and ten years, separately for regular and direct plans. The circular took effect within three months, and NISM dates the start to April 2025.
SEBI's own description is worth noting. It says the ratio is often used as a measure of a portfolio manager's level of skill and ability to generate excess returns, and that it attempts to identify consistency of performance. "Often used as" is careful wording, and the right wording.
PMS Reporting Has No Such Column
Portfolio managers work under a different set of rules. SEBI's circular of 16 December 2022, in force from 1 April 2023, requires a portfolio manager to show the time-weighted rate of return (TWRR) of an investment approach with the trailing return of its selected benchmark whenever it communicates performance. Each approach is tagged to one strategy (Equity, Debt, Hybrid or Multi Asset) and one benchmark from a list of up to three that APMI prescribes for that strategy. Investors also receive their own XIRR, with the minimum, maximum and median across investors in that approach. Reports go to SEBI and APMI monthly.
The Master Circular for Portfolio Managers of 16 July 2025 consolidates this. We searched its 207 pages: it does not mention the information ratio, tracking error or the Sharpe ratio. Its sample report card ranks an approach by TWRR quartile over one to ten years. So a PMS has to report its return, its benchmark and its peer position, but nothing in that circular requires a benchmark-relative risk measure. A manager may choose to show the ratio, but the figures and the method are then the manager's choice.
New SEBI (Portfolio Managers) Regulations, 2026 take effect on 1 April 2027, and until then the 2020 Regulations and the July 2025 Master Circular apply. Reporting details could change through later circulars, so check the current position on SEBI's site before relying on this.
The upshot for you is simple. A mutual fund's ratio is standardised and easy to find. A PMS's ratio, if shown at all, is not. Ask how it was calculated, or calculate it yourself. Never compare a PMS figure directly with a figure from AMFI's table: one is built on daily data under a prescribed method, and the other could be built on anything.
The Information Ratio Formula With a Worked PMS Example
The information ratio formula is short:
Information ratio = (Portfolio return − Benchmark return) ÷ Tracking error
That is the same structure SEBI prescribes, where tracking error is the standard deviation of the excess return. The work lies in getting the inputs right.
A Twelve-Month Calculation, Step by Step
Take a hypothetical equity PMS and its tagged benchmark over twelve months. These are illustrative numbers, not any real strategy.
| Month | PMS return (%) | Benchmark return (%) | Active return (points) |
|---|---|---|---|
| 1 | 3.2 | 2.5 | 0.7 |
| 2 | −1.4 | −1.8 | 0.4 |
| 3 | 4.1 | 3.0 | 1.1 |
| 4 | 2.6 | 1.9 | 0.7 |
| 5 | −2.3 | −1.1 | −1.2 |
| 6 | 1.9 | 2.2 | −0.3 |
| 7 | 5.0 | 3.6 | 1.4 |
| 8 | −0.8 | −1.5 | 0.7 |
| 9 | 2.4 | 1.6 | 0.8 |
| 10 | −3.1 | −2.0 | −1.1 |
| 11 | 3.7 | 2.4 | 1.3 |
| 12 | 1.5 | 1.8 | −0.3 |
Now work through it:
- Find the active return each month. Subtract benchmark from PMS, as in the last column.
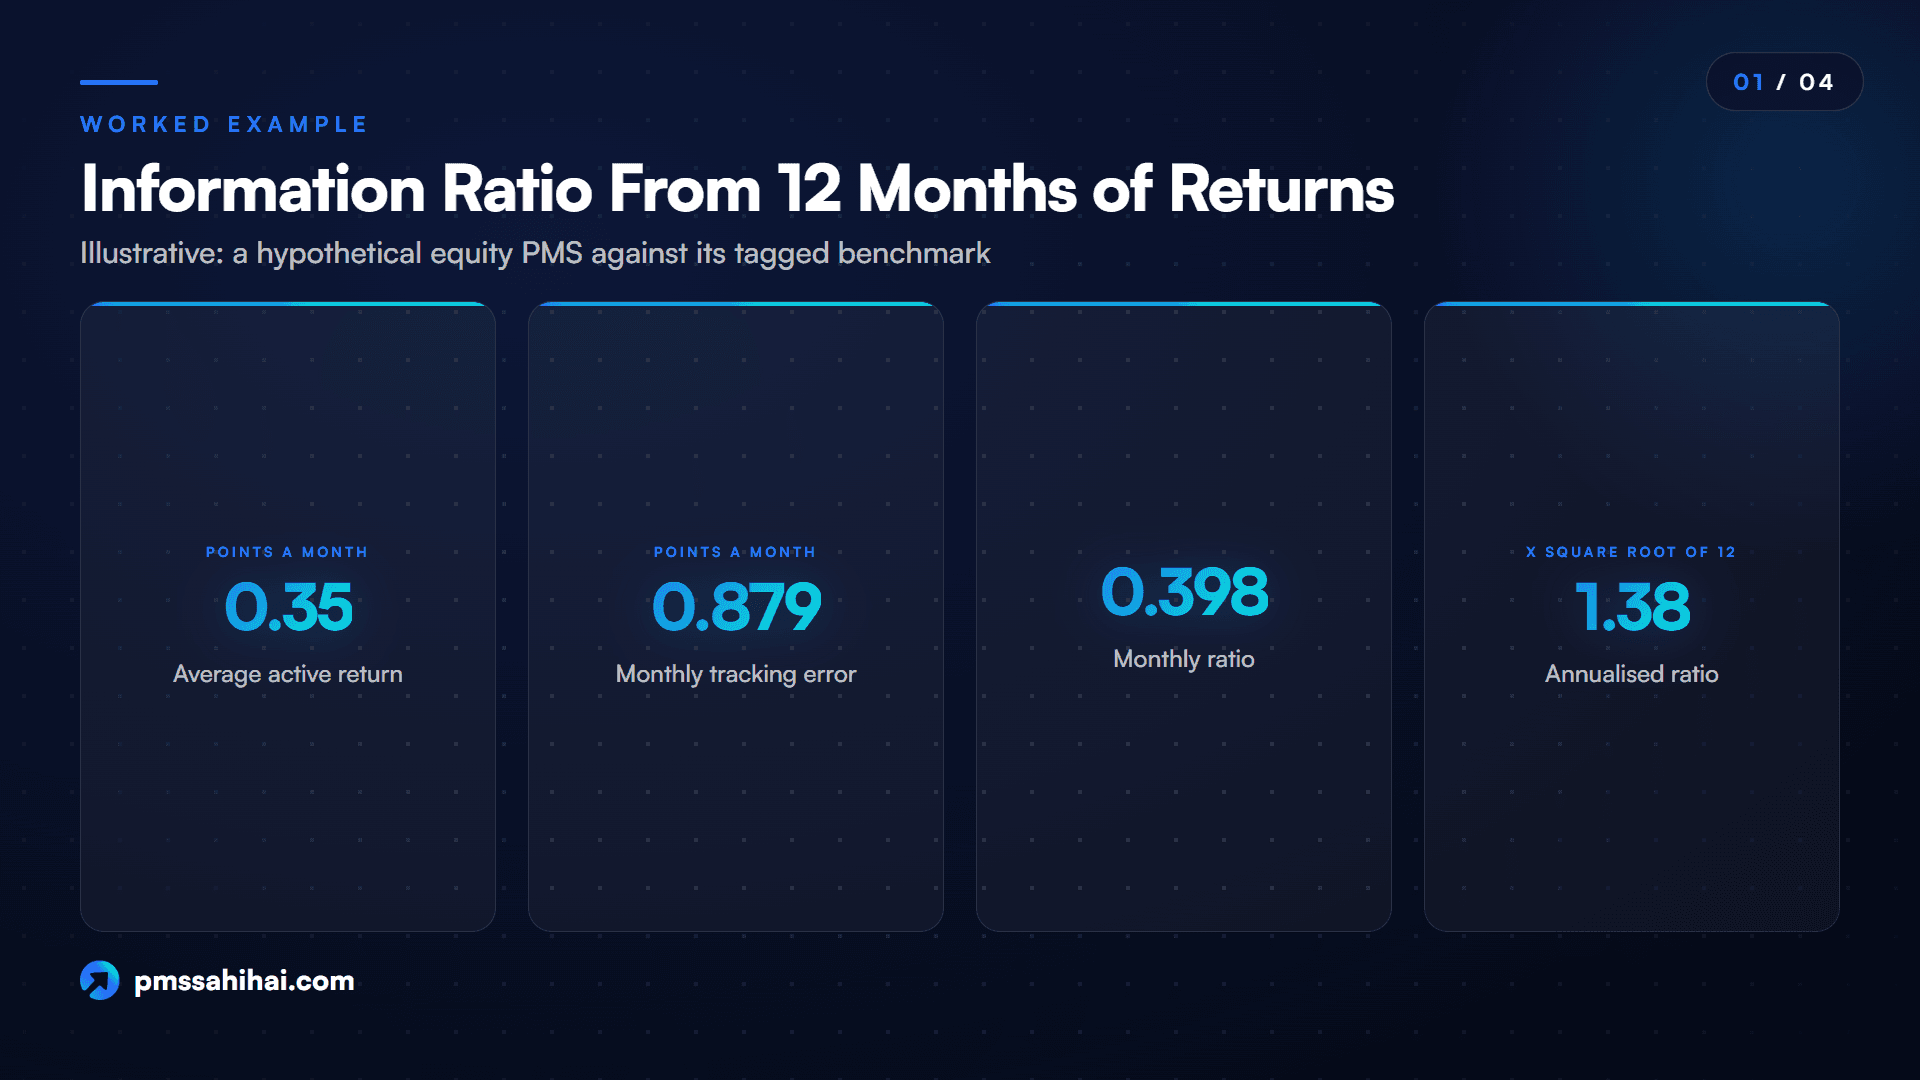
- Average it. The twelve gaps add up to 4.2, so the average is 0.35 points a month.
- Find the standard deviation of the gaps. Using the sample formula (STDEV in a spreadsheet), it comes to 0.879 points a month. That is monthly tracking error.
- Divide. 0.35 ÷ 0.879 = 0.398. That is the monthly ratio.
- Annualise. Multiply by the square root of 12, about 3.46, to get 1.38.
You can reach the same place by annualising the two parts first. Annual active return is 0.35 × 12 = 4.2 points. Annual tracking error is 0.879 × 3.46 = 3.04 points. And 4.2 ÷ 3.04 = 1.38.
By any rule of thumb, 1.38 looks exceptional. Hold that thought, because the luck section comes back to it.
Why Two Honest Calculations Can Differ
The same twelve months can produce different answers depending on small choices.
| Method | Tracking error basis | Active return (points) | Ratio |
|---|---|---|---|
| Sample standard deviation, simple average × 12 | 3.04 | 4.20 | 1.38 |
| Population standard deviation, simple average × 12 | 2.91 | 4.20 | 1.44 |
| Sample standard deviation, compounded return difference | 3.04 | 4.61 | 1.51 |
None of them is wrong. AMFI's 2007 note used the population form for tracking error; SEBI's circular specifies daily data for mutual funds, which will also give a different figure from monthly data. Goodwin's paper compared four annualisation methods for this reason. Before comparing two ratios, confirm they use the same frequency and method.
Higher Return, Lower Ratio
Now see what the ratio does to a comparison. Both hypothetical strategies below use a benchmark that returned 16%.
| Strategy | Return | Active return | Tracking error | Ratio |
|---|---|---|---|---|
| A | 22% | 6 points | 10 points | 0.60 |
| B | 19% | 3 points | 4 points | 0.75 |
A made more money. B earned more for each unit of active risk. This does not automatically make B the better choice: you can only spend returns, and a ratio cannot be withdrawn. It does tell you that A's result depended on larger bets, and larger bets are harder to tell apart from luck.
What Counts as a Good Information Ratio
There is no official answer. SEBI's circular sets no threshold, and the sources you will find do not agree with one another.
| Source | What it says |
|---|---|
| AMFI's 2007 recommendations | Zero for a manager adding no value; above 0.50 is "excellent" |
| Grinold and Kahn, as cited on Wikipedia | Top-quartile managers typically reach about 0.5 annualised |
| Axis Mutual Fund | About 0.5 is good; 1 or higher is ideal |
| Motilal Oswal | 0 to 0.5 moderate; 0.5 to 1.0 good; above 1.0 exceptional |
| ZFunds | Below 0.4 weak; 0.4 to 0.6 good; 0.61 to 1 very good |
A sensible way to read a good information ratio, drawing these together:
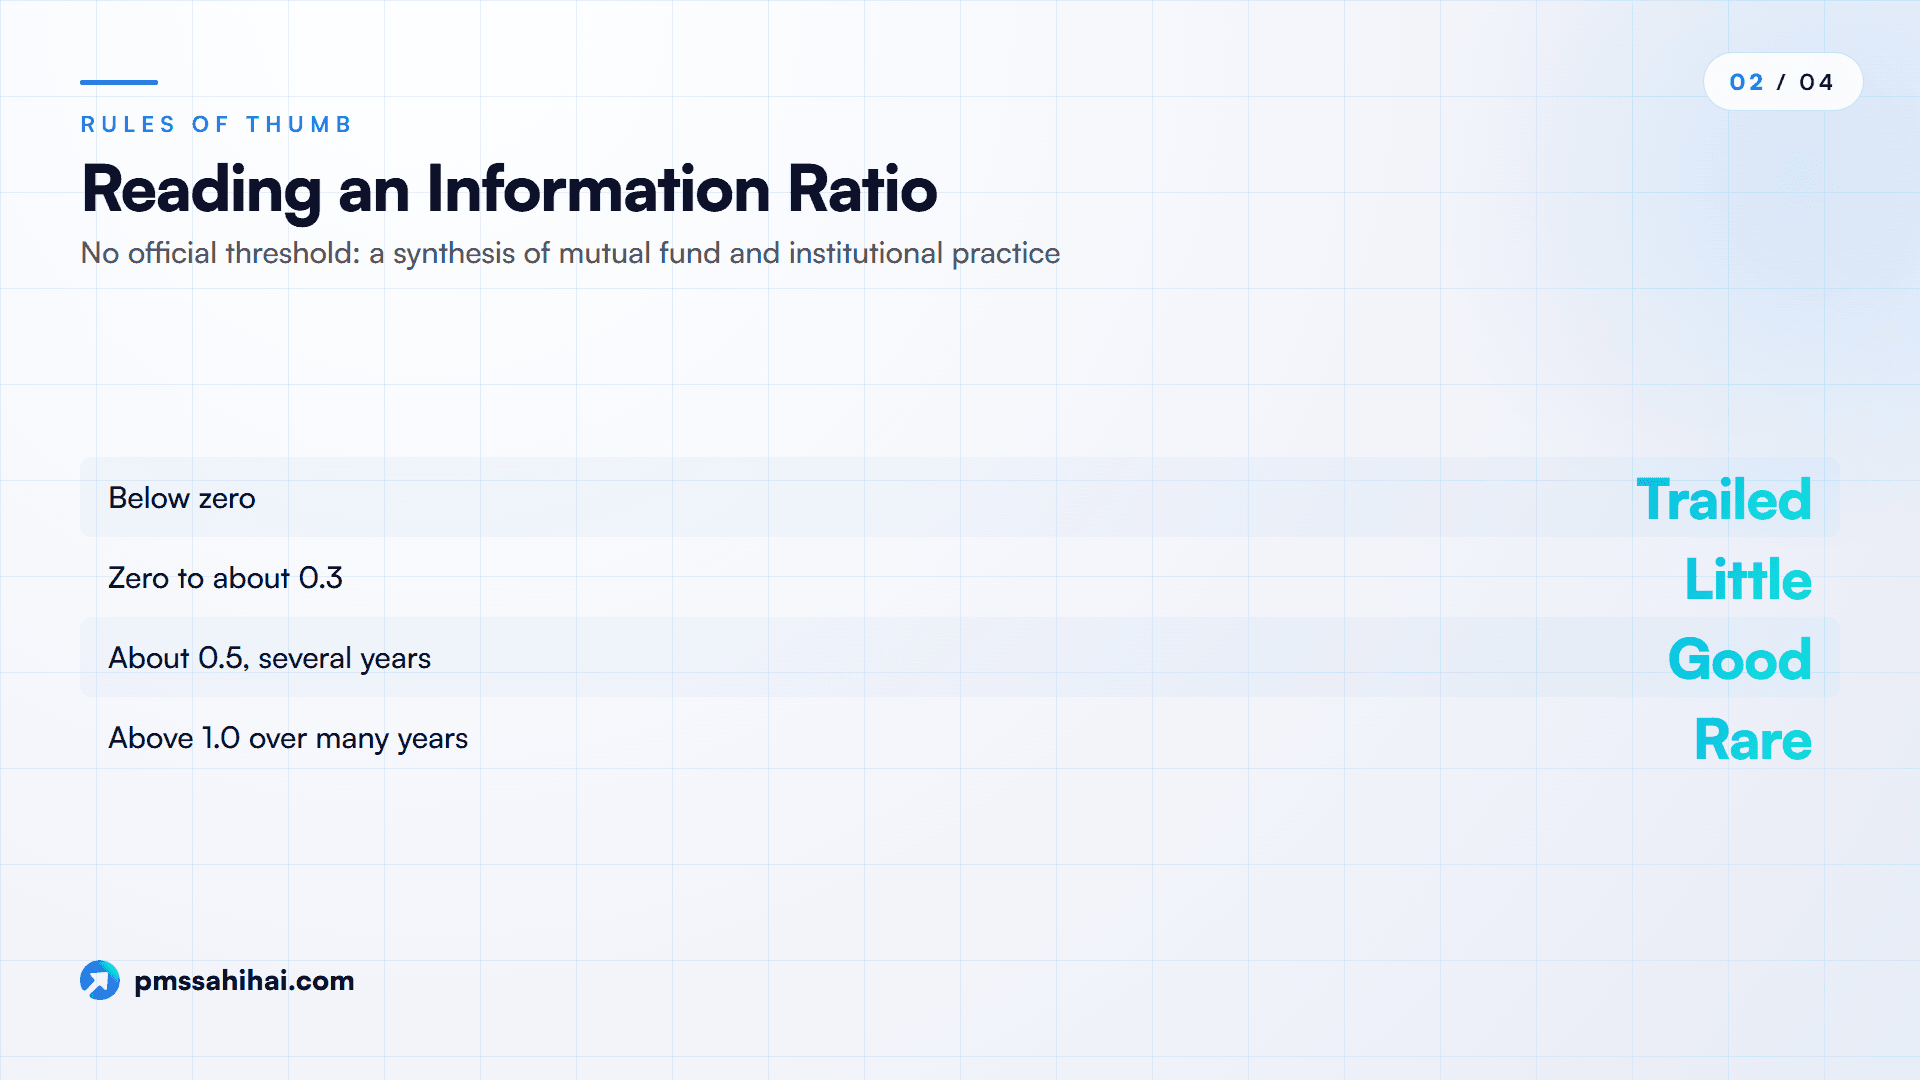
- Below zero: the strategy trailed its benchmark over the period.
- Zero to about 0.3: little sign of value added once the active risk is counted.
- About 0.5: the common marker for good, sustained over several years.
- Above 1.0 over many years: rare. Check the benchmark and the data before you believe it.
Three caveats apply. These thresholds come largely from mutual fund and institutional practice. We have not found a reliable published distribution of the ratio for Indian PMS strategies, so nobody can honestly say what top-quartile looks like in this industry. Next, the number only means something within a similar style: a large-cap and a small-cap strategy face different benchmarks and different opportunities. Last, the threshold says nothing about length of record, which is the bigger issue.
How Many Years It Takes to Rule Out Luck
Most articles say the ratio separates skill from luck and leave it there. It can help do that, but the arithmetic is sobering.
The Ratio Is Almost a t-Statistic
Sharpe's 1994 paper gives the link: the t-statistic of the average differential return equals the ratio times the square root of the number of observations. With an annualised ratio, that becomes a useful shortcut:
t-statistic ≈ annualised ratio × √(years of data)
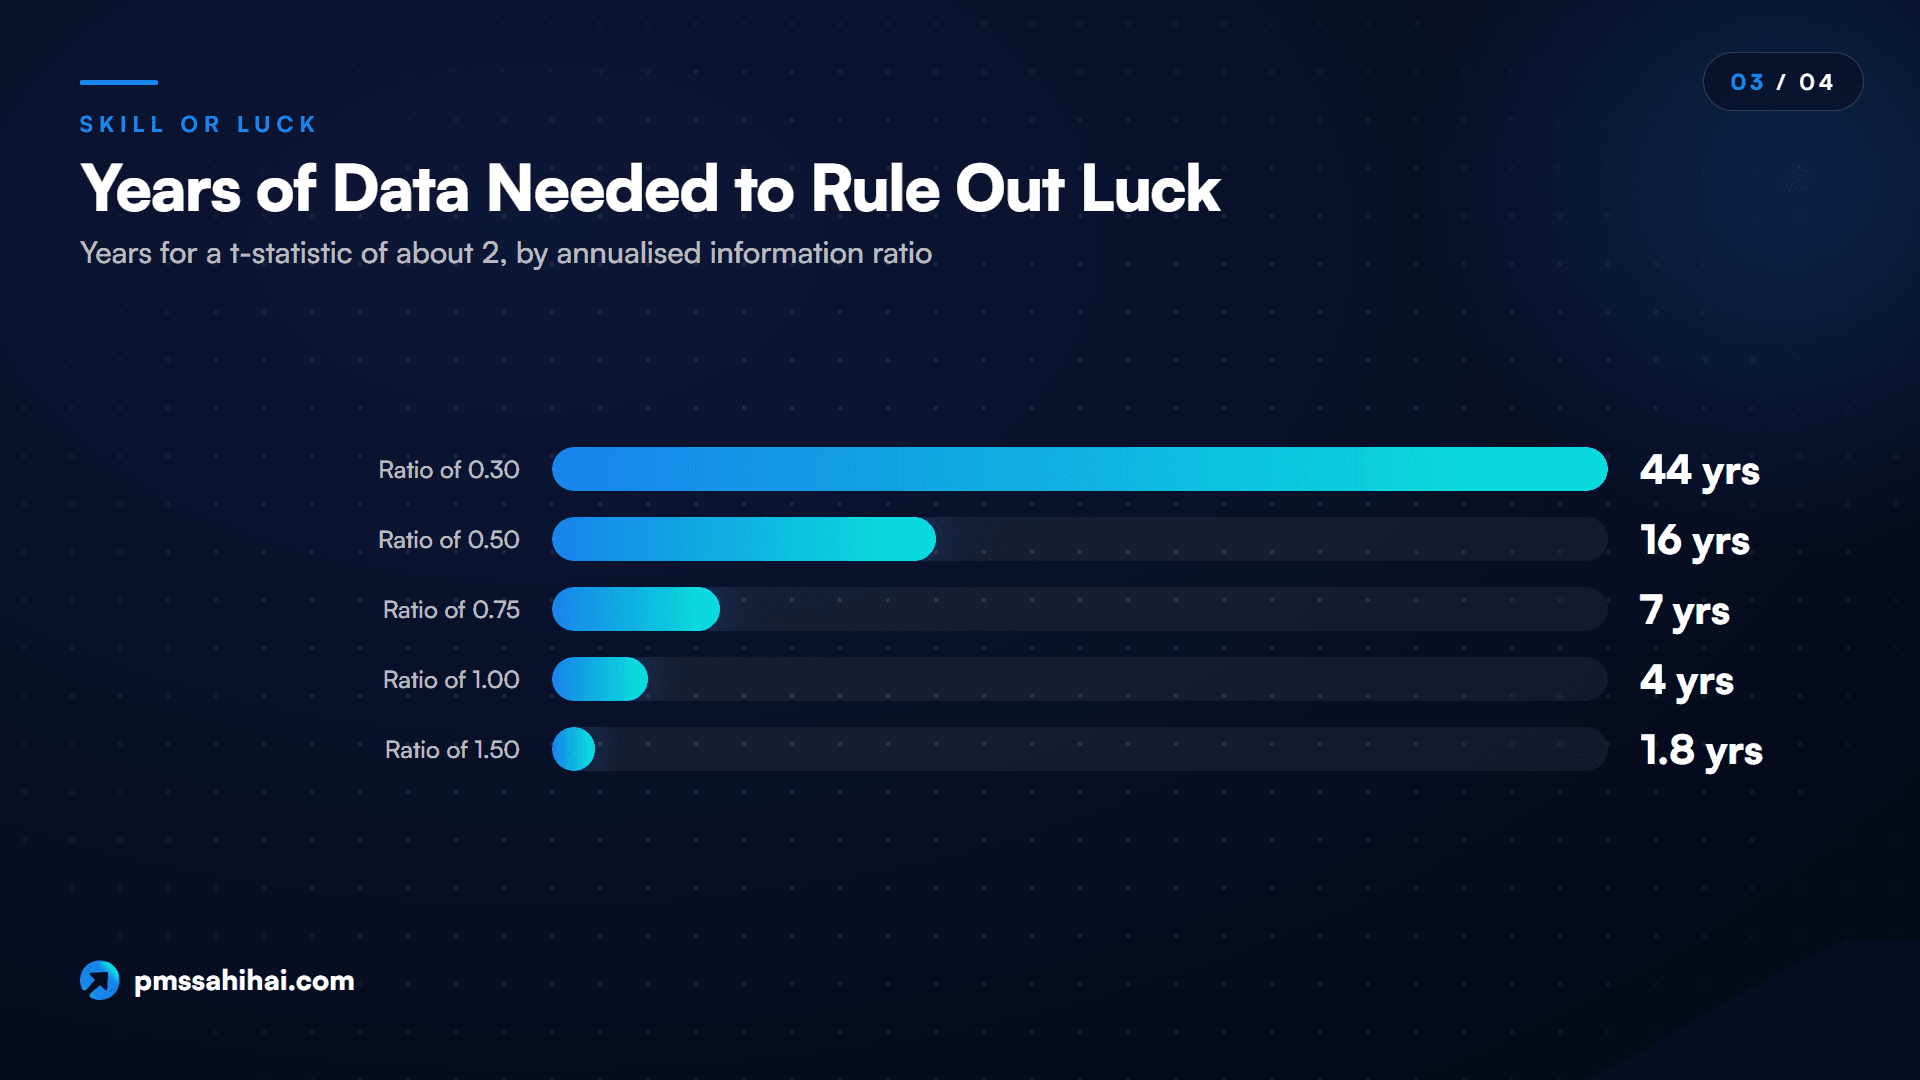
A t-statistic of about 2 is the conventional bar for saying a result is unlikely to be chance alone. Turn the formula around and you get the years needed to clear it.
| True annualised ratio | Years of data needed for t = 2 |
|---|---|
| 0.30 | 44 |
| 0.50 | 16 |
| 0.75 | 7 |
| 1.00 | 4 |
| 1.50 | 1.8 |
A manager with a genuinely good ratio of 0.5 needs 16 years of data to clear the conventional bar. Many PMS strategies do not have that history, and the manager and approach may have changed along the way. This shortcut assumes returns are independent from one period to the next, which is not exactly true of real portfolios, but the order of magnitude holds.
Now go back to our twelve-month example. A ratio of 1.38 over one year gives a t-statistic of just 1.38. It looks exceptional and is still well short of 2. One year of data cannot establish manager skill, however good the ratio looks.
How Often Luck Alone Looks Good
Turn the question around. Suppose a manager has no skill at all, with active returns that are pure noise averaging zero. How often would that manager still post a good number? We calculated it, assuming normally distributed, independent returns, and checked it by simulating 200,000 such managers on monthly data.
| Length of record | Chance of ratio above 0.5 | Chance of ratio above 1.0 |
|---|---|---|
| 1 year | 31% | 16% |
| 3 years | 19% | 4% |
| 5 years | 13% | 1.3% |
| 10 years | 6% | 0.1% |
The simulation matched within about a percentage point in every cell. So nearly one zero-skill manager in five shows a "good" ratio over three years, and three years is the window most people treat as a respectable record. Above 1.0 over ten years is another matter: that is very hard to do by accident.
A range tells the same story. A measured ratio of 0.8 over three years has a rough 95% range of −0.33 to 1.93, which includes zero, meaning no skill at all. The same 0.8 over ten years has a range of 0.18 to 1.42, which does not.
Many Strategies Make Lucky Winners Certain
There is a further trap for anyone screening a list. As a thought experiment, take the 429 strategies from our June 2026 review and imagine none had any skill. Roughly 132 of them would still show a ratio above 0.5 over a single year. Real strategies are not independent of each other, and some do have skill, so this is not an estimate of anything that happened. It simply shows why sorting a long list by a short-window ratio will always produce a top group, whether or not anyone there is skilled.
Why the Ratio Makes PMS Selection Easier
With its limits understood, the ratio earns its place, and it does several jobs that a return table cannot.
- It rewards consistency. Same active return, smaller tracking error, higher ratio. A 4-point gain with 4 points of tracking error scores 1.0; with 12 points it scores 0.33. You can see that without reading a single stock pick.
- It fits how a PMS is regulated. Each approach already has one tagged benchmark, so the reference point is defined for you, and that benchmark cannot be swapped without consequences.
- It puts concentrated and diversified managers on one scale. A 15-stock portfolio and a 40-stock portfolio can be compared per unit of active risk, as long as they share a style and benchmark.
- It can be tested. Few performance numbers link so directly to a statistical test. You can ask how long the record must be, and get an answer.
- It uses data you already receive. TWRR and benchmark returns are required reporting, so no special data subscription is needed, as long as you can get monthly figures.
- It sharpens your questions. A ratio that falls after a manager change, or holds only in one market phase, gives you something specific to ask about.
It also saves time. Instead of debating a stack of return tables in a meeting, you can reduce each candidate to three facts: the ratio, the number of years and the benchmark. Candidates with thin records or weak numbers drop away quickly, and you spend your time on the few that remain.
How PMS Sahi Hai Helps You Read the Information Ratio in Context
PMS Sahi Hai is a comparison platform for PMS and AIF strategies, and the honest starting point is this: nothing we have published describes an information ratio calculator or a dedicated column for this number. So here is what the platform does help with, and what you still need to do yourself.
Start with a shortlist worth calculating. The compare tool has filters for PMS, AIF and GIFT City funds and lets you shortlist up to four strategies side by side. That narrows the work: you only need monthly data for the few strategies that genuinely compete for your money, and they should share a style and benchmark, or the comparison means little.
Use Nyra as a second lens, not a substitute. Nyra is the platform's AI research analyst. Its published methodology scores strategies from 0 to 10 on five pillars: return performance, risk-adjusted return, downside protection, consistency, and structure and stewardship. Two of those pillars, risk-adjusted return and consistency, ask the same broad questions as this ratio. We are not saying the Nyra Score contains the information ratio or replaces it. It is a separate summary, and a strategy with under 12 months of track record is "Not Rated", which fits this article's warning about short records. The methodology page also says a score is "not a prediction" and "not a recommendation".
Go deeper on the inputs. Our guide on how to read a PMS factsheet shows where return data sits. Benchmark selection in PMS explains how the wrong index hides bad performance. And Alpha and Beta in PMS helps you separate market exposure from stock selection before you put much weight on the ratio.
Bring the question to a person. If a manager's ratio does not match your own calculation, you can talk to the team and work out what to ask next.
Where the Information Ratio Misleads PMS Investors
Every limitation below is specific and checkable, and most PMS investors will run into at least one.
The Benchmark Can Do the Heavy Lifting
Change the benchmark and the ratio changes, sometimes dramatically. Take a hypothetical PMS that returned 18%.
| Benchmark (hypothetical) | Benchmark return | Tracking error | Ratio |
|---|---|---|---|
| Large-cap index | 13% | 7 points | 0.71 |
| Broad market index | 15% | 5 points | 0.60 |
| Small-cap index | 19.5% | 6 points | −0.25 |
If this portfolio holds mostly small caps, the first two readings flatter it and only the third describes the manager's stock picking. SEBI's indicative equity list includes broad indices such as Nifty 500, BSE 500 and MSEI SX40. A small-cap approach measured against a broad index may simply be collecting the small-cap premium in a good market. SEBI's rule does limit one abuse: a track record from before a change in benchmark tagging cannot be used in performance reporting.
Market Exposure Can Look Like Skill
The ratio does not strip out beta. Consider a hypothetical manager with no stock-picking ability at all, running a portfolio with a beta of 1.3, 4 points of stock-specific noise, a 6.5% risk-free rate and a benchmark with 18% volatility.
| Market return | Expected PMS excess | Tracking error | Ratio |
|---|---|---|---|
| 15% | +2.55 points | 6.72 points | 0.38 |
| −5% | −3.45 points | 6.72 points | −0.51 |
In a rising market, that manager scores a respectable 0.38 for doing nothing more than holding riskier stocks. Check the ratio across both rising and falling periods.
Fees Decide Whether the Number Is Yours
Ask which return went into the numerator. A hypothetical gross active return of 5 points with 6 points of tracking error gives 0.83. Take off 2 points of costs and it falls to 0.50. SEBI requires reported performance to be net of all fees and all expenses, including taxes, so a ratio built on reported TWRR should already reflect this, but a ratio on a pitch deck may not.
The Record May Be a Survivor's
Poor performers tend to disappear. As the well-known pattern of survivorship bias shows, many losing funds are closed or merged, which leaves a list of survivors looking better than the original group. Any comparison of currently active strategies carries some of this.
Other Blind Spots
- Tracking error treats upside and downside alike. A manager who occasionally beats the benchmark by a wide margin gets penalised for it, while the ratio says little about the size of drawdowns.
- Your own result may differ. The ratio is based on the approach's TWRR. Your experience depends on when you invested, which is why SEBI requires individual XIRR alongside it.
- The past may not persist. A manager change, a growing asset base or a shift in style can break the link between the record and the future.
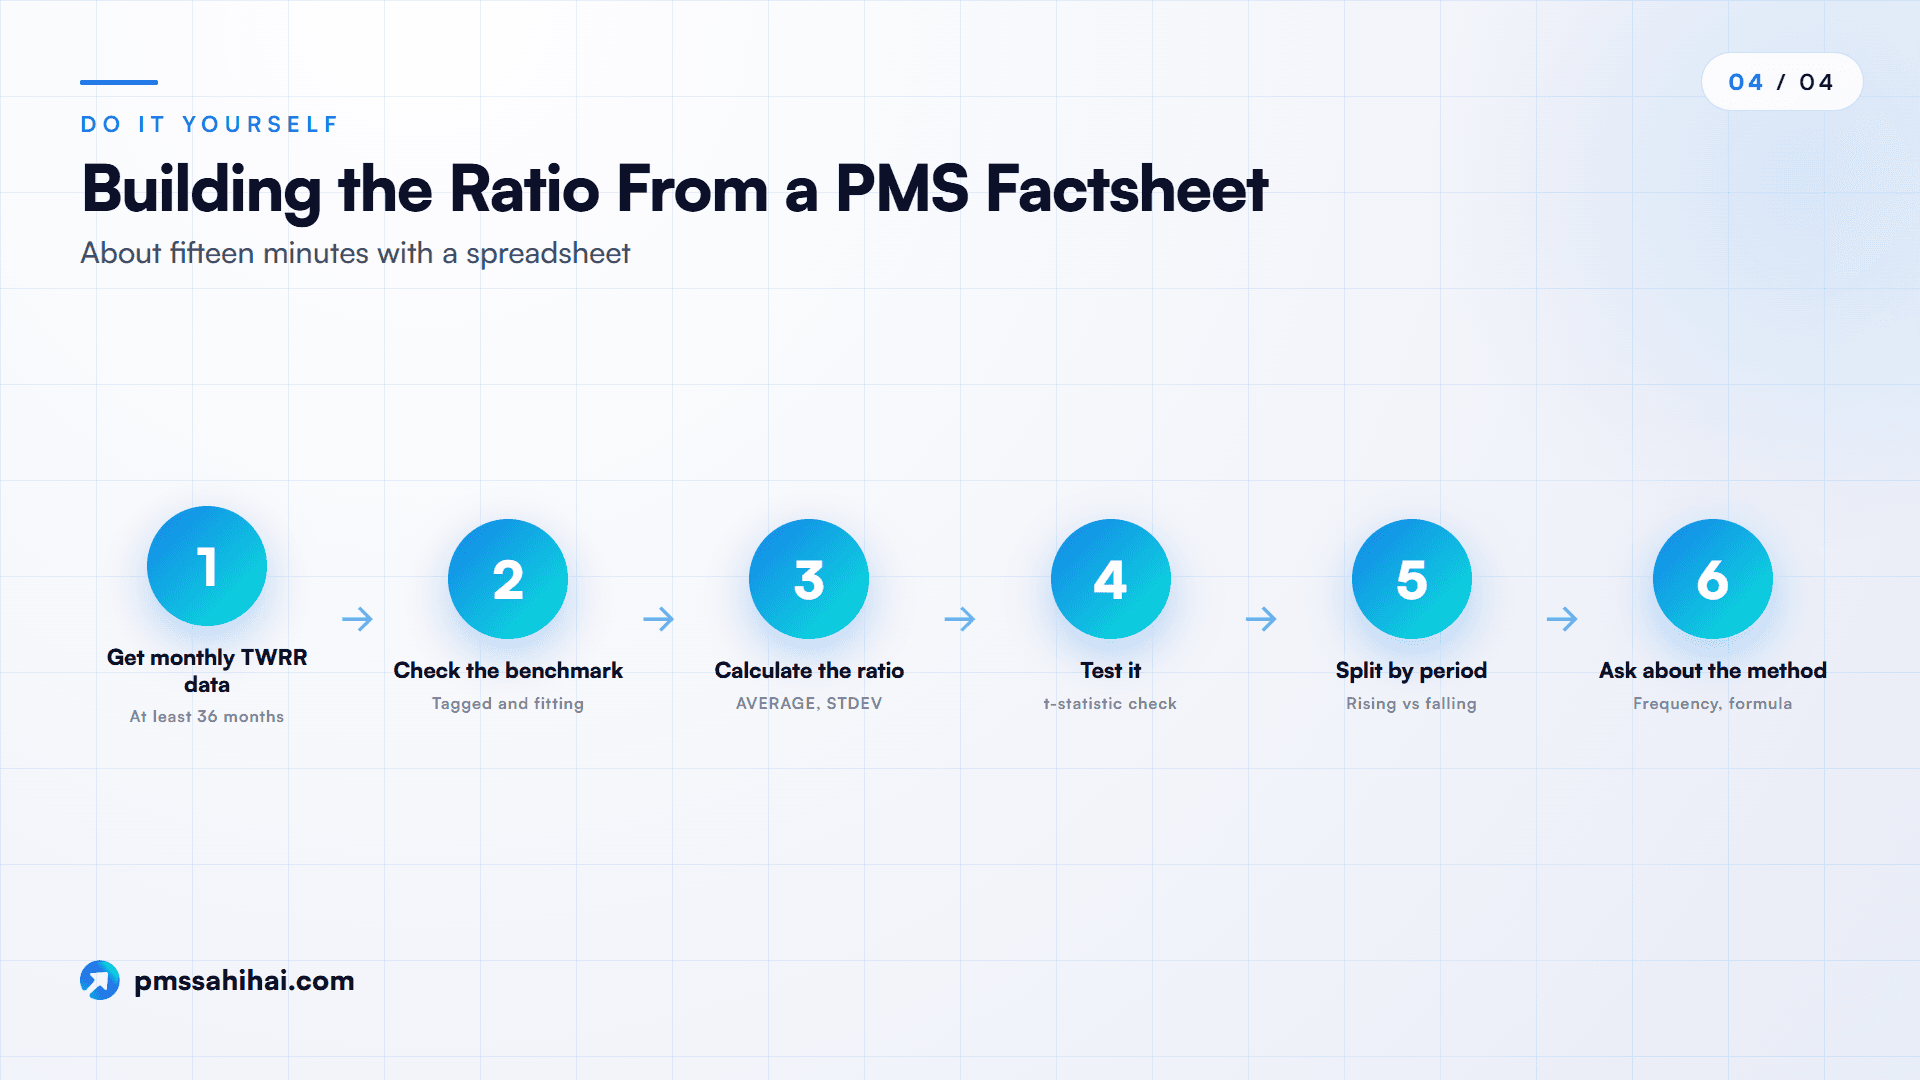
How to Build the Ratio From a PMS Factsheet
You can do this in about fifteen minutes with a spreadsheet.
- Get monthly data. Ask the manager or distributor for monthly TWRR of the approach and the tagged benchmark's monthly return. Use at least 36 months, the default AMFI suggested for equity funds, and more if available.
- Check the benchmark. Confirm it is the tagged benchmark, and ask whether it suits what the portfolio really holds. If not, repeat the calculation with a closer index.
- Calculate. Enter the monthly active returns. Use AVERAGE and STDEV on that column, divide, and multiply by the square root of 12.
- Test it. Multiply the ratio by the square root of years. Under 2 means the record does not yet separate skill from chance by the conventional test. That does not prove there is no skill.
- Split it. Calculate separately for rising and falling periods, and before and after any change of manager. A strong ratio that comes from only one stretch deserves less weight.
- Ask about the method. If the manager publishes a ratio that differs from yours, ask for the data frequency and formula. A difference in method is normal; refusal to explain it is informative.
What to Conclude About a Manager's Ratio
The information ratio does not measure skill directly. It measures how reliably a manager beat a benchmark, and it becomes evidence of skill only when the benchmark is right, the record is long, the result survives market phases and the manager's process explains it.
Treat any single reading in this order: negative or near zero over a long record is a real warning; a good reading over a short record is a reason to keep watching, not a conclusion; a good reading over ten years or more, on a fitting benchmark, under the same team, is about as strong as return data gets. Even then it is a statement about the past. On PMS Sahi Hai, a comparison and a Nyra Score can sit next to that reading, but neither replaces it. Combine it with what numbers cannot show, such as the investment process, the fees and whether the strategy suits your own risk profile and horizon. This article is general information, not investment advice, and the examples are hypothetical.
Compare PMS Strategies With Better Questions
Before you commit to any PMS, get three facts for every shortlisted strategy: the information ratio, how many years of data it rests on and the benchmark it was measured against. If any of them is missing, ask for it. If the manager cannot explain the method, that tells you something too.
On PMS Sahi Hai you can compare PMS strategies side by side, ask Nyra to explain a term or a score in plain English, or talk to the team before you decide. This article is general information, not investment advice; past performance does not guarantee future returns.
PMS Sahi Hai is a distributor of Portfolio Management Services and Alternative Investment Funds, APMI-registered (Registration No. APRN08358). This article is for education only and is not investment advice, a recommendation, or an offer to buy or sell any security. Investments in securities markets are subject to market risks; read all scheme-related documents carefully. Past performance is not indicative of future results. Consult your advisor before investing.
Ishaan founded PMS Sahi Hai to make India's PMS, AIF and GIFT City markets legible to serious investors, comparing every SEBI-registered manager on the same comparative basis, with no shelf products and no commission bias.
Frequently asked
What is the information ratio in a PMS?
It is a measure of how much return a PMS strategy earned above its benchmark for each unit of risk taken by differing from that benchmark. You calculate it by dividing average active return by tracking error, the standard deviation of those gaps. A higher value means the strategy beat its benchmark more reliably, though the reading needs a fitting benchmark and a long record.
What is a good information ratio for a PMS?
There is no official threshold. About 0.5 is the common rule of thumb, based on AMFI's 2007 note and on institutional research placing top-quartile managers near that level. Sustained readings above 1.0 are rare. We found no reliable published distribution for Indian PMS strategies, so treat these as general guides and always check how many years of data sit behind the figure.
Can the information ratio be negative?
Yes. A negative value means the strategy returned less than its benchmark over the period measured. It does not always mean poor management, since one bad year can produce it, and a benchmark that does not fit the portfolio can too. A persistently negative reading over many years, on a suitable benchmark, is a stronger warning that active risk has not been rewarded.
Does a high information ratio prove manager skill?
No. It is evidence, not proof. A manager with no skill has roughly a 19% chance of showing a ratio above 0.5 over three years, assuming independent, normally distributed returns. Multiply the ratio by the square root of the years of data to get an approximate t-statistic. Readings near 2 or higher are harder to attribute to chance alone, though the benchmark must also fit.
How many years of data do you need to judge the information ratio?
Far more than most people expect. At a true ratio of 0.5, about 16 years of data are needed to reach a t-statistic of 2; at 1.0, about four years. Treat three years as the practical minimum for any reading at all, and treat anything under five years as provisional. Check that the same manager and approach were in place throughout.
Do PMS providers have to disclose the information ratio?
SEBI's January 2025 mandate covers equity-oriented mutual fund schemes. The July 2025 Master Circular for Portfolio Managers does not mention the ratio; it requires TWRR, benchmark return and relative performance. A portfolio manager may show the ratio voluntarily, but method and data frequency are not standardised. Check the current SEBI position, since new portfolio manager regulations take effect on 1 April 2027.
Is the information ratio the same as the Sharpe ratio?
No. The Sharpe ratio measures return above the risk-free rate against total volatility, while the information ratio measures return above a benchmark against tracking error. In his 1994 paper, Sharpe treated the benchmark version as a form of his own measure, and our Sharpe ratio guide covers it in full. For judging a manager against a mandate, the benchmark-relative form is usually more relevant. Neither is enough alone, and both depend on the period chosen.
Keep reading
All articles
Upside Capture Ratio: How Much of a Bull Market Did Your Fund Catch?
What upside capture ratio means, how to calculate it from monthly returns, why one fund can show 119 or 149, and how to read it in a bull market.

Power of Attorney in PMS: What You Authorise and What You Don’t
What a power of attorney in PMS lets your portfolio manager do, what SEBI rules still bar, how to revoke it, and what changes on 1 April 2027.
What Are Point-to-Point Returns? Meaning, Formula and Uses
Point-to-point returns explained: formula, CAGR and Rs 10,000 forms, SEBI's disclosure rule, and real Nifty figures showing how end dates change results.
Read it. Now pressure-test it.
Ask Nyra how this applies to your portfolio, or talk to our team, no pitch, no pressure.