
What Are Point-to-Point Returns? Meaning, Formula and Uses
Point-to-point returns explained: formula, CAGR and Rs 10,000 forms, SEBI's disclosure rule, and real Nifty figures showing how end dates change results.

Point-to-point returns measure how much an investment's value changed between one start date and one end date. The result can be stated as a total percentage, an annual rate or a rupee value, and mixing these up is the most common error. SEBI requires mutual fund performance ads to show the figure on a standard Rs 10,000 investment alongside CAGR. The number is simple and useful for a known holding period, but it depends heavily on the dates chosen: the Nifty 50's five-year price return ranged from -2.30% to 13.93% a year across the three end dates tested here. Read it as a fact about two dates, not as a verdict on a fund.
Why a Single Return Figure Needs Two Dates
"This fund returned 18%." The sentence looks complete, yet it leaves out the two things you need to judge it: when the measurement began and when it ended. Eighteen per cent over one year and 18% over five years are very different results. So are 18% measured from a market low and 18% measured from a market high.
Point-to-point returns are the plain arithmetic behind most performance numbers you see on factsheets, apps and advertisements. Take a value on one date, take a value on a later date, and compare them. Nothing in that sum looks at what happened in between.
That simplicity is why the measure is everywhere, and also why it needs care. This guide covers what the figure means, how to work it out by hand and in a spreadsheet, the rule that puts it in Indian mutual fund advertising, what it does well, and how far the answer moves when only the dates change. The worked examples use invented NAVs unless stated, and the Nifty 50 table uses actual closing values.
This is an explainer on one measure. Rolling returns get a short mention because they are the natural next step, but they deserve their own treatment.
What Point-to-Point Returns Actually Measure
A point-to-point return is the percentage change in an investment's value between two chosen dates. For a mutual fund, the values are usually the NAV on each date. For an index, they are the closing levels. For your own holding, they may be the value on the day you bought and the value today.
Three features define it:
- Two inputs only. A start value and an end value, each tied to a date.
- No path. A fund that rose steadily and a fund that crashed and recovered can show the same result if they share the same two values.
- No cash-flow awareness. The sum assumes one lump amount that stays invested throughout, with no additions or withdrawals.
Why definitions online seem to conflict
Read a few explainers and you will find disagreement. Some say a point-to-point return is an absolute figure and is not annualised. Others describe it as the annualised return from one date to another. Others treat it as identical to trailing returns.
The disagreement mostly comes down to labels. "Point-to-point" describes how the dates are chosen, namely one start and one end. It does not settle how the answer is expressed. The same two NAVs can be reported as a total percentage, as an annual rate, or as a rupee value. Whenever you see the term, check which form you are looking at, because the same pair of dates can produce 45% or 13.19%, as the next section shows.
How to Calculate Point-to-Point Returns Step by Step
The formula for the total change is short:
Point-to-point return (%) = (End value - Start value) / Start value x 100
Here is a worked example. Suppose a fund's growth-plan NAV was Rs 120 at the start of a three-year period and Rs 174 at the end.
- Subtract the start value from the end value: 174 - 120 = 54.
- Divide by the start value: 54 / 120 = 0.45.
- Multiply by 100: 45%.
The point-to-point return for those two dates is 45%.
Three ways to state one result
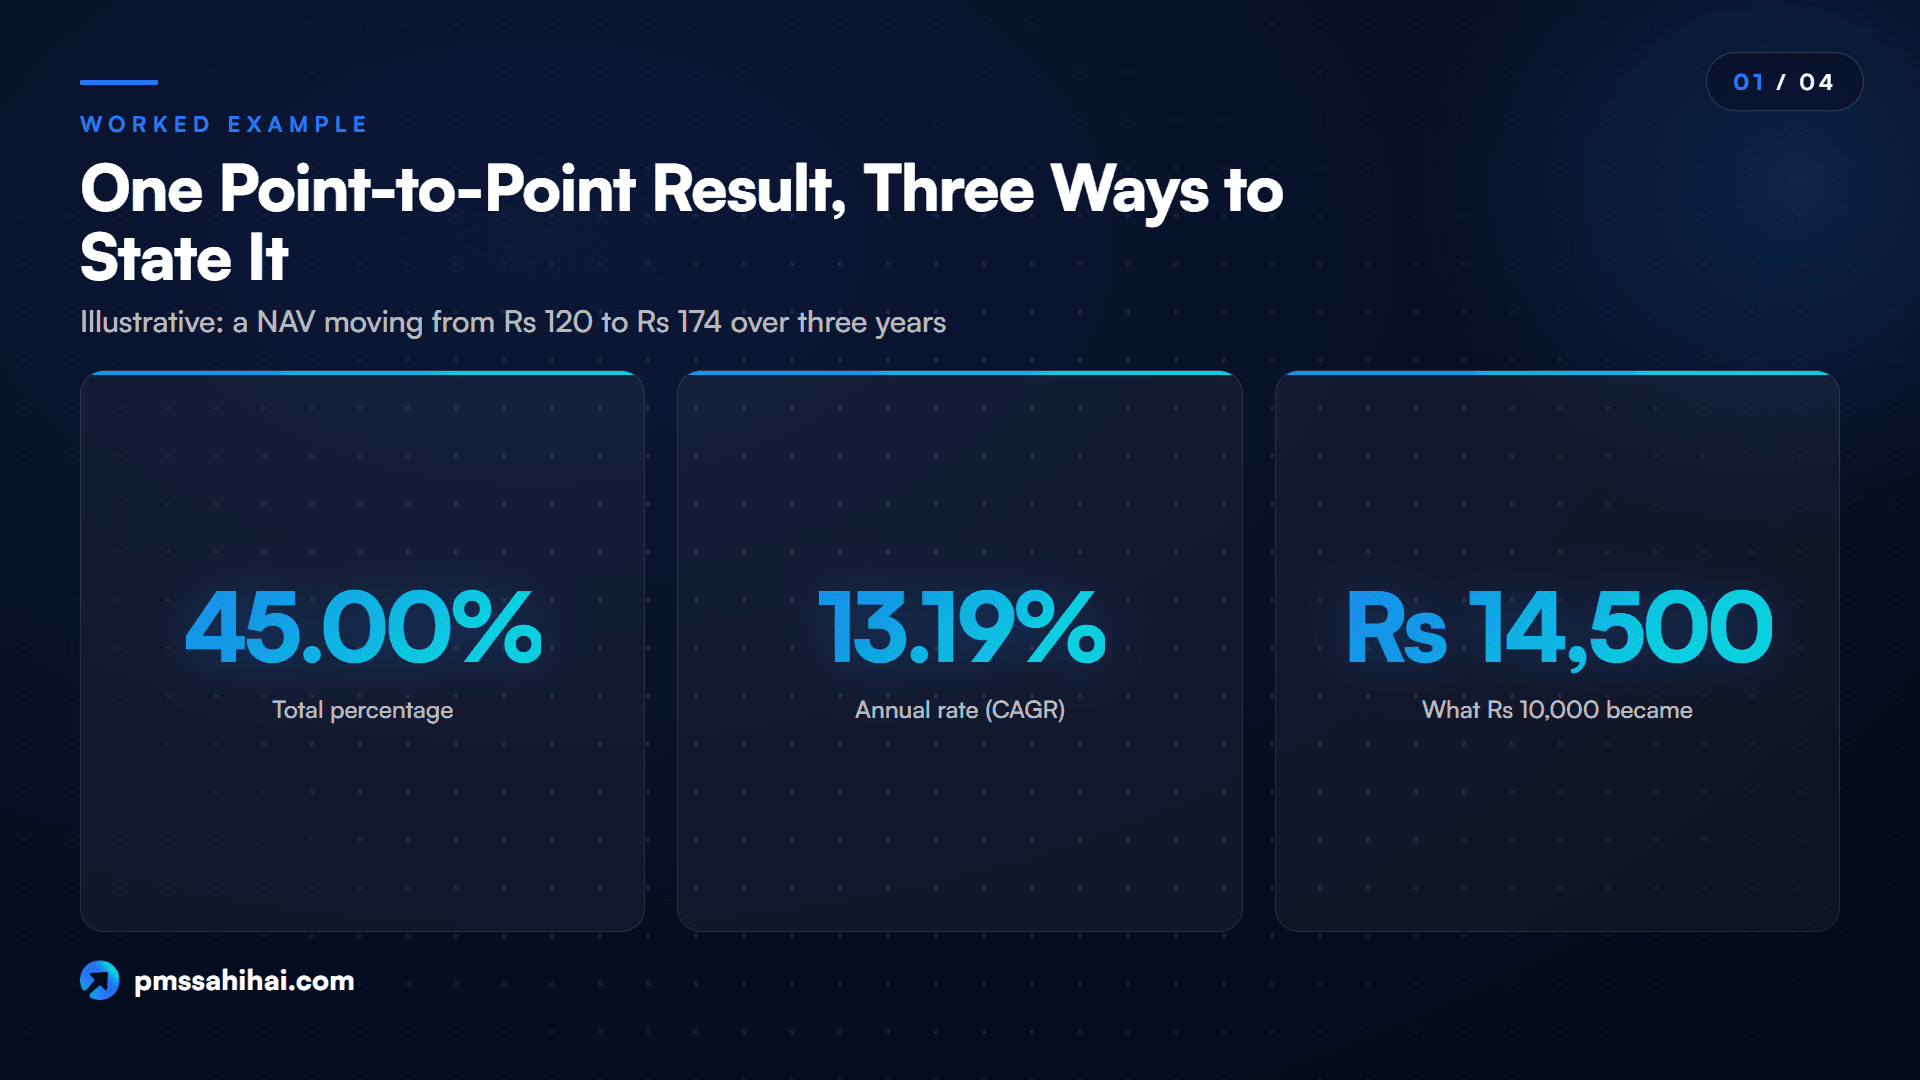
That one 45% can be presented in three ways, each correct and each answering a different question.
| Form | Calculation | Result | Question it answers |
|---|---|---|---|
| Total percentage | (174 - 120) / 120 | 45.00% | How much did value grow overall? |
| Annual rate (CAGR) | (174 / 120)^(1/3) - 1 | 13.19% a year | What steady yearly rate gives the same result? |
| Rupee value | 10,000 x 174 / 120 | Rs 14,500 | What would Rs 10,000 have become? |
A quick warning on the annual rate: do not simply divide. A 60% total gain over three years is not 20% a year. Compounding means the true annual rate is 16.96%. Dividing the total by the number of years overstates the yearly rate, and the gap widens over longer periods.
Working with exact dates in a spreadsheet
Real holding periods rarely last an exact number of years, so use days. Put the start date in A1, the start value in B1, the end date in A2 and the end value in B2. Then use:
- Total return: =(B2/B1)-1
- Annual rate: =(B2/B1)^(365/(A2-A1))-1
Say a NAV moved from Rs 160 on 1 April 2023 to Rs 200 on 15 September 2025. That is 898 days. The total return is 25.00% and the annual rate is 9.49%. SEBI's own worked example of a composite benchmark return also counts one year as 365 days, and the same approach reproduces its 12.20% result.
Losses, payouts and periods under a year
Losses. The formula works the same way. A NAV falling from Rs 100 to Rs 80 over two years gives -20.00% in total and -10.56% a year. Recovering from there takes a 25% gain, not 20%, because the base is now smaller.
Payouts. Growth-plan NAVs already carry reinvested income, so two NAVs tell the story. Income distribution (IDCW) plans differ because NAV falls by the amount paid out. Suppose a NAV moves from Rs 100 to Rs 110 and Rs 5 was paid during the period. On NAV alone the return is 10%. Counting the payout, it is 15%. Holding period return, the textbook cousin of this measure, includes both price change and income for exactly this reason. Adding the payout directly is a simplification, since it ignores what you could have earned by reinvesting it.
Periods under a year. Be wary of annualising these. An 8% gain over three months compounds to 36.05% on paper, but nobody has earned that, and the next nine months may look nothing like the first three. The Global Investment Performance Standards, a voluntary global code for firms, are blunt: returns for periods of less than one year must not be annualised. Indian mutual fund advertising takes a more specific line, covered below, so treat any annualised short-term figure with care and check how it was built.
How It Differs From CAGR, Absolute and Trailing Returns
These four terms overlap, which is why they get confused. CAGR and absolute return are ways to express a result, while point-to-point and trailing returns describe how the dates are picked.
| Term | What it describes | Annualised? | Dates |
|---|---|---|---|
| Point-to-point return | Change between two chosen dates | Either, so check | Any start and end |
| Absolute return | Total percentage change | No | Any start and end |
| CAGR | Steady yearly rate linking two values | Yes | Any start and end, usually over a year or more |
| Trailing returns | Point-to-point return ending at a recent date | Usually above one year | End date is recent, such as last month-end |
So a three-year trailing return is a point-to-point return with the end date fixed near today. An absolute return is one form of the answer, and CAGR is another. The site has fuller guides on CAGR and on absolute return in a PMS, so this piece only draws the boundary.
Rolling returns are a different thing. They repeat the same calculation across many overlapping windows, showing how often and how far results were strong or weak. A separate point-to-point calculation is one window. A rolling analysis is hundreds of them.
Time-weighted and money-weighted returns add a further layer. TWRR removes the effect of client cash flows, and XIRR reflects them. The site's TWRR guide and XIRR guide go deeper. Both measures are still taken between two dates, so neither escapes the question of which dates were used.
How Indian Disclosure Rules Adopted Date-to-Date Returns
The arithmetic is old, but the term has a specific regulatory history in India.
| Date | Rule | What changed |
|---|---|---|
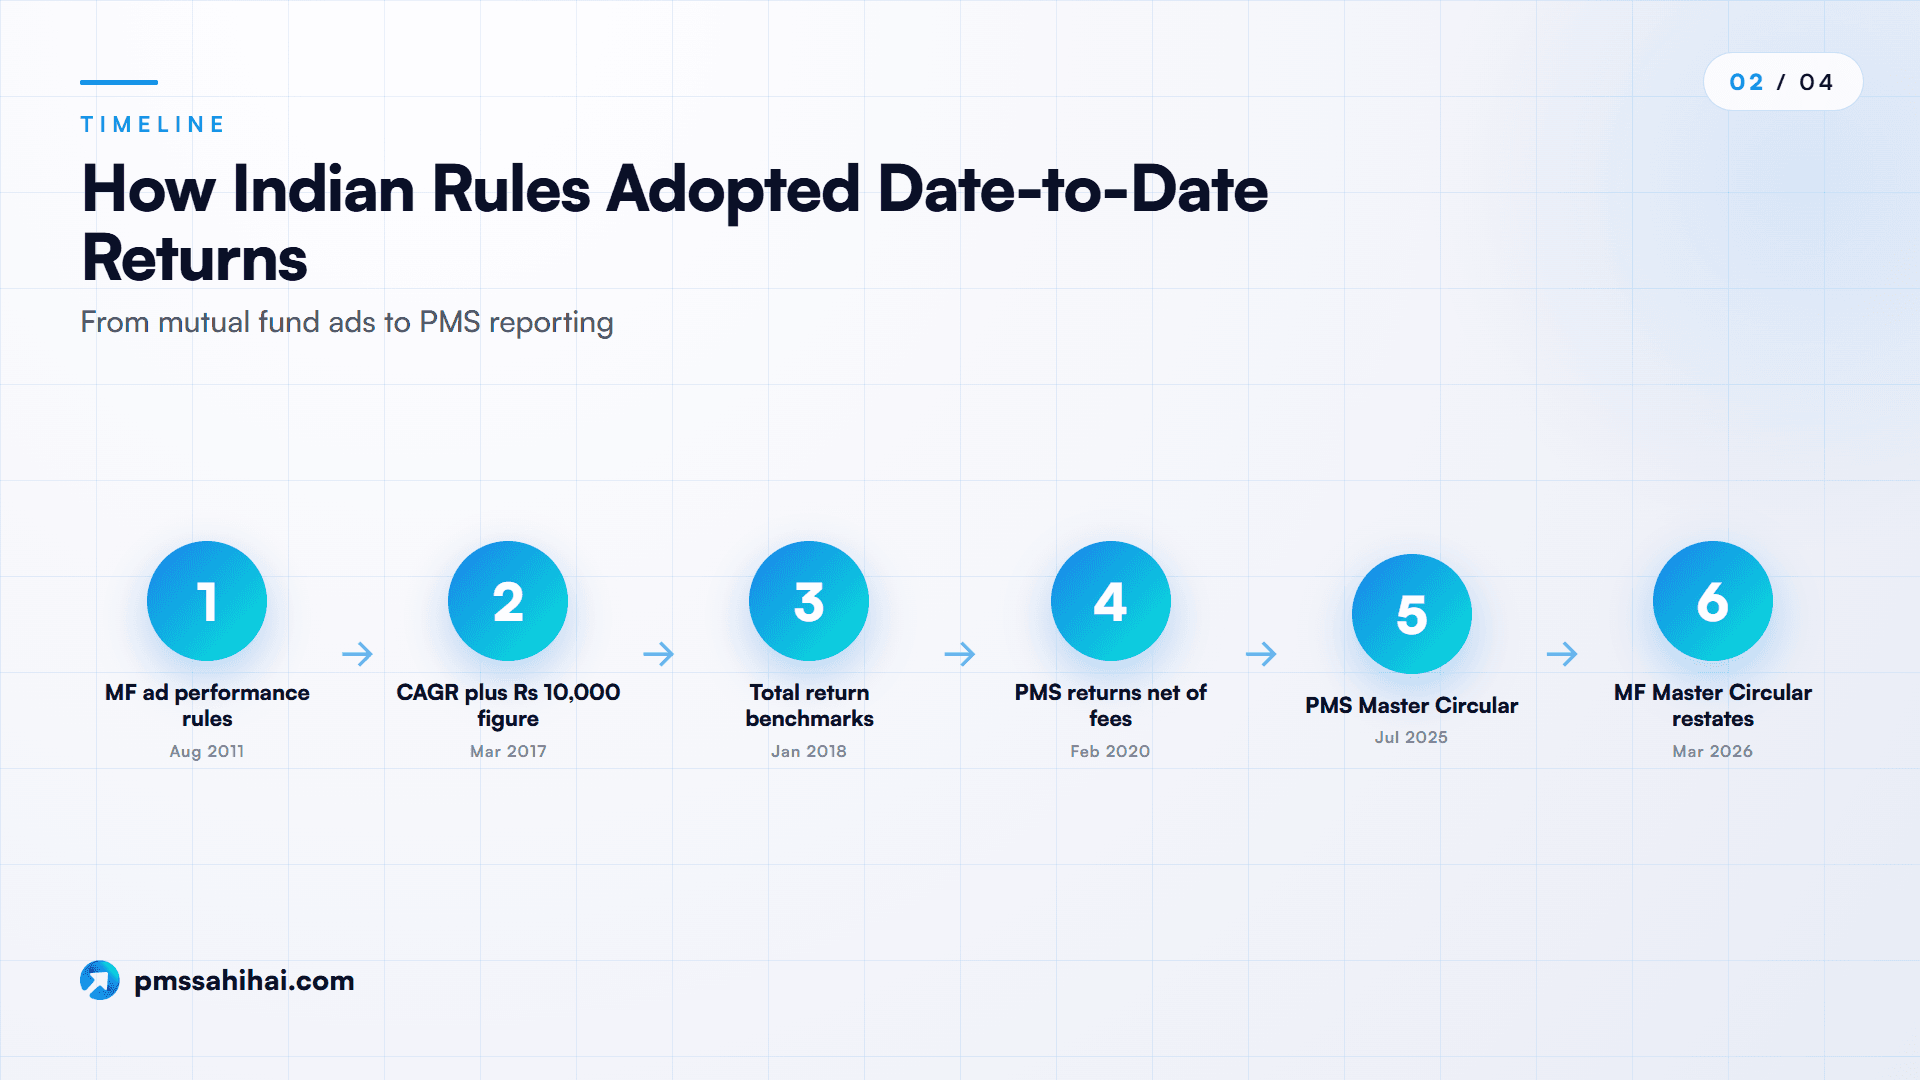
| 22 Aug 2011 | SEBI advertisement circular | Set performance disclosure rules for mutual fund ads, later amended |
| 15 Mar 2017 | SEBI CIR/IMD/DF/23/2017 | CAGR for 1, 3, 5 years and since inception; point-to-point returns on Rs 10,000 added |
| 4 Jan 2018 | SEBI circular on Total Return Index | Scheme benchmarks to use the total return variant from 1 Feb 2018 |
| 13 Feb 2020 | SEBI PMS circular | PMS performance to include cash and be reported net of fees and expenses |
| 16 Dec 2022 | SEBI PMS circular | Benchmarking and reporting framework for portfolio managers |
| 16 Jul 2025 | PMS Master Circular | Consolidated TWRR, XIRR and benchmark rules |
| 20 Mar 2026 | Mutual Fund Master Circular | Restated the Rs 10,000 requirement at para 14.2.1 |
The 2017 circular is the key step. It replaced the older requirement to publish returns for twelve-month periods over three years. In its place came CAGR plus a rupee figure, and the circular gave its reason in plain words: "to provide ease of understanding to retail investors". The current Master Circular keeps the rule: performance is advertised as CAGR at least for 1, 3 and 5 years and since inception, and "point-to-point returns on a standard investment of Rs. 10,000/- shall also be provided".
The same section adds three guardrails that help you read such ads:
- The period is computed from the last day of the month-end before the ad.
- The ad must state whether figures relate to the regular or direct plan.
- Under paragraph 14.2.2, a scheme in existence for under six months cannot show past performance. One between six months and a year shows simple annualised growth.
Paragraph 14.2.3 allows simple annualisation for overnight, liquid and money market funds, with figures available for at least 7, 15 and 30 calendar days, provided the result is not unrealistic or misleading. Investors in those funds hold for short periods, so the logic differs from equity. This does differ from the GIPS position, because the two serve different purposes. If you are comparing a fund ad against a global manager's report, expect the short-period conventions to differ.
SEBI's Board was also shown a memorandum in September 2026 on a common advertisement code across regulated entities. It is a proposal that states amendments will follow due process, so check the current text before relying on any detail of ad wording.
Where Investors Meet These Numbers Today
Mutual fund advertisements. The Rs 10,000 table is the formal home of the term. Look for the scheme's rupee value beside its benchmark and an additional benchmark, as paragraph 14.2.4 of the Master Circular asks for a similar return in rupees and by way of CAGR for those benchmarks.
Apps and research sites. Fund houses and websites widely display trailing figures for periods such as one, three and five years. Those are point-to-point numbers that shift forward as the end date moves, so a figure you saw last month may look different today even if nothing about the fund has changed.
PMS factsheets and statements. The vocabulary changes here. Under paragraph 5.6.1 of the Master Circular for Portfolio Managers, a manager presents the TWRR of an Investment Approach along with the trailing return of the selected benchmark. Under paragraph 5.6.2, your own report shows XIRR for your account, plus the minimum, maximum and median XIRR across investors in that approach. The performance format covers 1, 3, 5 and 10 years and since inception. Performance must include cash and be net of all fees and expenses, and model-portfolio or cherry-picked investor returns are barred. These rules sit under the 2020 Regulations and the July 2025 Master Circular. The SEBI (Portfolio Managers) Regulations, 2026 take effect on 1 April 2027, so re-check reporting details after that date.
Spreadsheets and data feeds. Daily NAV and index histories are easy to obtain, so the sum takes seconds. That has made the measure more accessible, and it has made it just as easy to try many date pairs and publish only the most flattering one. Automated tools can now repeat the sum across every window, which is how rolling analysis became practical for individuals.
What Point-to-Point Returns Do Well
For all the criticism it attracts, this measure earns its place.
- It is quick to check. You need two values and a calculator. If a brochure says Rs 10,000 became Rs 14,500, you can verify the 45% yourself.
- It answers a real question. "What did I earn from the day I bought to the day I sold?" has one correct answer, as long as you made a single investment.
- It speaks in rupees. A retail investor may read "Rs 14,500" more easily than "13.19% CAGR", which was SEBI's stated reason for the rule.
- It allows fair same-date comparison. Run a fund and its benchmark over identical dates and the timing luck is shared. A fund moving from Rs 120 to Rs 174 returned 13.19% a year. A benchmark moving from 1,200 to 1,820 returned 14.89%. The fund trailed by 1.70 percentage points, whichever way the market had moved.
- It works with short histories. Rolling analysis needs a long record, and newer funds may not have one. Two dates are enough here, provided you remember how little they prove.
- It suits goal reviews. If you need a known sum by a known date, checking the annual rate between now and then gives a useful planning figure, separate from any fund verdict.
The practical benefit is speed. You can test a marketing claim in a minute, and a claim that fails a one-minute test does not deserve further attention.
How PMS Sahi Hai and Nyra Put Date-to-Date Numbers in Context
A trailing figure means little on its own, and comparing strategies by hand across websites gets tedious quickly. PMS Sahi Hai, a platform for comparing PMS and AIF strategies, is built around that side-by-side view. It does not have a dedicated point-to-point return calculator, so the sums in this article remain yours to run, but several of its pages shorten the work.
Same-date benchmark comparison. The PMS listing can be filtered by category label and by benchmark. Each strategy page shows trailing returns beside the strategy's stated benchmark, for periods from one month to five years and since inception, with the difference shown as alpha. That is the same-date fund-versus-benchmark check described above, already laid out for you.
A broader score through Nyra. Nyra is the platform's AI-powered research tool. Its published scoring methodology gives 30% of the Nyra Score to excess return over the stated benchmark across one, three and five years, and 15% to consistency. Looking across three periods is a useful counter to relying on any single window. A strategy needs at least 12 months of record to be rated, and the methodology page describes the score as "not a prediction" and "not a recommendation". That wording is worth taking at face value: a score is a starting point for questions, and it cannot remove the date sensitivity in the returns underneath it.
Help with what you already hold. The portfolio health check takes a holdings list and returns a Nyra Score with a rating for each pillar, including returns against a benchmark. Your own account figures need separate reading, and the guide to why your PMS returns differ from published strategy returns walks through the reasons. Two other guides pair well with this one: how to read a PMS factsheet and benchmark selection in PMS.
PMS Sahi Hai is an APMI-registered distributor of PMS and AIF products (APRN08358), and its pages state that Nyra is an analytical tool and not a SEBI-registered investment adviser. Keep that role in mind when reading any shortlist from the platform.
End-Date Bias Shown With Real Nifty Figures
End-date bias, often paired with start-date bias, means the answer depends on where the two dates happen to fall. Most explainers describe this with invented NAVs. Here it is with actual Nifty 50 closing values, taken from Yahoo Finance's daily series for the index.
| Period | Start close | End close | Total return | Annual rate |
|---|---|---|---|---|
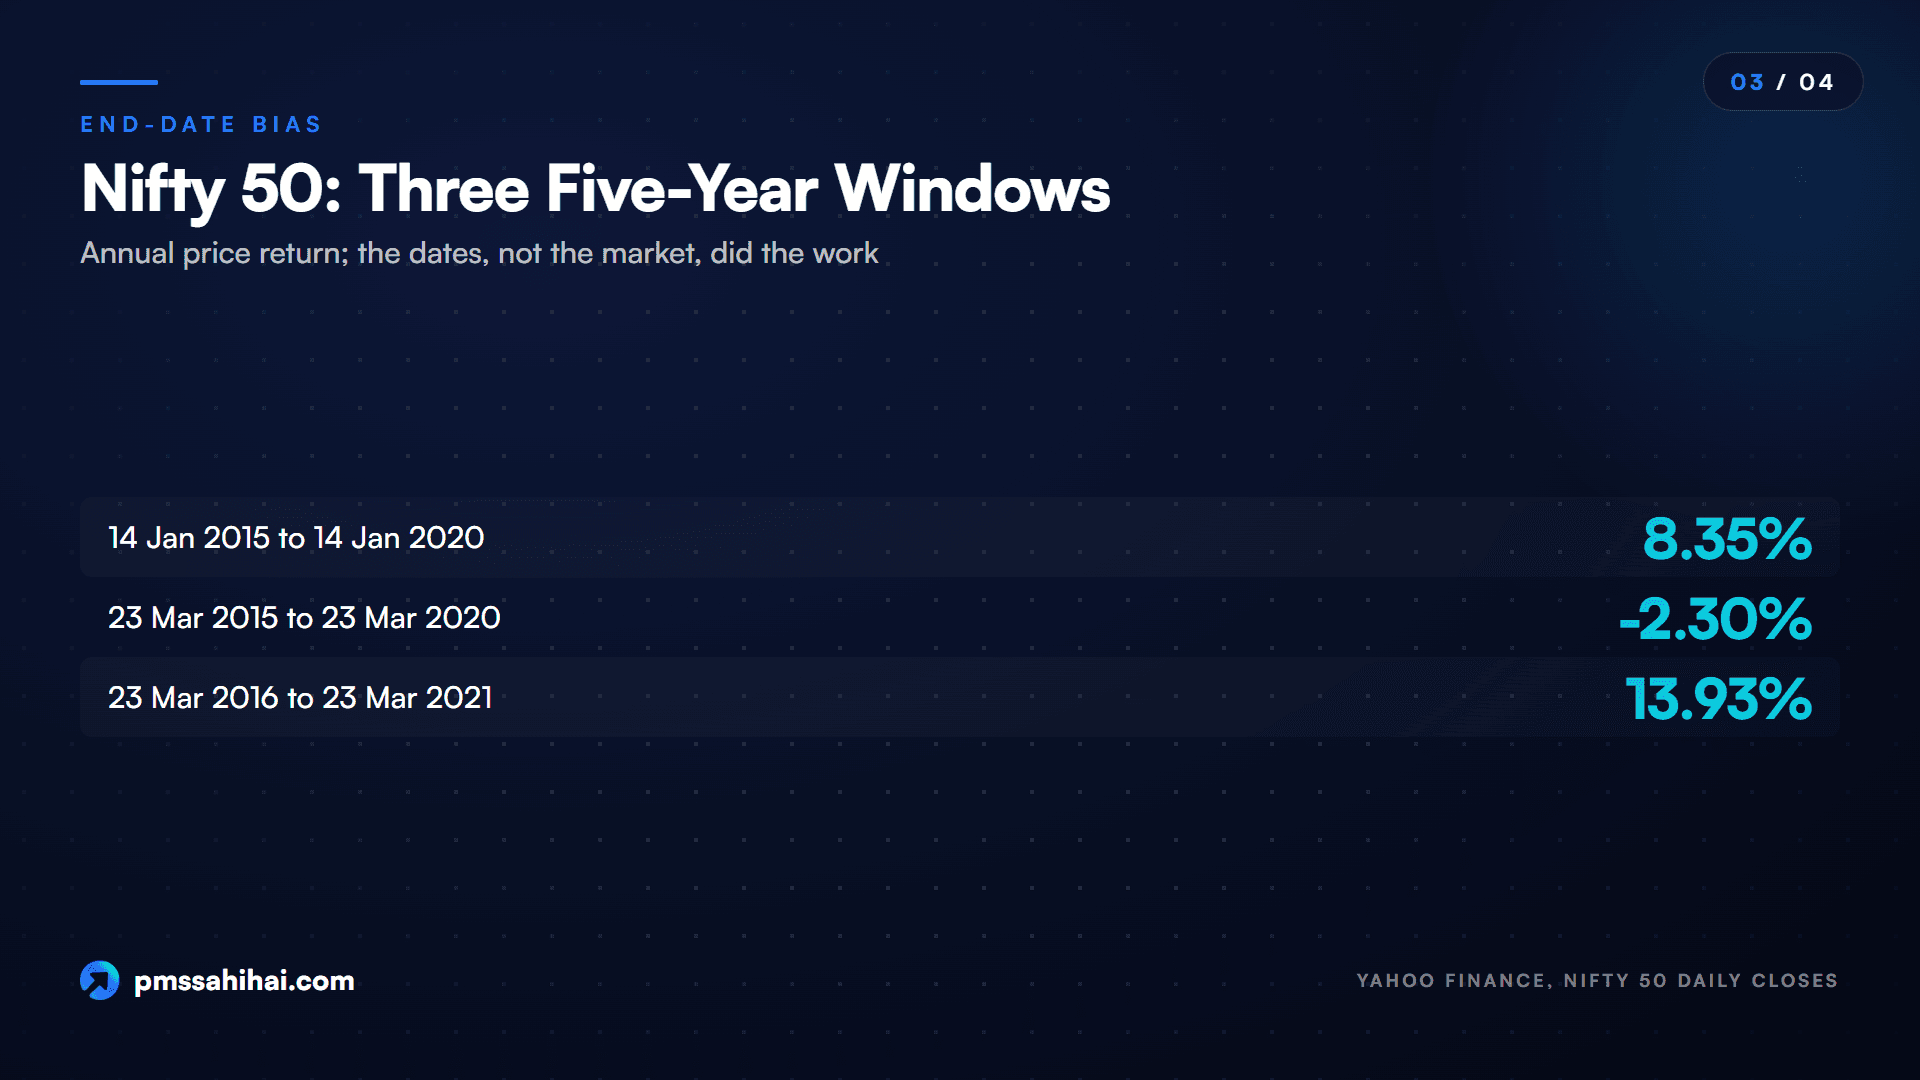
| 14 Jan 2015 to 14 Jan 2020 | 8,277.55 | 12,362.30 | +49.35% | 8.35% |
| 23 Mar 2015 to 23 Mar 2020 | 8,550.90 | 7,610.25 | -11.00% | -2.30% |
| 23 Mar 2016 to 23 Mar 2021 | 7,716.50 | 14,814.75 | +91.99% | 13.93% |
These are three five-year periods for the same index. Moving the dates shifts the annual result from -2.30% to 13.93%. The market did not change character. The dates did the work: 14 January 2020 was the highest close in this series up to that point, and the index had fallen 38.44% in the 69 days to 23 March 2020.
One-year windows swing harder.
| Period | Total return | Rs 10,000 becomes |
|---|---|---|
| 14 Jan 2019 to 14 Jan 2020 | +15.13% | Rs 11,513 |
| 22 Mar 2019 to 23 Mar 2020 | -33.57% | Rs 6,643 |
| 23 Mar 2020 to 23 Mar 2021 | +94.67% | Rs 19,467 |
The 22 March start appears because 23 March 2019 was a Saturday. These figures are price returns, so they leave out dividends and understate what a total return version would show. The values are from a third-party series, so confirm them on NSE before using them elsewhere.
Now apply this to a fund's marketing. A manager whose one-year figure is measured from March 2020 looks brilliant, as does the market itself. A manager measured from January 2020 to March 2020 looks disastrous, however skilled. Neither figure tells you much about the manager. The base effect is also why trailing figures can jump when a very bad or very good month drops out of the window, even if recent performance is flat.
This is why rolling returns exist: they highlight how frequently and how far stronger and poorer periods occurred, instead of reporting one window. If you want a practical habit without full rolling analysis, check the same fund across several end dates and see whether the story holds.
Other Limits of a Single Date-to-Date Number
End dates are the headline problem, but they are not the only one.
It hides the path. Take two funds. One compounds at a steady 11.07% a year for five years. The other returns -20%, -5%, +45%, +30% and +18%. Both turn Rs 1 into about Rs 1.69, so their five-year figures match. An investor in the second fund sat through a loss of 24% after two years, and many people would have sold before the recovery. The CAGR does not reflect volatility or risk.
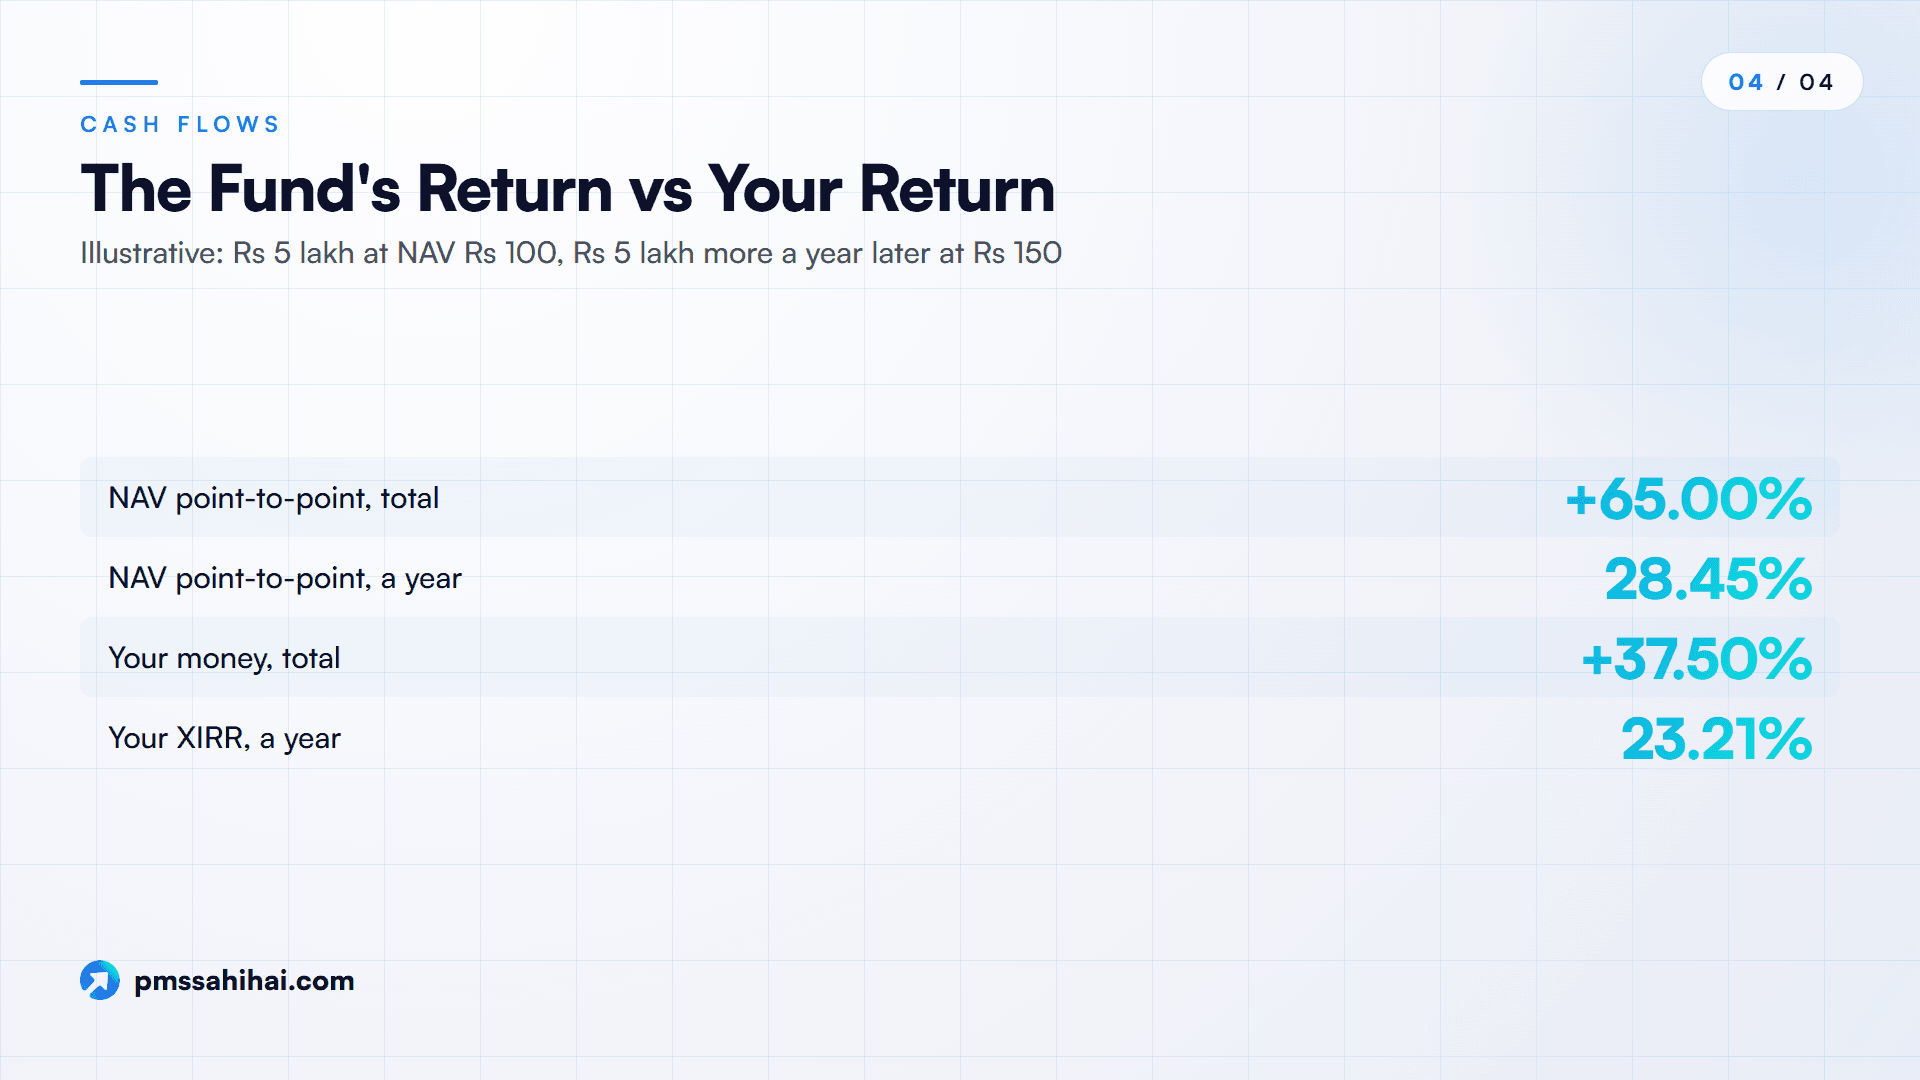
It ignores your cash flows. Suppose you invest Rs 5 lakh at a NAV of Rs 100 and another Rs 5 lakh a year later at Rs 150, and the NAV is Rs 165 after two years.
| Measure | Result |
|---|---|
| NAV point-to-point | +65.00%, or 28.45% a year |
| Your money | Rs 10 lakh became Rs 13.75 lakh, +37.50% |
| Your XIRR | 23.21% a year |
The fund's figure is correct, and so is yours. They answer different questions. This is one reason a PMS client report shows XIRR, and why SEBI's required disclaimer says your performance may vary because of the timing of inflows and outflows.
It may leave out income. A price index only captures capital gains, while a total return index adds dividends and interest. SEBI moved scheme benchmarks to the total return variant from 1 February 2018 for this reason. The gap can be sizeable: Morningstar India calculated in January 2018 that the S&P BSE 100's total return ran 165 basis points a year above its price return over five years, and the share of large-cap funds beating the benchmark fell from 85% to 58%. Those numbers are historic, but the check is current. If a fund's return includes dividends and its benchmark's does not, the comparison flatters the fund.
It may not be what you received. The figure can be gross or net. It may belong to the regular or the direct plan, which have different expense structures. Tax is a further layer: a PMS is taxed on the underlying transactions in your own account, so a pre-tax figure and your take-home differ. For your own position, consult a tax adviser.
It says nothing about tomorrow. Past figures are not forecasts, and a high return from a low base can make a fund look stronger than the next investor's starting point deserves.
A Short Checklist Before Trusting a Return Figure
Point-to-point returns are a good tool used carelessly. They are honest about two dates and silent about everything else. Run through these questions the next time you see one, and most misleading uses fall away.
- What are the two dates? Look for the exact start and end. Be cautious if either falls at an obvious market low or high.
- Is it total or annual? A big number may be a multi-year total. Convert it to an annual rate before comparing.
- Is it under a year? Treat annualised short-period figures with care.
- What is the benchmark over the same dates? Check that it is a total return variant, and the right index for the fund.
- Is it net of costs, and which plan? Direct and regular plans differ. PMS figures should be net of fees and expenses.
- Does it hold on other dates? Try three or four end dates, or look at rolling figures if available.
- Is it your return? If you invested in stages, use XIRR.
No single figure should decide where your money goes. Use it as the opening question, then widen the view with a same-date benchmark comparison or a Nyra Score, and treat neither as the final answer.
Put Your Next Return Figure to the Test
Pick one return figure you have been shown recently and find its two dates. Work out the annual rate, run the benchmark over the same period, then try a different end date. It takes a few minutes, and it tells you more than the headline number did. To repeat the check across strategies, compare PMS strategies on PMS Sahi Hai, look at how Nyra scores them, or talk to the team about a shortlist. Past performance does not guarantee future results, and this article is general information and not investment advice.
PMS Sahi Hai is a distributor of Portfolio Management Services and Alternative Investment Funds, APMI-registered (Registration No. APRN08358). This article is for education only and is not investment advice, a recommendation, or an offer to buy or sell any security. Investments in securities markets are subject to market risks; read all scheme-related documents carefully. Past performance is not indicative of future results. Consult your advisor before investing.
Ishaan founded PMS Sahi Hai to make India's PMS, AIF and GIFT City markets legible to serious investors, comparing every SEBI-registered manager on the same comparative basis, with no shelf products and no commission bias.
Frequently asked
What are point-to-point returns in simple words?
They show how much an investment's value changed between one start date and one end date. If a fund's NAV moved from Rs 120 to Rs 174, the point-to-point return is 45%. The measure looks only at those two values and ignores everything that happened between them, including the size of any falls along the way.
How do you calculate point-to-point returns?
Subtract the start value from the end value, divide by the start value and multiply by 100. For an annual rate, divide the end value by the start value, raise the answer to the power of 365 divided by the number of days held, and subtract one. A spreadsheet handles both in a single formula.
Is a point-to-point return the same as CAGR?
Not quite. Point-to-point describes the two dates, while CAGR is one way of stating the result as a steady yearly rate. The same pair of NAVs can give a 45% total and a 13.19% CAGR over three years. Always check which form you are reading, because a total is not comparable with an annual rate.
Is a point-to-point return the same as trailing returns?
Trailing returns are a type of point-to-point return in which the end date is fixed at a recent date, such as last month-end, and the start date sits a set period back. All trailing returns are point-to-point, but a point-to-point return between two arbitrary past dates is not a trailing return. Some websites use the terms interchangeably.
Why do mutual fund ads show the value of Rs 10,000?
SEBI added this in March 2017, saying it would provide ease of understanding to retail investors. The current Master Circular of 20 March 2026 still requires point-to-point returns on a standard Rs 10,000 investment alongside CAGR. A rupee figure is easier to read than a percentage, though it carries the same dependence on dates.
Are point-to-point returns misleading?
They are accurate but incomplete. The number is correct for those two dates, yet moving the dates can change the story sharply. The Nifty 50's five-year price return was 8.35% a year to 14 January 2020 and -2.30% a year to 23 March 2020. Compare several end dates, and check the benchmark over the same period.
Should a three-month return be annualised?
Generally, be sceptical. An 8% gain over three months compounds to 36.05% on paper, a return nobody has earned. The GIPS standards bar annualising periods under one year. SEBI's mutual fund ad rules differ: schemes between six and twelve months show simple annualised growth, and overnight, liquid and money market funds may use simple annualisation in some cases.
Do point-to-point returns include dividends?
It depends on the values used. Growth-plan NAVs carry reinvested income, so two NAVs capture it. IDCW plan NAVs fall when a payout is made, so a NAV-only figure understates what you received. For indices, a price return variant excludes dividends while a total return variant includes them, which is why SEBI requires the latter for scheme benchmarks.
Can a point-to-point return be used for SIPs?
Not for your own return. A SIP invests different amounts of money at different NAVs, so a single start and end value does not describe your experience. Use XIRR for that. The fund's point-to-point figure still tells you how the NAV moved, but your return depends on when each instalment went in.
Keep reading
All articles
Information Ratio in PMS: Separating Manager Skill From Luck
What the information ratio in PMS tells you: the formula, a worked example, what counts as good, and how many years it takes to rule out luck.
Upside Capture Ratio: How Much of a Bull Market Did Your Fund Catch?
What upside capture ratio means, how to calculate it from monthly returns, why one fund can show 119 or 149, and how to read it in a bull market.

Power of Attorney in PMS: What You Authorise and What You Don’t
What a power of attorney in PMS lets your portfolio manager do, what SEBI rules still bar, how to revoke it, and what changes on 1 April 2027.
Read it. Now pressure-test it.
Ask Nyra how this applies to your portfolio, or talk to our team, no pitch, no pressure.