
Upside Capture Ratio: How Much of a Bull Market Did Your Fund Catch?
What upside capture ratio means, how to calculate it from monthly returns, why one fund can show 119 or 149, and how to read it in a bull market.

The upside capture ratio compares a fund's return with its benchmark's return, counting only the periods when the benchmark rose. A reading of 120 means the fund earned 1.2 times the benchmark's return in those periods, not 20 percentage points more. Our 12-month example gives about 119 on a monthly geometric basis, yet the same data gives 149 on quarterly returns, so always check the method. A high number can simply reflect higher market exposure, so read it next to downside capture and the full-period return.
Why Bull Market Returns Alone Can Mislead You
Suppose two funds each gained 25% in a strong year for Indian equities. Their factsheets look equally impressive. But one was measured against an index that rose 15%, and the other against an index that rose 30%. The first manager added to the market's gain. The second fell short of it, and the headline number hides that completely.
This is the question the upside capture ratio is built to answer. It ignores the months when markets fell and asks a narrow question about the rest: when the benchmark went up, how much of that gain did the fund keep pace with?
That narrowness is both the upside capture ratio's strength and its danger. It gives you a clean view of behaviour in rising periods, which a since-inception return cannot. It also says nothing about what happens when markets fall, and a fund can post a flattering figure simply by taking more market risk.
This guide stays on the upside side of the picture. You will get the definition, the upside capture ratio formula, a full 12-month calculation you can reproduce, and the reasons a single fund can legitimately show several different numbers. All the fund data in the examples below is hypothetical and exists only to show the arithmetic. None of it describes a real fund, and nothing here is investment advice.
What the Upside Capture Ratio Actually Measures
The upside capture ratio meaning is simple. It is a fund's return in the periods when its benchmark rose, divided by the benchmark's return in those same periods, shown on a scale where 100 means the two matched.
Three readings cover almost every case:
- Above 100: the fund gained more than the benchmark in its rising periods.
- Exactly or close to 100: the fund moved broadly in line. Investopedia notes that passive index funds should sit very close to 100.
- Below 100: the fund gained less than the benchmark when the benchmark rose.
You will also see the same measure called the up market capture ratio, up capture or upside capture. They describe the same idea, although the calculation behind the label can differ between data providers.
Note what the period selection depends on. Periods are chosen by what the benchmark did, not by what the fund did. If the benchmark rose 2% in a month and the fund fell 1%, that month still counts, and it drags the ratio down. An upside capture ratio can even turn negative if a fund loses money across the benchmark's rising periods as a whole.
Also watch the wording. An upside capture ratio of 120 is often described as outperforming by 20%. That is loose. If the benchmark returned 10% and the fund 12%, the ratio is 120 but the gap is 2 percentage points. The ratio is a multiple of the benchmark's return, not an excess return.
Up Months Are Not the Same as a Bull Market
Capture ratios are often explained using the words bullish and bearish, and it helps to be precise about what that means. Most calculations do not identify bull markets at all. They sort individual periods, usually months, by the sign of the benchmark's return.
So a rising month inside a long market decline counts as an up month. A falling month in the middle of a powerful rally does not. A fund's upside capture in a bull market in the everyday sense, say across a specific multi-year rally, is a different calculation from the ratio on a data platform. If you want to know how a manager did during one particular rally, compare the fund and benchmark over those exact dates as well.
The practical point is that a five-year upside figure blends every positive month in those five years, whatever the wider market mood was. That is useful, but it is not a report card on any single bull run.
How the Upside Capture Ratio Became a Standard Fund Metric
We could not verify a reliable source naming who first devised the ratio, so we will not guess. What can be dated is how it became part of how Indian investors look at funds.
- September 2012: Morningstar India published an explainer and described showing upside and downside ratios on the Ratings and Risk tab of each fund, over one, three, five, 10 and 15 years.
- June 2017: the Indian personal finance site freefincal described calculating capture from the compounded returns of up months and extended the idea to rolling periods.
- January 2018: SEBI told mutual funds to compare schemes with the total return variant of their benchmarks. This was not about capture ratios directly, but it changed the benchmark return in the denominator.
- December 2022: SEBI set benchmarking and performance reporting rules for portfolio managers, which took effect on 1 April 2023 and made comparisons across PMS strategies more standardised.
Today the upside capture ratio is common in fund education material. Bajaj Finserv Mutual Fund's Equity Compass explainer from August 2026, for instance, describes it with a predefined frequency such as daily, monthly or quarterly. The modern change is less about the idea than about access: once you have monthly returns, a spreadsheet or a few lines of code can produce the number in seconds.
The Upside Capture Ratio Formula Step by Step
The headline upside capture ratio formula is one line:
Upside capture ratio = (Fund return in up periods / Benchmark return in up periods) x 100
The detail lies in how you get those two returns. If you are wondering how to calculate upside capture ratio figures properly, follow these five steps. They use the geometric approach that Morningstar India describes.
- Collect returns for the same periods. Use monthly returns for the fund and for the benchmark, covering identical dates.
- Keep only the up months. Select months in which the benchmark return was above zero. Freefincal's method, for example, treats zero or below as non-up months.
- Compound each series. Multiply (1 + return) across the up months, separately for the fund and for the benchmark.
- Convert to a geometric monthly average. Raise each compounded figure to the power of 1 divided by the number of up months, then subtract 1.
- Divide and scale. Divide the fund's average by the benchmark's average and multiply by 100.
The geometric average matters because returns compound. A simple average of +10% and -10% is zero, yet Rs 100 becomes Rs 99 after those two moves. Compounding reflects what actually happened to the money.

A Worked Upside Capture Ratio Example Over 12 Months
Here is an upside capture ratio example using hypothetical monthly returns. Eight of the 12 months are up months for the benchmark, marked in the last column.
| Month | Fund return | Benchmark return | Up month? |
|---|---|---|---|
| 1 | 3.2% | 2.5% | Yes |
| 2 | -1.5% | -2.0% | No |
| 3 | 4.6% | 3.8% | Yes |
| 4 | 2.1% | 2.4% | Yes |
| 5 | -3.8% | -4.5% | No |
| 6 | 5.2% | 4.0% | Yes |
| 7 | 1.4% | 1.0% | Yes |
| 8 | -2.2% | -1.6% | No |
| 9 | 3.9% | 3.0% | Yes |
| 10 | 0.9% | 1.3% | Yes |
| 11 | -0.6% | -1.2% | No |
| 12 | 2.8% | 2.2% | Yes |
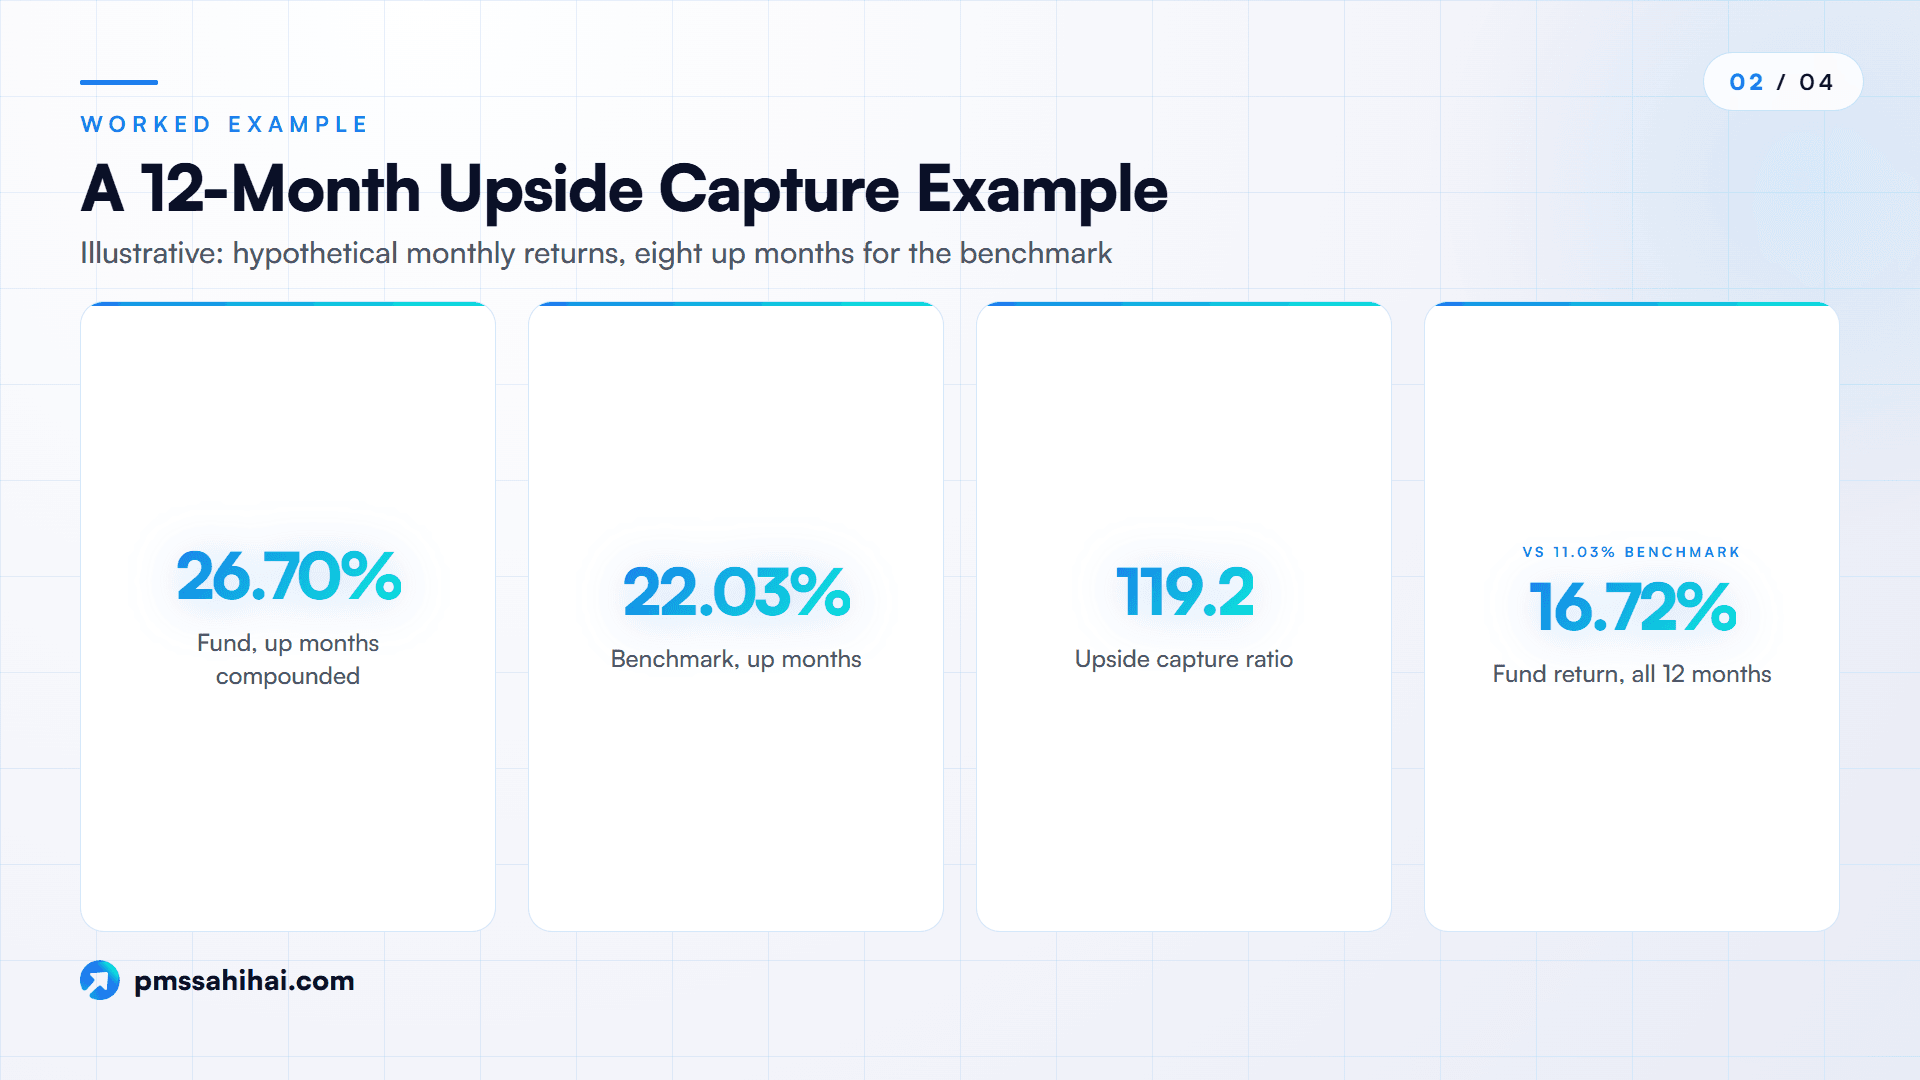
Step 1: compound the up months. For the fund, multiply 1.032 x 1.046 x 1.021 x 1.052 x 1.014 x 1.039 x 1.009 x 1.028, which gives 1.2670. That is a 26.70% cumulative return. For the benchmark, the same eight months compound to 1.2203, or 22.03%.
Step 2: find the geometric monthly average. The fund's eighth root of 1.2670 is 1.03003, an average of 3.00% per up month. The benchmark's eighth root of 1.2203 is 1.02520, an average of 2.52%.
Step 3: divide. 3.003 / 2.520 x 100 gives an upside capture ratio of about 119.2 (119.15 before rounding).
So the fund earned roughly 1.19 times the benchmark's return in up months. Notice two details the single number hides. First, the fund lagged in two of the eight up months: month 4 (2.1% against 2.4%) and month 10 (0.9% against 1.3%). Second, over all 12 months the fund compounded to 16.72% against 11.03% for the benchmark. On a Rs 50 lakh starting value that is about Rs 58.36 lakh versus Rs 55.52 lakh, assuming the returns shown are what the investor actually keeps.
The down months are a separate subject. Purely for reference, the same data gives a downside capture of about 87, and we will use that figure below.
Why One Fund Can Show Several Capture Numbers
If you have ever seen two websites disagree about one fund, this is the likely reason. The upside capture ratio is simple in concept, but several inputs are choices.
Averaging Method Changes the Answer
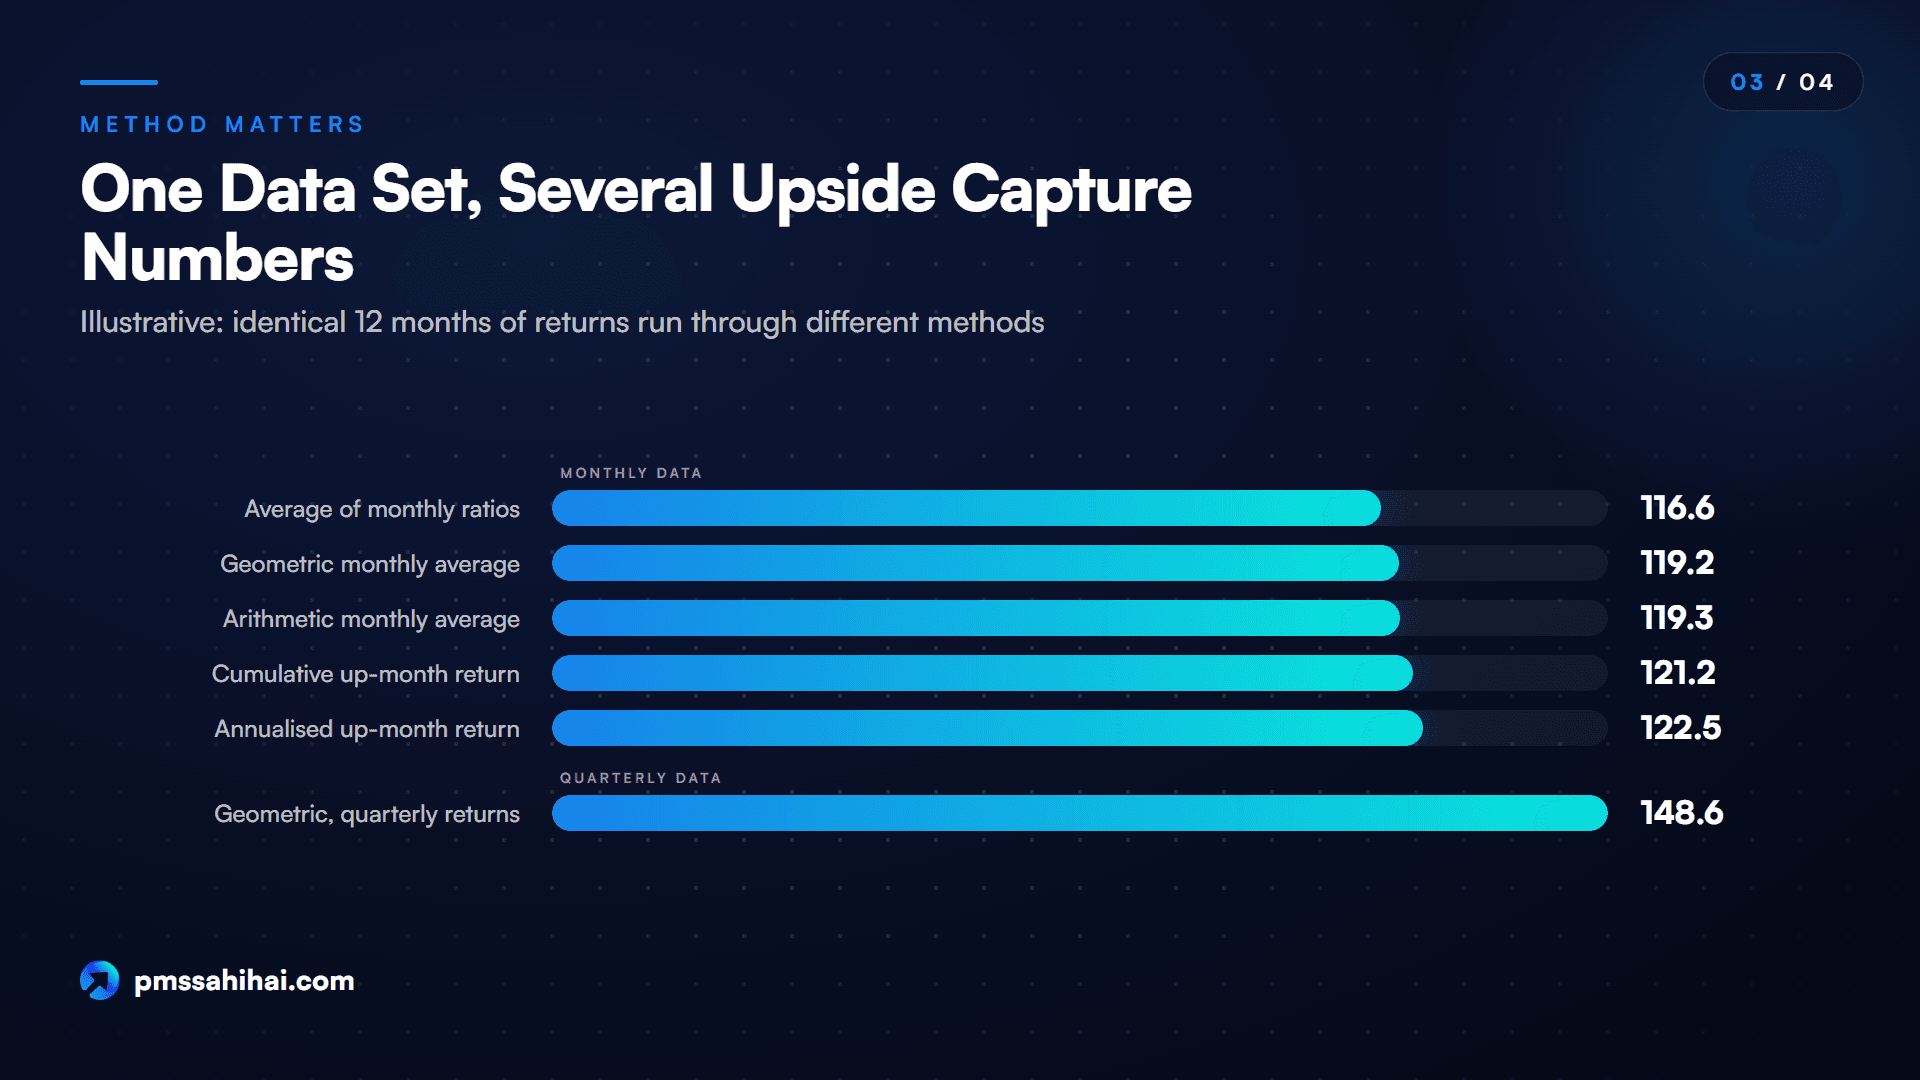
Here is the same 12-month data run through five approaches that appear in practice or follow directly from the formula.
| Method | Fund figure | Benchmark figure | Upside capture |
|---|---|---|---|
| Average of each month's ratio | n/a | n/a | 116.6 |
| Geometric monthly average | 3.00% | 2.52% | 119.2 |
| Arithmetic monthly average | 3.01% | 2.53% | 119.3 |
| Cumulative up-month return | 26.70% | 22.03% | 121.2 |
| Annualised up-month return | 42.62% | 34.81% | 122.5 |
The range is about 117 to 122 on identical data. None of these is a mistake in arithmetic. They answer slightly different questions. The annualised version follows the logic of freefincal's CAGR approach, while the geometric version follows what Morningstar India's article describes. Comparing a 122 from one source with a 119 from another could lead you to think one fund is better when it is the same result.
Return Frequency Can Change It Even More
Now use the same 12 months but measure in quarters instead of months. The fund's four quarters compound to 6.33%, 3.33%, 3.04% and 3.10%. The benchmark's are 4.27%, 1.70%, 2.37% and 2.29%.
Every quarter is positive for the benchmark, so all of the falling months are absorbed inside rising quarters. The geometric upside capture jumps to about 148.6. Compare that with 119.2 on monthly data. Nothing about the fund changed. The filter simply stopped removing the months when the fund held up better than the benchmark, so those months now inflate the upside figure.
This is why capture figures should only be compared at the same frequency, and why monthly data is the safer default. Daily data introduces another issue, because the sample contains far more small moves.
A Short Window Adds Another LayerWindows matter for the upside capture ratio too. Taking only the last three months of our data leaves two up months and a ratio of about 105.5. The first half of the year gives 118.8 and the second half 119.8, both on four up months. Short windows rest on very few observations, and with tiny denominators the ratio can look absurd. A fund returning 0.6% when the benchmark returned 0.2% scores 300 for that month, though the gap is only 0.4 percentage points. Morningstar India's article also warns against relying on one market cycle.
How to Read Upside Capture Ratio Values
Reading an upside capture ratio well is mostly about asking what produced it.
What Counts as a Good Upside Capture Ratio
There is no official cut-off. The sources we reviewed give no regulatory threshold, and a good upside capture ratio depends on what the fund is trying to do. A sensible way to frame it:
- Index funds: close to 100 is the job. A big gap in either direction would raise questions about tracking.
- Diversified active equity: above 100 is the usual hope, as long as the downside record is not worse.
- Defensive or cash-holding strategies: below 100 can be perfectly acceptable if the fund is giving up upside for steadier falls.
- Aggressive or concentrated strategies: above 100 is common, so the more useful question is what risk came with it.
Morningstar India's article gives a real illustration from its time: one fund with a three-year upside capture of 103.83 and downside capture of 76.94. It also notes that most funds show a trade-off, where strong upside comes with weaker downside protection and vice versa. Compare funds with the same benchmark, the same period and the same method, otherwise the comparison means little.
Separating Market Exposure From Stock Selection
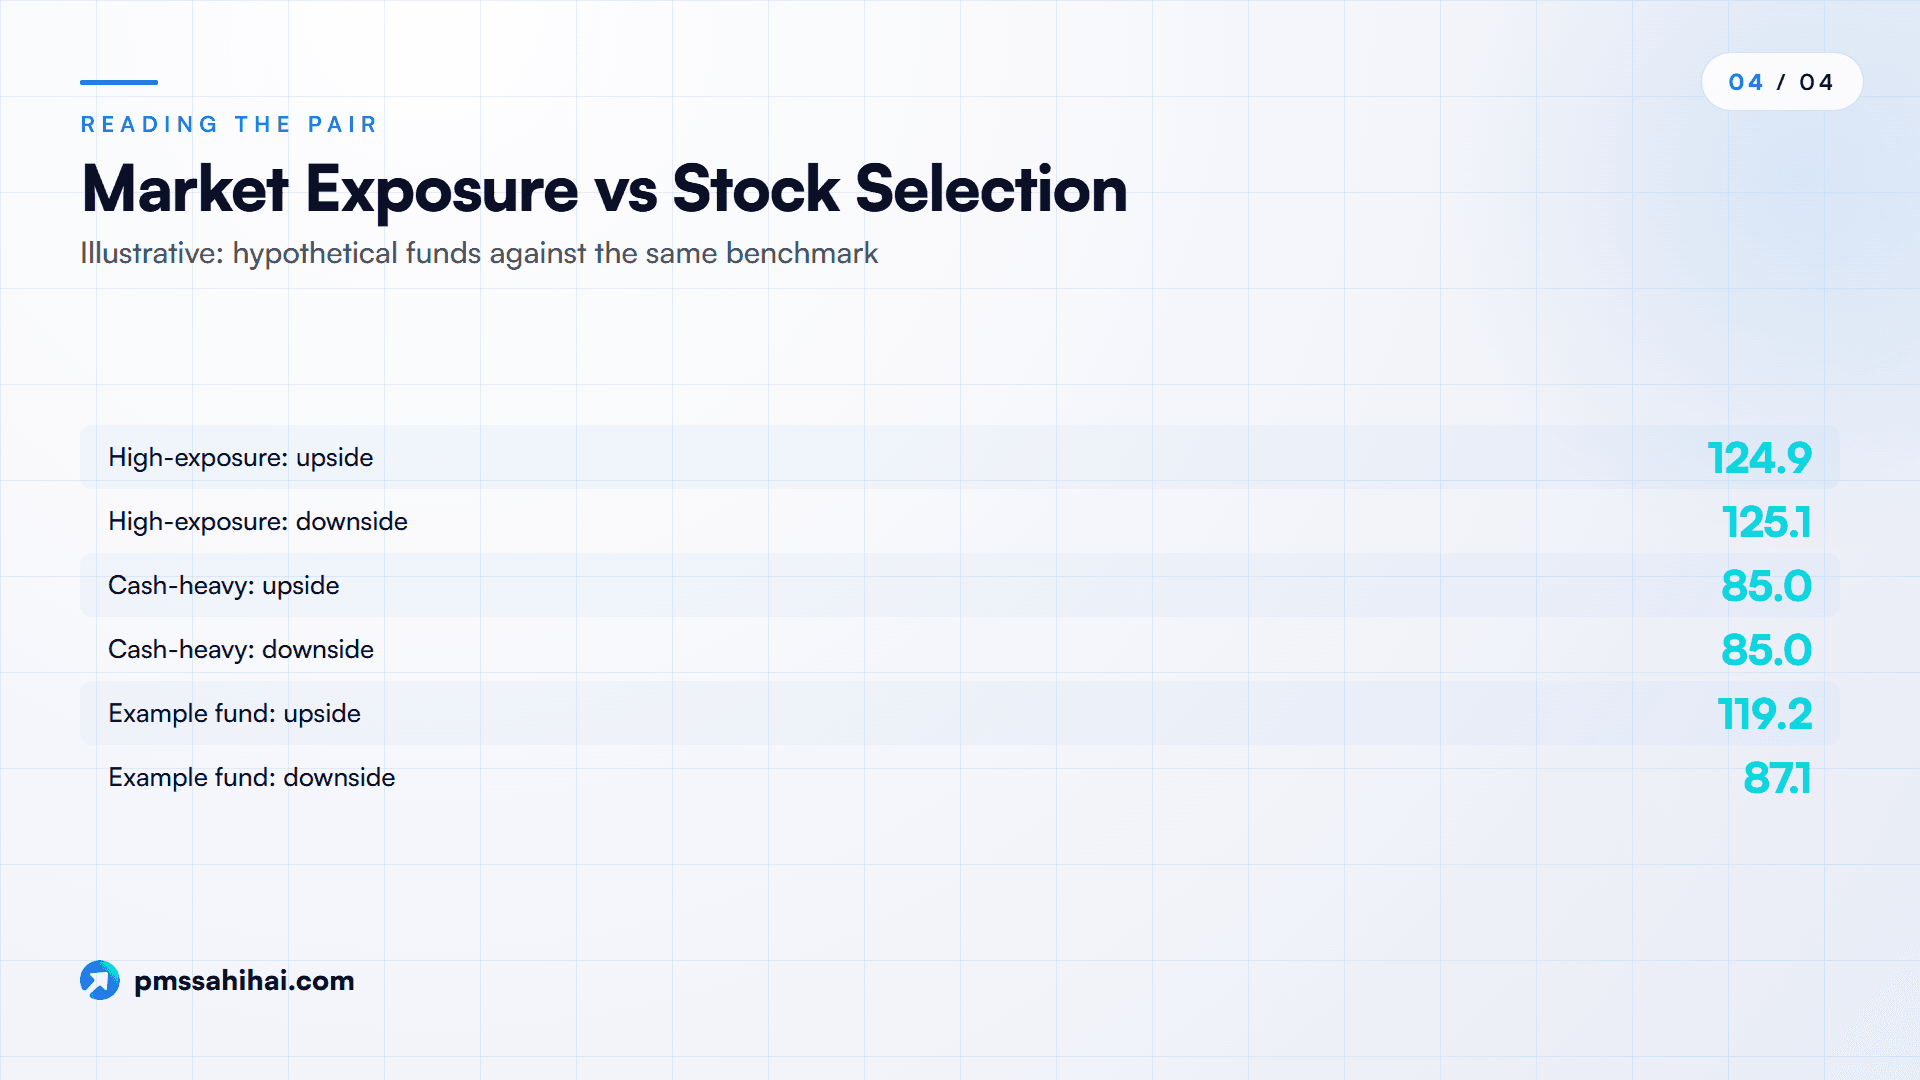
This is the part most explanations skip. A fund can earn a high upside figure with no selection skill at all, simply by being more exposed to the market than the benchmark, which is what a high beta describes. Here are four hypothetical funds run against the same benchmark from our table. The first three are mechanical: each month's return is a fixed multiple of the benchmark's.
| Fund | How it behaves | Upside capture | Downside capture | Full-year return |
|---|---|---|---|---|
| Index-like | 1.00x benchmark every month | 100.0 | 100.0 | 11.03% |
| High-exposure | 1.25x benchmark every month | 124.9 | 125.1 | 13.82% |
| Cash-heavy | 0.85x benchmark every month | 85.0 | 85.0 | 9.36% |
| Our example fund | Month-by-month table above | 119.2 | 87.1 | 16.72% |
Look at the high-exposure fund. Its 124.9 beats the example fund's 119.2, yet nothing about it is clever. It just amplifies the market, and its downside capture rises in step. The example fund is different because its upside figure is above 100 while its downside figure is below 100. That gap, not the upside number alone, is what points to something beyond exposure.
The cash-heavy case also matters to PMS investors. A manager holding cash during a rally shows a low upside figure even if the stocks actually owned did well. The upside capture ratio cannot tell you which of these happened; only the portfolio details can.
Why Investors Use Upside Capture in Rising Markets
With those cautions in place, the upside capture ratio earns its place for several reasons.
- It isolates one market condition. A point-to-point return mixes good and bad months together. This ratio lets you look at rising periods only.
- It is easy to reproduce. You need two return series, not a licence to a specialised tool or a statistics background.
- It is comparable across funds on one benchmark. A single scale around 100 lets you line up several funds, if the method and period match.
- It has a natural reference point. Because an index fund should be close to 100, any distance from 100 gives you something specific to ask about.
- It pairs neatly with downside capture. Together they show the shape of a fund's returns, which a single return figure cannot.
- It helps set expectations. If a defensive fund has historically captured 85 of the benchmark's rises, you are less likely to be disappointed by it in the next rally and less tempted to exit at the wrong time.
It also makes conversations easier. Instead of asking a manager "why did you trail in the rally?", you can ask "your upside capture was 90 over three years on a monthly basis; was that cash levels, sector choices or stock selection?" That is a question with a real answer.
Using the Upside Capture Ratio on a PMS Strategy
Most explainers stop at mutual funds, but investors in portfolio management services can ask the same question. The mechanics are the same; the data route is different.
Start with the reporting rules. SEBI's circular of 16 December 2022 requires a portfolio manager to present the time-weighted rate of return of an investment approach along with the trailing return of the selected benchmark when mentioning performance. SEBI's PMS FAQ of September 2024 repeats this. The time-weighted figure is the right one for this purpose because it reduces the effect of client cash flows, which makes it a better measure of the manager's decisions.
Know whose return you are measuring. The same circular says an investor's own report shows XIRR, with the minimum, maximum and median XIRR across investors. Your personal XIRR reflects your flows and timing, so do not plug it into a capture calculation against the benchmark and treat the answer as the manager's record.
Check the benchmark. Under the circular, each investment approach is tagged to one of four Strategies (Equity, Debt, Hybrid, Multi Asset), and APMI prescribes a maximum of three benchmarks per Strategy. The Master Circular of 16 July 2025 retains this. So a broad benchmark may be a permitted choice for a narrower portfolio, as our guide to benchmark selection in PMS explains. If a small-cap portfolio is measured against a broad index, its upside figure in a small-cap rally can look strong for reasons of style rather than skill. Morningstar India's article flags the same style-mismatch risk.
Confirm total return, not price return. SEBI's 2018 circular explains that a price index captures only capital gains, while a total return index also includes dividends and interest. That circular was addressed to mutual funds, not portfolio managers, so ask which variant your PMS benchmark uses. The Nifty 500, for example, has a Total Returns variant listed on its NSE factsheet. A price-return denominator is smaller, so it flatters any capture figure.
Find the monthly data. SEBI's reporting format covers one-month to since-inception time-weighted returns for each approach and its benchmark, and managers file monthly reports with SEBI and APMI within seven working days of month-end. The format we read has no capture ratio field, so you may have to compute it yourself or ask the manager for a monthly return series. Also ask whether those returns are stated before or after fees, and whether the same basis applies to every month. A fee-free fund figure compared with a benchmark is not what you will actually experience.
A manager's own capture figures, if offered, are a marketing document until you can reproduce them. Our post on how to read a PMS factsheet covers where the other numbers sit.
How PMS Sahi Hai Helps You Put Upside Capture in Context
A capture ratio tells you what happened. Choosing a strategy also needs everything around it, and that is where PMS Sahi Hai fits. It describes itself as India's first AI-powered PMS and AIF marketplace.
Its research tool, Nyra, is described as covering more than 900 PMS, AIF and GIFT City offerings on a single 0 to 10 Nyra Score. The Nyra methodology lists five pillars: return performance, risk-adjusted return, downside protection, consistency, and structure and stewardship. Strategies with under 12 months of track record show as Not Rated rather than getting a guessed score, which is the right instinct given how unreliable short-window capture figures are.
Here is the honest limit. We could not confirm that Nyra publishes the upside capture ratio as its own field, so do not assume you will find this number there. What these pillars offer is the context a lone upside figure lacks: whether strong rising-market returns came with downside protection and consistency.
A practical way to combine the two:
- Use the comparison tool to shortlist strategies that share a broad style, so you are not comparing unlike portfolios.
- Read the Sortino ratio and drawdown explainers to judge the risk side of any rally.
- Ask each shortlisted manager for a monthly return series, then run the five steps from this guide yourself.
Nyra is an analytical tool, not a SEBI-registered investment adviser, and its output is informational rather than personalised advice.
Where the Upside Capture Ratio Falls Short
No single metric deserves your full trust, and this one has specific gaps.
It ignores the other half of returns. Investopedia notes that critics say a focus on gains alone may encourage risk-taking. To see why this matters, take a hypothetical fund that earns 1.10x the benchmark in up months and 1.35x in down months. Its upside capture is a respectable 110.0, and its downside capture is 135.2. Over our 12 months it returns 9.47% against the benchmark's 11.03%. Above 100 on the upside, and still behind.
It is backward-looking. A high upside capture ratio describes one past period under one manager and one market mix. Morningstar India cautions against relying on a single figure over one market cycle. Freefincal's author goes further, saying in his experience one should not expect consistently high upside capture.
It is benchmark-dependent. Change the benchmark and the upside capture ratio changes. A figure without a named benchmark is close to useless.
It depends on method and frequency. As shown above, identical data can produce 117, 122 or 149. Providers do not always state their approach prominently.
It can hide concentration in time. A ratio built from 36 months can be driven by a handful of very strong months. In our example, the month-to-month readings ranged from 69 to 140, and two up months were below 100.
It says nothing about why. Selection, sector tilt, cash levels, leverage where permitted and beta can each produce the same number. You need the alpha and beta picture and the portfolio itself for that.
It does not capture what you keep. Taxes and your own timing of inflows sit outside the calculation.
A Practical Routine Before Trusting the Number
Use the upside capture ratio as a question generator, not a verdict. Before relying on one, run through this list:
- Name the benchmark and confirm it matches the portfolio's style.
- Confirm total return versus price return.
- Note the frequency and method, and use the same ones across every fund you compare.
- Prefer several years of monthly data, and look at more than one window.
- Put downside capture beside it. Ask whether the two numbers sit apart, or rise and fall together.
- Check the full-period return. A fund with a fine upside figure can still lag overall.
- Ask the manager what drove the number and where the data came from. Firm-level performance data is subject to an annual audit under SEBI's circular of 2 August 2023, but a capture figure in a pitch is not necessarily part of that.
If you do just one thing, make it step 5. An upside figure on its own tells you how a fund behaved in the good months and nothing about the price paid for that behaviour. PMS Sahi Hai and Nyra can support the wider research around it, but the reproducible calculation is yours to check.
Check Your Fund's Bull Market Record Before You Decide
Next time a fund or PMS is pitched on its performance in a rally, ask for three things: the upside figure, the downside figure and the method behind both. If the numbers cannot be reproduced from monthly returns against a named benchmark, treat them with caution.
When you want to set that record beside a strategy's wider risk and consistency, explore the field with Nyra or book a 15-minute conversation with PMS Sahi Hai. Bring the numbers and your questions, and test every answer against the monthly data.
PMS Sahi Hai is a distributor of Portfolio Management Services and Alternative Investment Funds, APMI-registered (Registration No. APRN08358). This article is for education only and is not investment advice, a recommendation, or an offer to buy or sell any security. Investments in securities markets are subject to market risks; read all scheme-related documents carefully. Past performance is not indicative of future results. Consult your advisor before investing.
Ishaan founded PMS Sahi Hai to make India's PMS, AIF and GIFT City markets legible to serious investors, comparing every SEBI-registered manager on the same comparative basis, with no shelf products and no commission bias.
Frequently asked
What is upside capture ratio in simple words?
The upside capture ratio shows how much of a benchmark's gains a fund matched during periods when that benchmark rose. A reading of 100 means the two matched. Above 100 means the fund gained more, and below 100 means it gained less. Falling periods are excluded, so it describes only one part of a fund's record.
How is upside capture ratio calculated?
Select the months when the benchmark rose. Compound the fund's returns and the benchmark's returns for those months separately, convert each to a geometric monthly average, then divide the fund's average by the benchmark's and multiply by 100. Some providers use arithmetic averages or cumulative returns, so results can vary slightly across sources.
What is a good upside capture ratio?
No official threshold exists in the sources we reviewed. Index funds should sit near 100, active equity funds usually aim above 100, and defensive strategies may reasonably sit below it. What matters more is the gap against downside capture on the same benchmark, period and method. A figure above 100 alone can simply reflect higher market exposure.
What does an upside capture ratio of 120 mean?
It means the fund earned 1.2 times the benchmark's return in the periods when the benchmark rose. If the benchmark gained 10% in those periods, the fund gained about 12%. It does not mean the fund beat the benchmark by 20 percentage points, and it says nothing about how the fund behaved when the benchmark fell.
Can upside capture ratio be negative?
Yes, in principle. The ratio is negative if the fund lost money across the months when its benchmark rose as a whole. This is unusual for a diversified equity fund but possible over short windows, for hedged portfolios, or for a strategy with a poorly matched benchmark. A negative reading should prompt a close look at the benchmark.
Is a higher upside capture ratio always better?
No. A higher figure can come from higher market exposure, which usually raises losses in falling months too. A fund with 125 upside and 125 downside is amplifying the market, not necessarily adding skill. Compare the upside and downside figures together and check the full-period return, because a fund with a high upside number can still trail its benchmark.
Does upside capture ratio predict future returns?
No. It is a historical measure based on one past period, one benchmark and one market environment. A fund's portfolio, manager or market conditions can change. It is better used to understand how a fund has tended to behave and to set expectations, rather than to forecast its returns in the next rally.
Do PMS strategies report upside capture ratio?
SEBI's monthly reporting format for portfolio managers centres on time-weighted returns against a benchmark, and the format we read has no capture ratio field. Some managers may show the figure in their own material. You can ask for a monthly return series, confirm whether it is net of fees, and calculate the ratio yourself.
Keep reading
All articles
Information Ratio in PMS: Separating Manager Skill From Luck
What the information ratio in PMS tells you: the formula, a worked example, what counts as good, and how many years it takes to rule out luck.

Power of Attorney in PMS: What You Authorise and What You Don’t
What a power of attorney in PMS lets your portfolio manager do, what SEBI rules still bar, how to revoke it, and what changes on 1 April 2027.
What Are Point-to-Point Returns? Meaning, Formula and Uses
Point-to-point returns explained: formula, CAGR and Rs 10,000 forms, SEBI's disclosure rule, and real Nifty figures showing how end dates change results.
Read it. Now pressure-test it.
Ask Nyra how this applies to your portfolio, or talk to our team, no pitch, no pressure.