
Information Ratio vs Alpha: Size of the Edge or Its Reliability?
Alpha shows the size of a PMS manager's edge; the information ratio shows how reliable it is. See four worked strategies and how to read both.

Alpha tells you how much return a manager added. The information ratio tells you how dependably that return arrived, relative to the risk of straying from the benchmark. The information ratio vs alpha question is therefore not about which number is better, because they answer different questions. A strategy can show positive Jensen's alpha and a negative information ratio at the same time, as our four-strategy example shows. Read alpha for the size of the edge, the information ratio for its reliability, and neither without checking the benchmark and the length of the record.
Why Investors Confuse the Information Ratio and Alpha
Open two PMS presentations and you may see two managers claim the same achievement in different words. One shows a large alpha. The other shows a high information ratio. Both sound like proof of skill, and many explainers treat them almost as synonyms. Some even label the numerator of the information ratio as "alpha", which makes the confusion worse.
The two numbers are related, but they are not interchangeable. Alpha is measured in percentage points of return. It answers a question about size: how much did this manager add? The information ratio has no units. It answers a question about dependability: how much did the manager add for each unit of risk taken away from the benchmark?
That difference has money attached to it. A manager with a big alpha may have earned it from two lucky months. A manager with a superb ratio may have added so little that fees consume it. Picking on either number alone can lead you to the wrong strategy, particularly in a concentrated PMS where the portfolio can look nothing like the index.
This guide treats the information ratio vs alpha comparison as its own topic. It does not teach beta from scratch, and it does not rank funds. It takes one small data set, runs it through both measures, and shows exactly where they agree and where they split. If you can follow a percentage and a table, you can follow all of it.
Information Ratio vs Alpha at a Glance
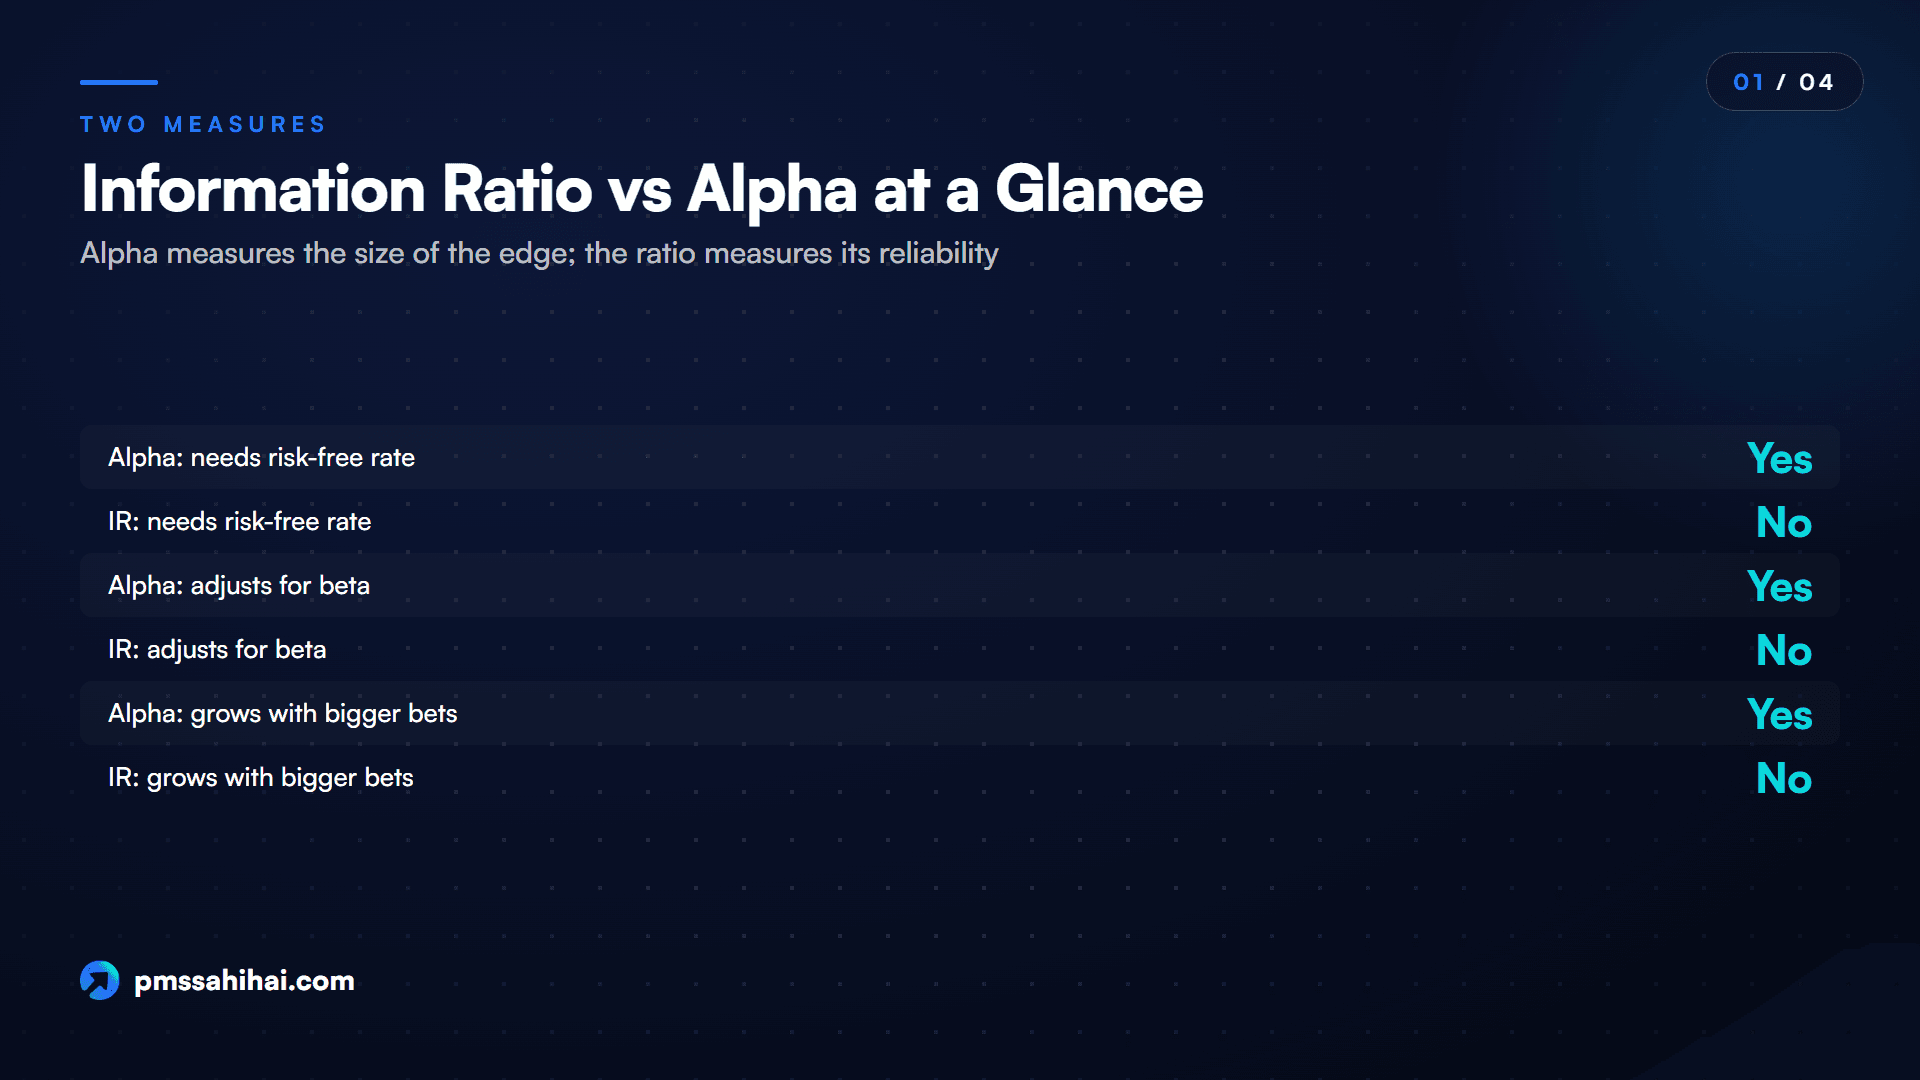
Here is the alpha vs information ratio comparison in one view, before we get to the arithmetic.
| Question | Alpha (Jensen's version) | Information ratio |
|---|---|---|
| What it measures | Return above what market exposure would predict | Return above the benchmark per unit of variability in that gap |
| Unit | Percentage points a year | A pure number |
| Formula | Rp − [Rf + β × (Rb − Rf)] | (Rp − Rb) ÷ standard deviation of (Rp − Rb) |
| Needs a risk-free rate? | Yes | No |
| Adjusts for beta? | Yes | No, unless you use the appraisal ratio |
| Risk it cares about | Market risk, through beta | Tracking error |
| Grows with bigger bets? | Yes | Not by itself |
| Best at telling you | How much was added | How dependable the addition was |
| Most common misuse | Quoting a benchmark gap as "alpha" | Praising a high ratio on a tiny edge |
In the formulas, Rp is the portfolio return, Rb the benchmark return, Rf the risk-free rate, and β the portfolio's beta against the benchmark. Tracking error is simply the standard deviation of the gap between portfolio and benchmark returns.
A quick way to remember it: alpha is the numerator with the market taken out; the information ratio is a numerator with the wobble taken into account.
Where Alpha and the Information Ratio Came From
Alpha came first, and it came from academic work on fund managers. The Capital Asset Pricing Model, published by William Sharpe in 1964, argued that an asset's expected return depends on its exposure to the market. In 1968, Michael Jensen used that idea to test whether mutual fund managers earned more than their market exposure could explain, in a study titled "The Performance of Mutual Funds in the Period 1945-1964". The intercept he estimated is what we now call Jensen's alpha.
Five years later, in 1973, Fischer Black and Jack Treynor published a model for building portfolios from security analysis. In their approach, the weight of each active position depends on its alpha divided by the variance of its residual risk. The idea that a forecast of alpha must be judged against the unexplained risk that comes with it was now part of the toolkit.
The information ratio grew out of that thinking. In his 1994 article "The Sharpe Ratio", William Sharpe generalised his own measure to the return on a "zero-investment strategy": long the fund, short the benchmark. He noted that authors associated with the risk-modelling firm BARRA were using the term information ratio for such a measure. Richard Grinold and Ronald Kahn's book, Active Portfolio Management, then made the ratio a central idea for active managers. Their Fundamental Law describes the value of active management through two inputs: skill and breadth, the number of independent opportunities.
The Indian chapter is recent. SEBI standardised PMS benchmarking from 1 April 2023, and from 2025 it required equity-oriented mutual fund schemes to publish the information ratio. A measure long associated with professional manager selection now reaches retail investors daily.
Two Meanings of Alpha That Change the Comparison
Before comparing anything, find out which alpha you are looking at. The same word covers two different calculations, and the gap between them can be large.
Simple Alpha Is Just Active Return
The loose meaning is the plain gap: portfolio return minus benchmark return. Many websites and factsheets call this alpha. The precise name is active return, or excess return over the benchmark. It is easy to calculate and easy to understand, but it takes no account of how much market risk the manager took. A portfolio that holds high-beta stocks in a rising market will show a healthy gap without any stock-picking skill.
Jensen's Alpha Takes Market Exposure Out
Jensen's alpha is stricter. It asks what return the portfolio's beta would have earned by itself, then subtracts that from the actual return. The usual method is a regression of the portfolio's returns over the risk-free rate on the benchmark's returns over the risk-free rate. The intercept is alpha, the slope is beta, and whatever is left over each month is the residual.
If you want the mechanics of beta and a full calculation, our sister guide to alpha and beta in PMS walks through them. Here we only need the result.
The Bridge Formula Connects the Two
One identity links them, and it explains most of the arguments you will see about these measures:
Active return = Jensen's alpha + (β − 1) × (Rb − Rf)
Read it slowly. The gap over the benchmark has two parts: alpha, plus a part that comes purely from carrying more or less market risk than the index. When beta is 1, the second term vanishes and the two meanings of alpha match. When beta is well above 1 in a rising market, active return flatters the manager. When beta is well below 1 in a rising market, active return understates the manager.
Since the standard information ratio uses active return in its numerator, it inherits this effect. That is why it can disagree with Jensen's alpha even on its sign. There is a variant that removes the problem: the appraisal ratio divides Jensen's alpha by residual risk, the standard deviation of the regression's leftovers. Some writers call this version the information ratio too, so always check which one a document means.
Worked Example: Four PMS Strategies on Both Measures
The strategies below are invented for illustration. They are not real products, and the figures are not forecasts. Using one small data set lets you check every number yourself in a spreadsheet.
The Inputs: Twelve Months of Returns
Assume a risk-free rate of 7% a year, or about 0.58% a month. All figures are monthly returns in per cent.
| Month | Benchmark | Strategy A | Strategy B | Strategy C | Strategy D |
|---|---|---|---|---|---|
| 1 | 3.0 | 4.8 | 3.4 | 8.5 | 1.9 |
| 2 | −2.0 | −2.6 | −2.4 | −6.6 | −1.1 |
| 3 | 4.0 | 6.4 | 4.0 | 4.7 | 4.1 |
| 4 | 1.5 | −1.5 | −0.2 | 0.7 | 1.8 |
| 5 | −1.0 | −0.7 | 0.4 | −0.4 | −1.4 |
| 6 | 2.5 | 4.1 | 3.6 | 2.2 | 2.0 |
| 7 | 3.5 | 3.6 | 3.6 | −2.1 | 2.3 |
| 8 | −3.0 | −4.8 | −2.5 | −0.9 | −1.6 |
| 9 | 2.0 | 3.1 | 2.4 | 0.1 | 0.6 |
| 10 | 1.0 | 1.3 | 0.7 | 10.9 | 1.2 |
| 11 | 2.5 | 3.2 | 3.5 | 3.4 | 2.2 |
| 12 | −0.5 | −0.7 | −0.7 | 0.1 | 1.0 |
Annual figures below are the simple average month times 12, and tracking error is the monthly standard deviation of the gap times the square root of 12. The benchmark therefore shows 13.5% a year, and its excess over the risk-free rate is 6.5%. Compounding would give slightly different figures, but keeping everything arithmetic makes the links between columns exact.
The Results: Same Data, Different Winners
| Measure | Strategy A | Strategy B | Strategy C | Strategy D |
|---|---|---|---|---|
| Annual return | 16.2% | 15.8% | 20.6% | 13.0% |
| Active return | +2.7% | +2.3% | +7.1% | −0.5% |
| Tracking error | 5.27% | 2.86% | 14.30% | 3.34% |
| Information ratio | 0.51 | 0.80 | 0.50 | −0.15 |
| Beta | 1.40 | 1.00 | 1.00 | 0.70 |
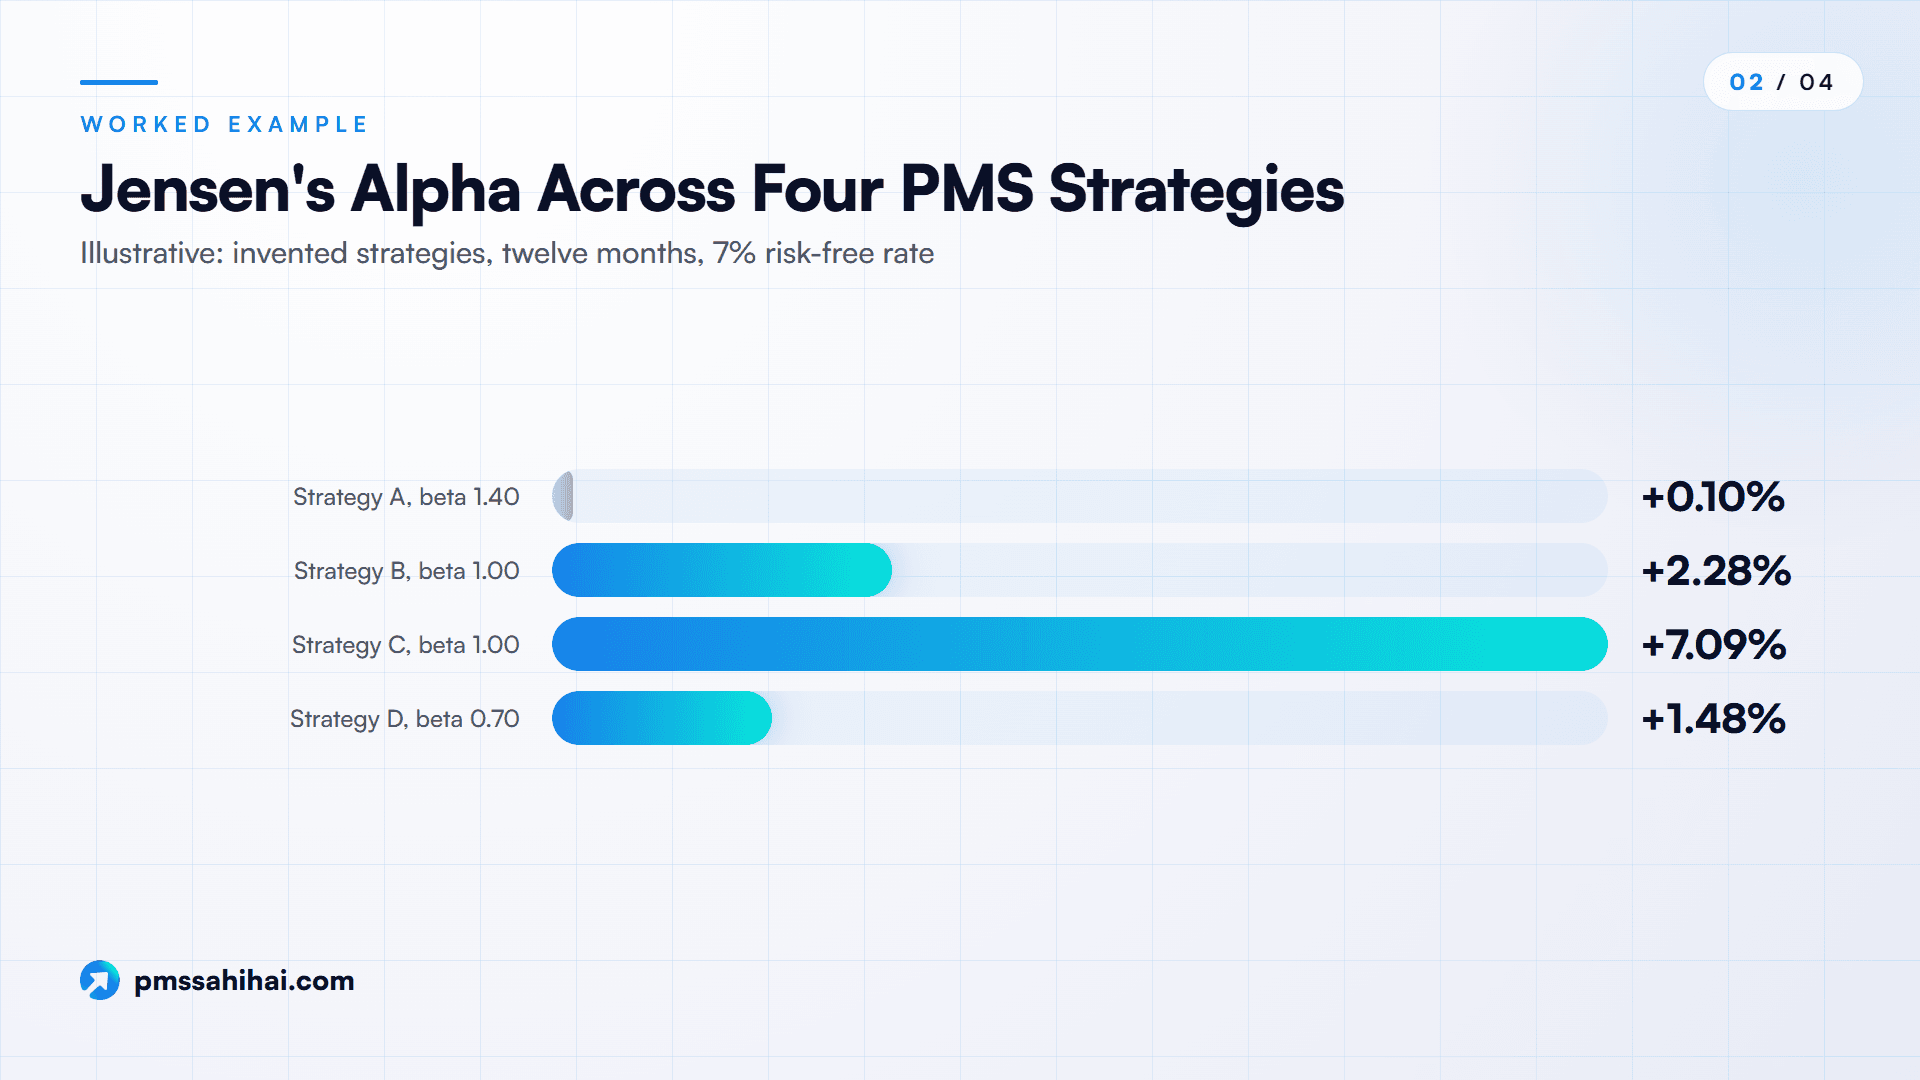
| Jensen's alpha | +0.10% | +2.28% | +7.09% | +1.48% |
| Residual risk | 4.45% | 3.00% | 14.99% | 2.47% |
| Appraisal ratio | 0.02 | 0.76 | 0.47 | 0.60 |
Each strategy tells a different story.
Strategy A is market risk in disguise. It beats the benchmark by 2.7% and has a respectable information ratio of 0.51. But Jensen's alpha is just 0.10%. The bridge formula shows why: 0.10% + 0.40 × 6.5% = 2.7%. Practically all of the gap came from a beta of 1.40 in a rising year. Its appraisal ratio of 0.02 gives the game away.
Strategy B is the steady one. Its alpha of 2.28% is modest, but tracking error is only 2.86%, so the information ratio of 0.80 is the best of the four. With a beta of 1.00, simple and Jensen's versions almost coincide.
Strategy C is the big, bumpy edge. It has by far the largest alpha at 7.09%. Yet its information ratio of 0.50 is level with Strategy A, the one with nearly no alpha. Look at months 1, 2 and 10 in the table: a few sharp swings drive the result.
Strategy D is the one that breaks the rule of thumb. It trails the benchmark by 0.5%, so its information ratio is −0.15. Yet Jensen's alpha is +1.48%, because a beta of 0.70 should have earned only about 11.55% in this market. The bridge again: 1.48% − 0.30 × 6.5% = −0.47%, which rounds to the reported −0.5%. So positive alpha and a negative information ratio can coexist, and this is the mechanism.
Residual risk comes out slightly above tracking error for B and C because the regression loses one extra degree of freedom in its calculation. With a beta near 1, the two are measuring almost the same thing.
Why the Two Measures Rank Managers Differently
The same four strategies produce three different league tables.
| Rank | By Jensen's alpha | By information ratio | By appraisal ratio |
|---|---|---|---|
| 1 | C | B | B |
| 2 | B | A | D |
| 3 | D | C | C |
| 4 | A | D | A |
Four forces drive these differences, and each is worth understanding on its own.
Alpha Pays in Rupees, the Ratio Speaks in Odds
On a ₹1 crore portfolio, Strategy C's alpha works out to ₹7.09 lakh over the year and Strategy B's to ₹2.28 lakh. Alpha is what shows up as money, which is why it should never be ignored.
The ratio tells you how likely you are to see that money. If we treat the active return as roughly normally distributed and assume the past pattern continues, a one-standard-deviation band for the annual gap is −0.56% to +5.16% for Strategy B, and −7.2% to +21.4% for Strategy C. On the same assumptions, B would trail its benchmark in about 21% of years, and C in about 31%. Over five years, those odds fall to about 3.7% and 13.2%. These are illustrations, not predictions, but they show what a ratio means in plain terms.
Aggression Moves Alpha but Not the Ratio
Suppose Strategy B doubled every active position relative to the benchmark. Active return would double to 4.6%, and tracking error would double to 5.72%. The information ratio would stay at 0.80. Alpha rewards turning up the dial. The ratio does not, which is why it is a better test of skill and alpha is a better test of whether the skill was deployed in useful size.
Fees Hit the Low-Risk Strategy Harder
Take an extra 2 percentage points a year of costs from B and C, and assume the drag is steady so tracking error does not change. Strategy B's active return drops to 0.3% and its information ratio from 0.80 to 0.10. Strategy C's active return drops to 5.1% and its ratio from 0.50 to 0.36.
So fees reversed the ranking. A precise but tiny edge is the most vulnerable to costs, and this is where a high information ratio on its own can mislead. Before relying on either number, check whether returns are stated after fees.
Time Tells Luck From Skill
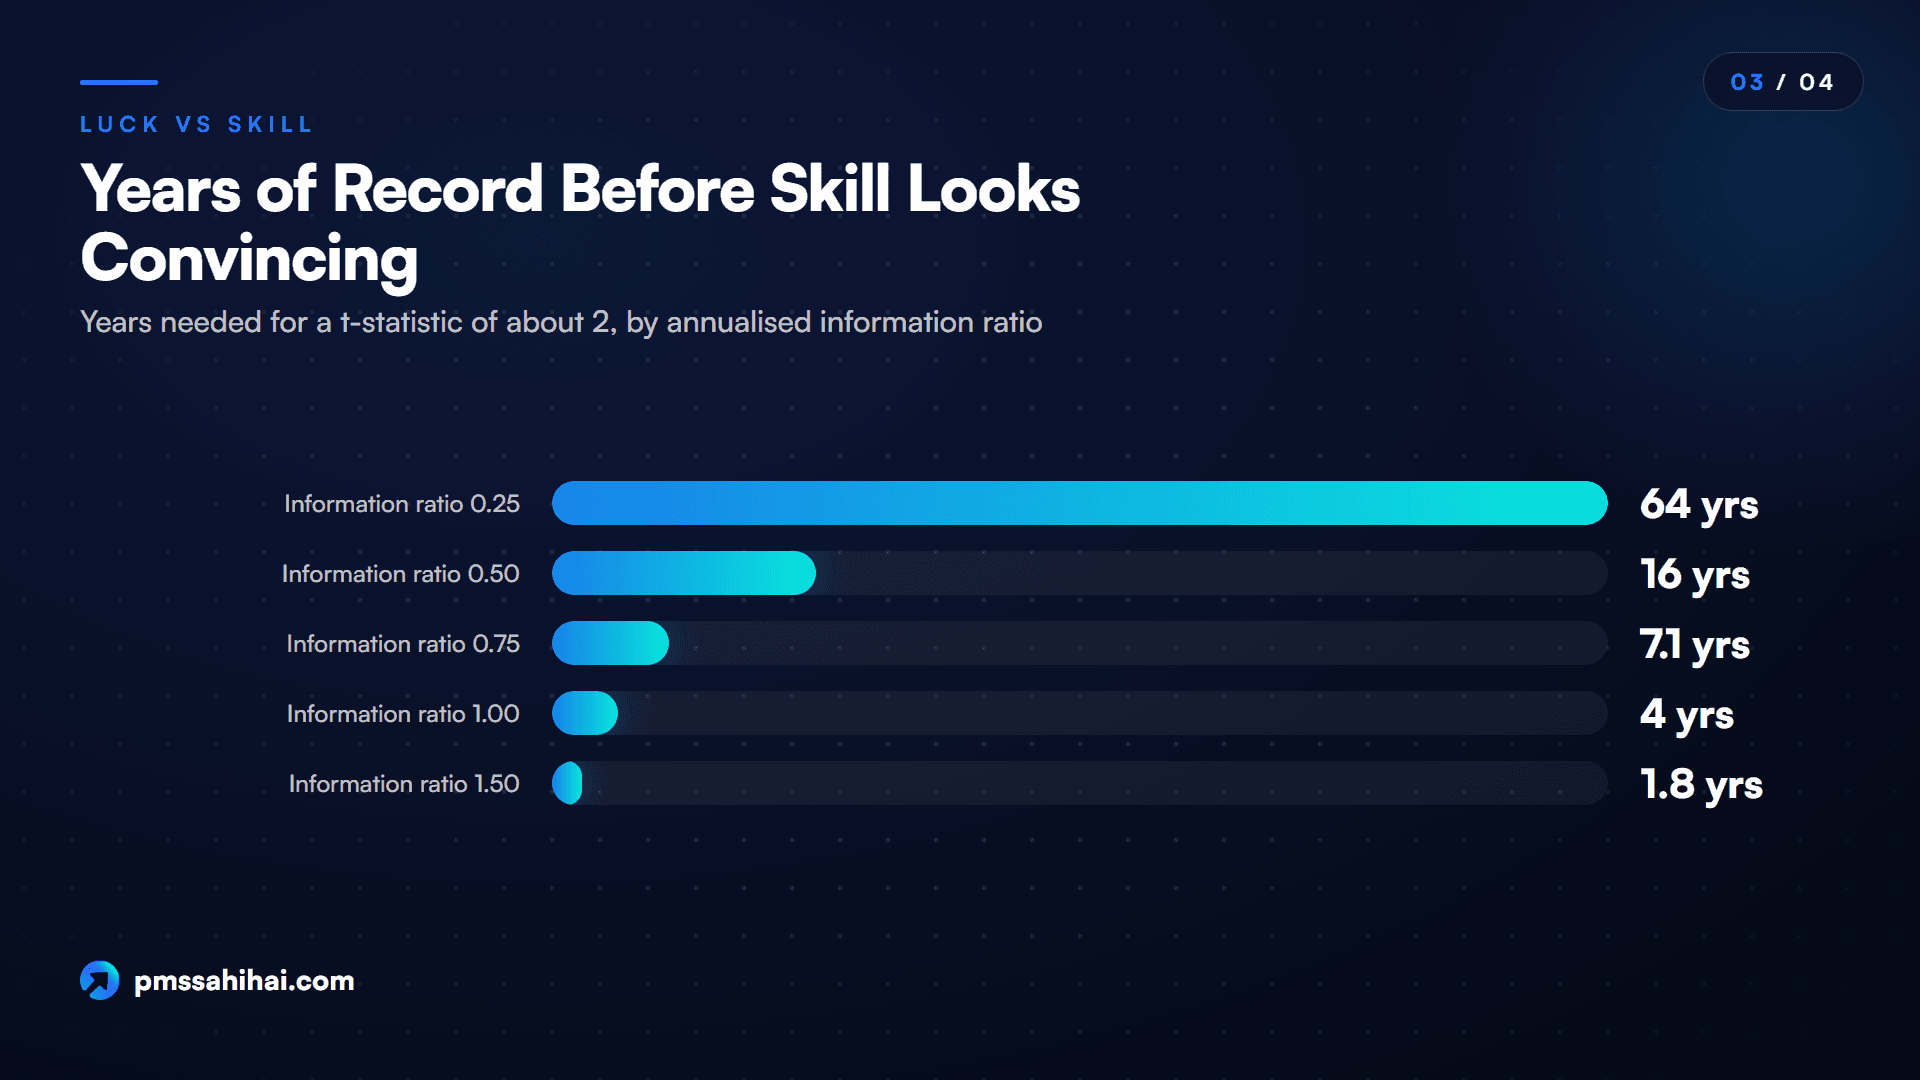
Sharpe's 1994 article notes that the t-statistic of a differential return equals the ratio times the square root of the number of periods. In annual terms, that means the t-statistic is roughly the annualised information ratio multiplied by the square root of the years. A common convention treats about 2 as the point where luck starts to look unlikely.
| Information ratio | Years for a t-statistic of 2 |
|---|---|
| 0.25 | 64 |
| 0.50 | 16 |
| 0.75 | 7.1 |
| 1.00 | 4 |
| 1.50 | 1.8 |
This table is humbling. A manager with a genuinely good ratio of 0.5 would need 16 years before the record alone was statistically convincing. In our example, the alpha t-statistics are 0.02 for A, 0.74 for B, 0.46 for C and 0.58 for D: none is close to 2, because twelve months is far too short. Alpha does not escape this problem. A large alpha with large residual risk is exactly what chance can produce.
As for what counts as good, Grinold and Kahn's figure, as reported in the Wikipedia entry citing their book, is that top-quartile managers typically achieve annualised ratios of about one-half. Rules of thumb elsewhere differ: Investopedia treats values above 0.5 as generally good, while a 2020 WealthManagement column treats 0.40 to 0.60 as worth a look. No regulator sets these lines. There is no agreed equivalent scale for alpha, because alpha has to be judged against the risk and fees involved.
How Indian Rules and Factsheets Use These Numbers Today
India now has rules that bear on both measures, though they are not symmetrical.
Mutual Funds Must Publish the Ratio
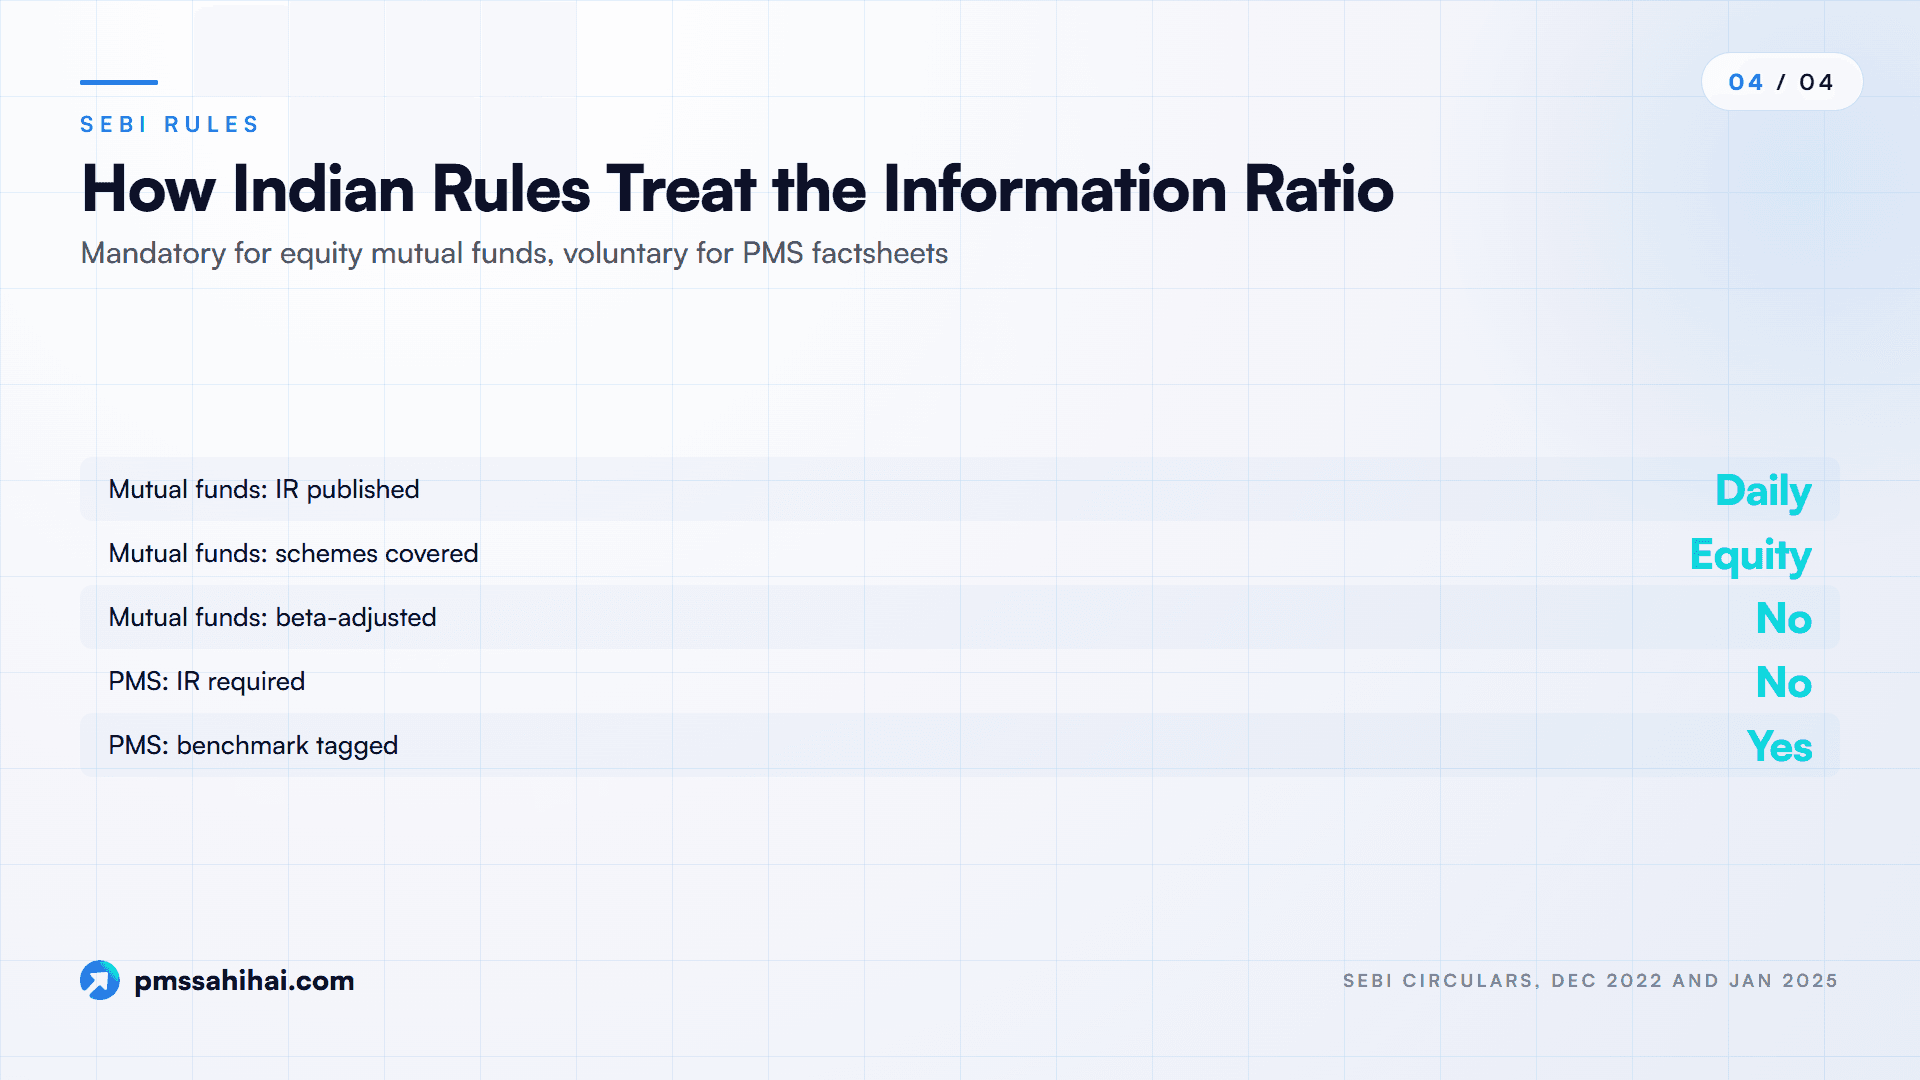
SEBI's circular of 17 January 2025 calls the information ratio a measure of risk-adjusted return, and says it "is often used as a measure of a portfolio manager's level of skill". It requires AMCs to publish it daily on their websites with their performance disclosures, for equity-oriented schemes only, within three months of the circular. AMFI must carry the data in a comparable, downloadable format. The prescribed formula is the textbook one: portfolio return less benchmark return, divided by the standard deviation of excess return, using the scheme's Tier 1 benchmark and daily return values.
Notice what that means: SEBI's mutual fund ratio uses plain active return. It is not beta-adjusted. A high-beta equity fund in a strong market benefits in exactly the way Strategy A did.
PMS Rules Standardise the Benchmark, Not the Ratio
SEBI's PMS circular of 16 December 2022, applicable from 1 April 2023, works differently. Each investment approach is tagged to one strategy (Equity, Debt, Hybrid or Multi Asset) and one benchmark from a list of up to three that APMI prescribes for that strategy. Managers must show time-weighted returns beside the benchmark's trailing return, and disclose relative performance against the benchmark and other managers. Changing the tag means the earlier record cannot be used in performance reporting.
The 2025 circular is addressed to mutual funds, and the 2022 PMS circular does not list the information ratio or Jensen's alpha among its requirements. So a PMS may show them voluntarily, with choices of its own: which benchmark, how many months, monthly or daily data, which risk-free rate. If a factsheet shows these numbers, ask for those four choices in writing.
Because the mutual fund ratio is computed from daily data on Tier 1 benchmarks, do not assume a PMS ratio computed from monthly data is directly comparable.
Platforms Often Show the Simple Version
Data services and listing sites commonly show the return-minus-benchmark gap and call it alpha. There is nothing wrong with that as a quick view, as long as you know it is active return. For a high-beta or low-beta strategy, it can differ materially from Jensen's alpha, as Strategies A and D show.
Why Reading Both Numbers Makes Selection Easier
Used together, the two measures do something neither does alone. They turn a pile of statistics into a short diagnostic.
- They separate three sources of return. Return beyond the index can come from market exposure, skill or chance. Beta and Jensen's alpha isolate the first; the ratio and record length speak to the others.
- They expose borrowed performance. A large gap over the benchmark with a small alpha, like Strategy A, shows the manager was paid for market risk you could buy cheaply.
- They reveal strategies that look worse than they are. A negative ratio with positive alpha, like Strategy D, may be a defensive strategy doing its job in a rising market.
- They convert risk into expectations. Tracking error tells you how far you might drift from the index in a normal year, so a bad patch is less likely to panic you.
- They give you better questions. "Why is your alpha so much lower than your active return?" gets a more useful answer than "Are you good?"
A simple reading grid helps:
| Jensen's alpha | Information ratio | What it usually suggests | Next question |
|---|---|---|---|
| High | High | Sizeable and steady edge, or a short lucky run | How long is the record? |
| High | Low | Large edge from few big swings | Which months and stocks drove it? |
| Low | High | Either tiny precise edge or market risk | What is the beta? What is left after fees? |
| Positive | Negative | Low beta in a rising market | How did it behave in falling markets? |
| Negative | Positive | High beta in a rising market | What happens when the market turns? |
The last row is Strategy A pushed slightly further: beta can make active return positive even when alpha is below zero.
How PMS Sahi Hai Helps You Read Alpha and Consistency Together
PMS Sahi Hai is a PMS and AIF comparison platform, and much of this comparison can start there. Here is what it offers on this subject, and what it does not.
Start with the listing. The PMS listing can be filtered by category label and by benchmark. Each strategy page shows trailing returns beside the strategy's stated benchmark, from one month to five years and since inception, with the difference shown as alpha. In the language of this article, that figure is active return, not Jensen's alpha. It is the right number for a first screen. For a strategy with a beta far from 1, treat it as the start of the analysis.
Use Nyra for the consistency question. Nyra is the platform's AI-powered research tool. Its published scoring methodology gives 30% of the Nyra Score to excess return over the stated benchmark across one, three and five years and 15% to consistency, and it needs at least 12 months of record to rate a strategy. That split echoes this article's two questions, size and dependability, though the score is not an information ratio. The methodology page describes it as "not a prediction" and "not a recommendation". You can also ask Nyra how a strategy compares with others carrying the same category label.
Know what is not there. The platform's published descriptions of strategy pages do not mention an information ratio, a tracking error or a regression-based alpha, and those pages state that their growth chart, rolling-window and risk figures are modelled and illustrative. So do not calculate a ratio from those charts. Ask the manager for monthly returns, and run the steps above yourself.
Then read the document. Our guide on how to read a PMS factsheet shows where these figures tend to sit, and the piece on evaluating a fund manager beyond returns lists what else to examine. If you also want a measure against the risk-free rate, see the Sharpe ratio explained.
Honest Limits of Alpha and the Information Ratio
Neither number is a verdict. Both have weaknesses, and some of them are shared.
Benchmark choice can decide the answer. Both measures depend on the yardstick. A small-cap strategy measured against a large-cap index can show impressive alpha that is really a size bet. Our guide to PMS benchmark selection covers how to test the fit.
Alpha depends on a model. Jensen's alpha assumes that CAPM with one market factor is a fair description of expected return. Add size, value or momentum factors, and some alpha can disappear. The estimate also moves with the risk-free rate and the sample period.
Beta is an estimate. In a concentrated portfolio, beta can shift through the year as holdings change. A single regression number hides that.
Near-zero tracking error breaks the ratio. With a tiny denominator, the ratio can look spectacular or collapse on small changes, a problem seen in closet indexing. High values on low tracking error deserve suspicion rather than applause.
Standard deviation treats good and bad surprises alike. Tracking error penalises large positive gaps just as it does large negative ones. Strategy C's best month hurts its ratio. Investors may not experience it that way.
Arithmetic returns and leverage can distort the sign. Critics note that using arithmetic returns and ignoring leverage can turn the ratio negative for a manager who did produce alpha. Strategy D reaches a similar outcome by a different route, its low beta.
Short records say little. CFA Institute's curriculum warns that appraisal ratios "must be used with care" and that they rely on return data that are "often limited and subject to error". PMS track records are often short, and the 2020 WealthManagement column noted that Morningstar publishes alpha only after 36 months of monthly data. Investopedia suggests at least three years for the ratio. Both are minimums, not proof.
Survivors look better. Closed or merged strategies drop out of the comparison set, so any peer group of survivors flatters the typical manager. Compare a strategy's rank within its peers with some scepticism.
Past edges fade. Both numbers describe what already happened. A manager's assets, team and market conditions can all change.
Which Number to Check First When Choosing a Manager
The information ratio vs alpha question has a practical answer: check them in order, not in competition.
Start with the benchmark, because every later number depends on it. Then look at beta. If it is far from 1, stop using the gap over the benchmark as a measure of skill and go to Jensen's alpha. Next, ask whether the alpha is large enough to matter after fees and tax. If it is, turn to the information ratio or appraisal ratio to see how steadily it arrived. Finally, look at the record length, and use the t-statistic table to temper your confidence.
If you can only ask for one thing, ask for all of these on the same benchmark and period. Numbers taken from different windows cannot be compared, however precise they look. PMS Sahi Hai's listing and Nyra can give you the shortlist; the manager's own monthly returns give you the rest.
Treat this article as education, not as advice to buy or sell any product. For a decision on your own portfolio, speak to a SEBI-registered adviser.
Compare PMS Strategies on More Than a Headline Return
A big return is where a good conversation starts, not where it ends. Ask for the benchmark, beta, alpha, tracking error and record length, all on the same window. Then compare strategies side by side on PMS Sahi Hai, ask Nyra how a strategy sits among its peers, and put the same questions to each manager. If you already hold a PMS, the portfolio health check takes a holdings list and returns a Nyra Score. To talk through a shortlist, book a consultation with the team.
PMS Sahi Hai is a distributor of Portfolio Management Services and Alternative Investment Funds, APMI-registered (Registration No. APRN08358). This article is for education only and is not investment advice, a recommendation, or an offer to buy or sell any security. Investments in securities markets are subject to market risks; read all scheme-related documents carefully. Past performance is not indicative of future results. Consult your advisor before investing.
Ishaan founded PMS Sahi Hai to make India's PMS, AIF and GIFT City markets legible to serious investors, comparing every SEBI-registered manager on the same comparative basis, with no shelf products and no commission bias.
Frequently asked
What is the difference between the information ratio and alpha?
Alpha measures how much return a manager added, in percentage points. The information ratio measures how much was added for each unit of tracking error, so it has no units. Alpha shows the size of an edge and the ratio shows its reliability. A manager can score well on one and poorly on the other, so you should read both on the same benchmark and period.
Can alpha be positive when the information ratio is negative?
Yes. Jensen's alpha adjusts for beta and the standard information ratio does not. A low-beta strategy in a rising market may trail its benchmark while beating what its market exposure predicted. In our example, a strategy with a beta of 0.70 has alpha of +1.48% and an information ratio of −0.15. This pattern can reverse when markets fall.
Which is better, alpha or the information ratio?
Neither is better in general, because they answer different questions. Use alpha to judge whether the edge is big enough to matter after fees. Use the information ratio to judge how consistently it arrived. A high ratio on a tiny edge can vanish after costs, and a large alpha with heavy swings can be luck. Check both together.
Is alpha the same as active return?
Not strictly. Active return is the plain gap between portfolio and benchmark. Jensen's alpha also removes the return expected from beta. They match when beta is 1. Many websites label active return as alpha, so a high-beta strategy in a bull market can seem to show more skill than it has. Check how a figure was calculated before comparing it.
Is the information ratio simply alpha divided by tracking error?
It depends on the definition. The standard version divides active return by tracking error, and SEBI's mutual fund formula follows it. If the numerator is Jensen's alpha and the denominator is residual risk, the correct name is the appraisal ratio, though some writers call that an information ratio too. The two match closely only when beta is near 1.
What is a good information ratio for a PMS?
There is no official threshold. Grinold and Kahn, as cited on Wikipedia, put top-quartile managers at about 0.5 a year, and Investopedia also treats values above 0.5 as generally good. Very high values over short periods or with tiny tracking error deserve suspicion. For a concentrated PMS, also look at record length, fees and whether the benchmark suits the strategy.
Does SEBI require a PMS to disclose the information ratio?
SEBI's January 2025 circular requiring daily information ratio disclosure is addressed to mutual funds and covers equity-oriented schemes. SEBI's December 2022 PMS circular instead requires time-weighted returns beside a prescribed benchmark and relative performance, and does not list the ratio. If a PMS shows it voluntarily, ask which benchmark, period, data frequency and calculation method were used.
How long a record do you need to trust alpha?
Longer than most investors expect. The t-statistic is roughly the annualised information ratio times the square root of the years, and a common convention looks for about 2. At a ratio of 0.5, that takes 16 years; at 1.0, four years. A short record can suggest skill, but it can rarely prove it, whatever the size of the alpha.
Does PMS Sahi Hai show the information ratio for a strategy?
The platform's published descriptions of strategy pages cover trailing returns beside a stated benchmark, with the difference shown as alpha, which is active return in this article's terms. They do not mention an information ratio. Nyra's published methodology does score excess return and consistency. For an actual ratio, ask the manager for monthly returns and calculate it on the same benchmark.
Keep reading
All articles
Portfolio Manager vs Fund Manager vs Wealth Manager: Who Does What
Portfolio manager, fund manager or wealth manager? Their SEBI licences, duties and pay in India, and how to check which one is handling your money.

Private Banker vs Financial Product Distributor: Which Do You Have?
Private banker or distributor? Compare APMI and AMFI registration, legal duty and cost in India, and run seven checks to see who you are dealing with.
Asset Management vs Portfolio Management: AMC and PMS Explained
How AMCs and PMS firms differ in India: SEBI licences, net worth rules, scale, fees and pooled vs individual portfolios, with 2026 data.
Read it. Now pressure-test it.
Ask Nyra how this applies to your portfolio, or talk to our team, no pitch, no pressure.