
Information Ratio vs Sharpe Ratio: Which One to Trust, and When
Information ratio vs Sharpe ratio: benchmark-relative vs risk-free-relative, when each misleads, and how PMS investors should read both together.

The Sharpe ratio asks whether a portfolio paid you enough for its total ups and downs compared with a risk-free rate. The information ratio asks whether a manager beat a chosen benchmark steadily, compared with how far the portfolio strayed from it. The two can point in opposite directions: in our worked example, one strategy matches its benchmark's return exactly, scores an information ratio of 0.00, yet has more than twice the benchmark's Sharpe ratio. Use Sharpe to judge the portfolio you would own and the information ratio to judge the manager you would pay, and distrust either one over a short window or against the wrong benchmark. SEBI requires daily information ratio disclosure for equity-oriented mutual funds, but the current PMS master circular requires neither ratio, so PMS investors often have to ask or calculate.
Why Two Good Ratios Can Disagree About One Fund
Suppose a portfolio manager shows you two numbers on the same page: a Sharpe ratio of 1.02 and an information ratio of 0.00. One looks strong and the other looks like no skill at all. Neither number is wrong. They are answers to two different questions, and the debate about information ratio vs Sharpe ratio only makes sense once you know which question you are asking.
The Sharpe ratio asks an absolute question: for every unit of volatility I lived through, how much did I earn above a safe alternative? The information ratio asks a relative question: for every unit of deviation from the benchmark, how much did the manager add over that benchmark?
That single change of reference point moves both the top and the bottom of the fraction. The top switches from return over a risk-free rate to return over an index. The bottom switches from total volatility to tracking error. So the two ratios respond to different things, and they can rank the same two strategies in opposite order.
This matters most for investors in a Portfolio Management Service (PMS). PMS portfolios are often concentrated and differ sharply from any index, which means both the Sharpe ratio and the benchmark-relative return can look very different from what a broad mutual fund shows. If you need a full primer on Sharpe alone, our Sharpe ratio explainer covers it in depth. This article stays on the comparison: what separates the two, when each misleads, and how to use them together. Every example below is hypothetical and was recomputed in Python; no figure describes a real fund.
How the Sharpe Ratio and Information Ratio Evolved
The two ratios are closer relatives than most comparison tables suggest. In fact, you can reasonably describe one as a special case of the other.
The earliest ancestor is Andrew Roy's 1952 work, which proposed maximising a similar ratio against a minimum acceptable return. In 1966, William Sharpe proposed his measure to evaluate mutual funds and called it the "reward-to-variability ratio". That name never caught on, and others began calling it the Sharpe ratio.
In 1994, Sharpe restated the measure in a paper that is still the clearest source on the subject. He built it on a differential return: the fund's return minus a benchmark's return. In the original version that benchmark was a riskless security. But he noted that later applications used style-matched benchmarks instead. He also recorded that authors associated with BARRA used the term "information ratio" for this differential-return version, and treated it as equivalent.
So the information ratio is not a rival invention. It is the same fraction, pointed at a risky benchmark instead of a safe one. Wikipedia's entry on the Sharpe ratio describes it as a generalisation in just those terms.
Later research focused on using the ratios properly. Thomas Goodwin's 1998 paper in the Financial Analysts Journal noted that confusion persisted over how to calculate an information ratio, how to interpret it and what makes a good one. Andrew Lo's 2002 paper in the same journal showed how much the statistics of Sharpe ratios depend on the behaviour of returns.
India reached the regulatory stage more recently. SEBI's benchmarking circular for portfolio managers is dated 16 December 2022, and APMI's implementing circular applied it from 1 April 2023. SEBI's mandate for information ratio disclosure by equity-oriented mutual funds followed on 17 January 2025.
The Two Formulas Compared Input by Input
Here are both formulas in plain text:
Sharpe ratio = (portfolio return − risk-free rate) ÷ standard deviation of those excess returns
Information ratio = (portfolio return − benchmark return) ÷ tracking error
Tracking error is simply the standard deviation of the gap between portfolio and benchmark returns. That gap is usually called the active return. The table below sets out the difference between Sharpe ratio and information ratio, input by input.
| Input | Sharpe ratio | Information ratio |
|---|---|---|
| Reference point | Risk-free rate | Chosen market benchmark |
| Top of the fraction | Excess return over cash-like assets | Active return over the index |
| Bottom of the fraction | Total volatility | Tracking error (active risk) |
| Question answered | Was the total risk worth taking? | Did active decisions add value steadily? |
| Market falls 20%, fund falls 15% | Usually negative | Can be strongly positive |
| Index-like fund | Close to the index's own Sharpe | Unstable, because tracking error is tiny |
| Main input dispute | Which risk-free rate | Which benchmark |
Why the Risk-Free Rate Is a Small Dispute
The risk-free rate sets how much return counts as a reward. In India it is usually a government security yield of comparable tenure, though practice varies. The good news is that this choice rarely changes the conclusion. Take a strategy earning 18% with 16% volatility. At a risk-free rate of 5.5%, 6.5% and 7.5%, its Sharpe ratio is 0.78, 0.72 and 0.66. The ranking of two strategies seldom flips on this, as long as both are measured at the same rate. The rate used throughout this article is an assumed 6.5%, not a quoted current yield.
Why Tracking Error Is a Bigger Dispute
Tracking error, also called active risk, measures how far returns stray from the benchmark. An index fund aims for almost none; an active manager takes it on deliberately. It cannot be read without knowing the benchmark, so changing the benchmark changes both the top and the bottom of the information ratio. Tracking error is also not the same as volatility. A portfolio can be calmer than the market and still have high tracking error, simply because it behaves differently. Strategy B below is exactly that case.
One Worked Example Using Twelve Months of Returns
The fastest way to see the Sharpe ratio vs information ratio split is to run both on one data set. Below are twelve months of hypothetical returns for a benchmark and two strategies.
| Month | Benchmark (%) | Strategy A (%) | Strategy B (%) |
|---|---|---|---|
| 1 | 3.2 | 4.5 | 1.9 |
| 2 | -2.4 | -3.1 | 0.4 |
| 3 | 4.1 | 4.9 | 1.1 |
| 4 | 1.8 | 0.9 | 2.4 |
| 5 | -5.6 | -5.0 | -2.2 |
| 6 | 2.9 | 3.8 | 1.6 |
| 7 | 3.7 | 2.9 | 2.8 |
| 8 | -1.2 | -0.2 | 0.2 |
| 9 | 2.2 | 1.6 | 1.3 |
| 10 | -3.4 | -3.0 | -1.1 |
| 11 | 5.0 | 6.3 | 2.6 |
| 12 | 1.5 | 1.3 | 0.8 |
The method: take monthly returns, subtract the monthly risk-free rate (6.5% ÷ 12) for Sharpe and the benchmark for the information ratio, then divide the average by the sample standard deviation. Multiply by the square root of 12 to annualise. Means here are the simple average times 12, so they differ slightly from compounded returns.
| Measure | Benchmark | Strategy A | Strategy B |
|---|---|---|---|
| Average annual return | 11.80% | 14.90% | 11.80% |
| Volatility | 11.58% | 12.23% | 5.19% |
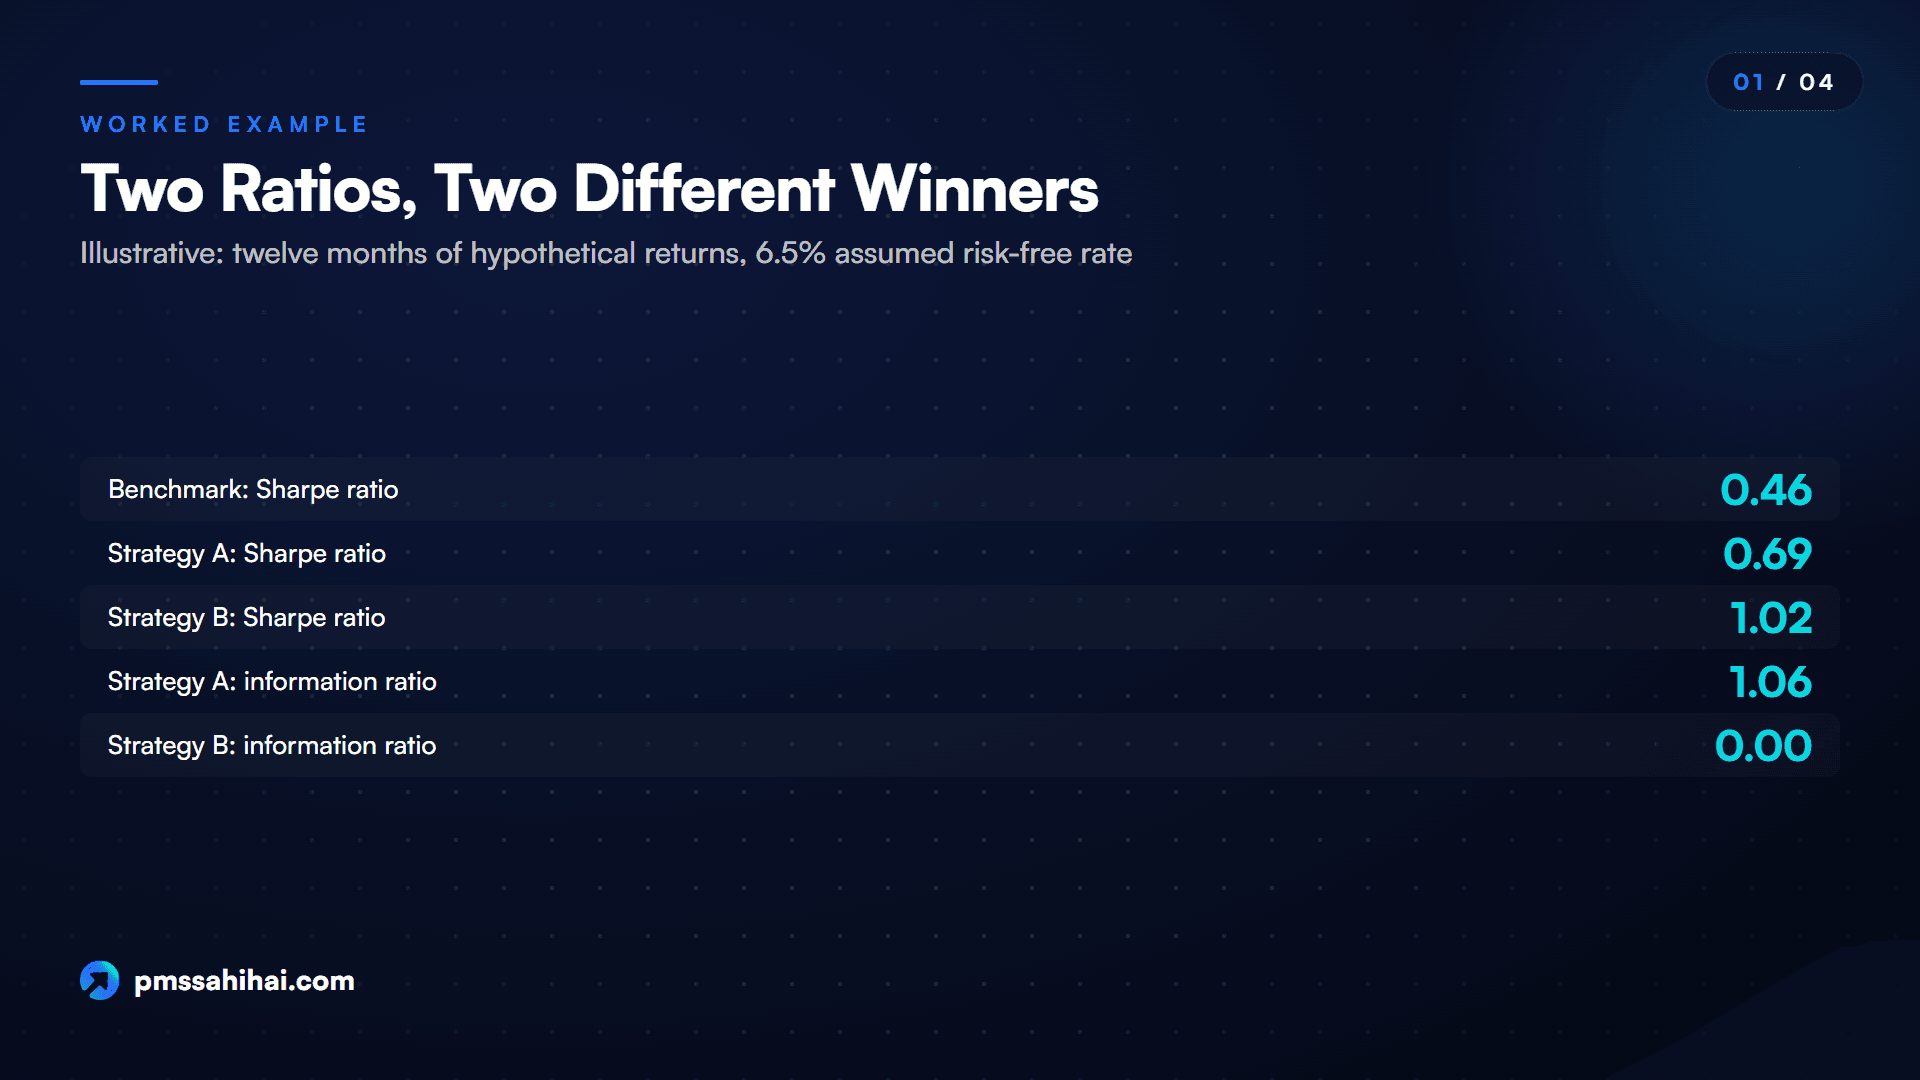
| Sharpe ratio | 0.46 | 0.69 | 1.02 |
| Active return | n/a | 3.10% | 0.00% |
| Tracking error | n/a | 2.93% | 7.18% |
| Information ratio | n/a | 1.06 | 0.00 |
| Months ahead of benchmark | n/a | 7 of 12 | 5 of 12 |
What the Two Rankings Tell You
The information ratio prefers Strategy A, and the Sharpe ratio prefers Strategy B. Both are right.
Strategy A stays close to the index and adds a modest edge, so it scores 1.06 on the benchmark-relative test. Its total risk is about the market's, so its Sharpe ratio improves on the index, but not dramatically. Choose A if you already want equity market exposure and are paying a manager to improve on it.
Strategy B earned exactly the benchmark's return with less than half the volatility (a beta of about 0.41). The information ratio gives it zero credit for this, because it measures only return above the index, and B's return gap swings widely month to month. Sharpe rewards it fully. Choose B if the smoothness of the whole portfolio matters more than beating an index.
Neither result proves skill. Twelve months is far too short, and a later section shows why. Use the table as a demonstration of the mechanics, not as a guide to how long to look.
When the Sharpe Ratio Misleads Investors
The Sharpe ratio is the better measure of total experience, but it has distinct blind spots.
A rising market flatters everyone. Say a strategy returns 28% with 14% volatility while its benchmark returns 32%, with 6% tracking error. Its Sharpe ratio is 1.54, which looks excellent. Its information ratio is -0.67, because it trailed the index. Sharpe alone cannot tell you that a cheap index exposure would have done better.
Smooth pricing can manufacture a high score. Volatility is measured from reported values. If stale or infrequent pricing makes a portfolio look calmer than it is, Sharpe rises with no change in real risk. Take a 14% return: at a true volatility of 20% the Sharpe ratio is 0.38, but at a reported 12% it becomes 0.63. This matters for illiquid holdings, and Wikipedia's entry on the ratio notes that smoothing and discretionary pricing of illiquid assets open the ratio to manipulation. Lo's research found serial correlation could overstate annual Sharpe ratios of hedge funds by more than 65%, and that the common root-12 scaling holds only under special conditions.
Tail risk is invisible until it arrives. Strategies that collect small, regular gains while carrying a rare large loss can show high Sharpe ratios right up to the loss. Standard deviation treats a quiet record as low risk, whatever is hiding underneath. Our comparison of Sharpe and Sortino covers the downside angle further.
Negative readings rank backwards. With excess return of -5%, a fund with 10% volatility scores -0.50 and one with 20% volatility scores -0.25. The riskier fund looks better. So do not rank funds on Sharpe in a period when their excess returns are negative.
It ignores what else you own. As Sharpe himself wrote, the measure "does not take correlations into account". A diversifying strategy with a mediocre standalone Sharpe may improve your total portfolio more than a higher-scoring one that duplicates what you already hold.
When the Information Ratio Misleads Investors
The information ratio is the sharper tool for judging a manager, but it has failure modes that are less widely discussed.
You can lose money with a superb score. A strategy falls 12% while its benchmark falls 18%, with 4% tracking error and 20% volatility. Its information ratio is +1.50. Its Sharpe ratio is -0.93. The manager did well relative to the mandate, but you still lost 12% of your money. Whether that is a success depends on why you hired them.
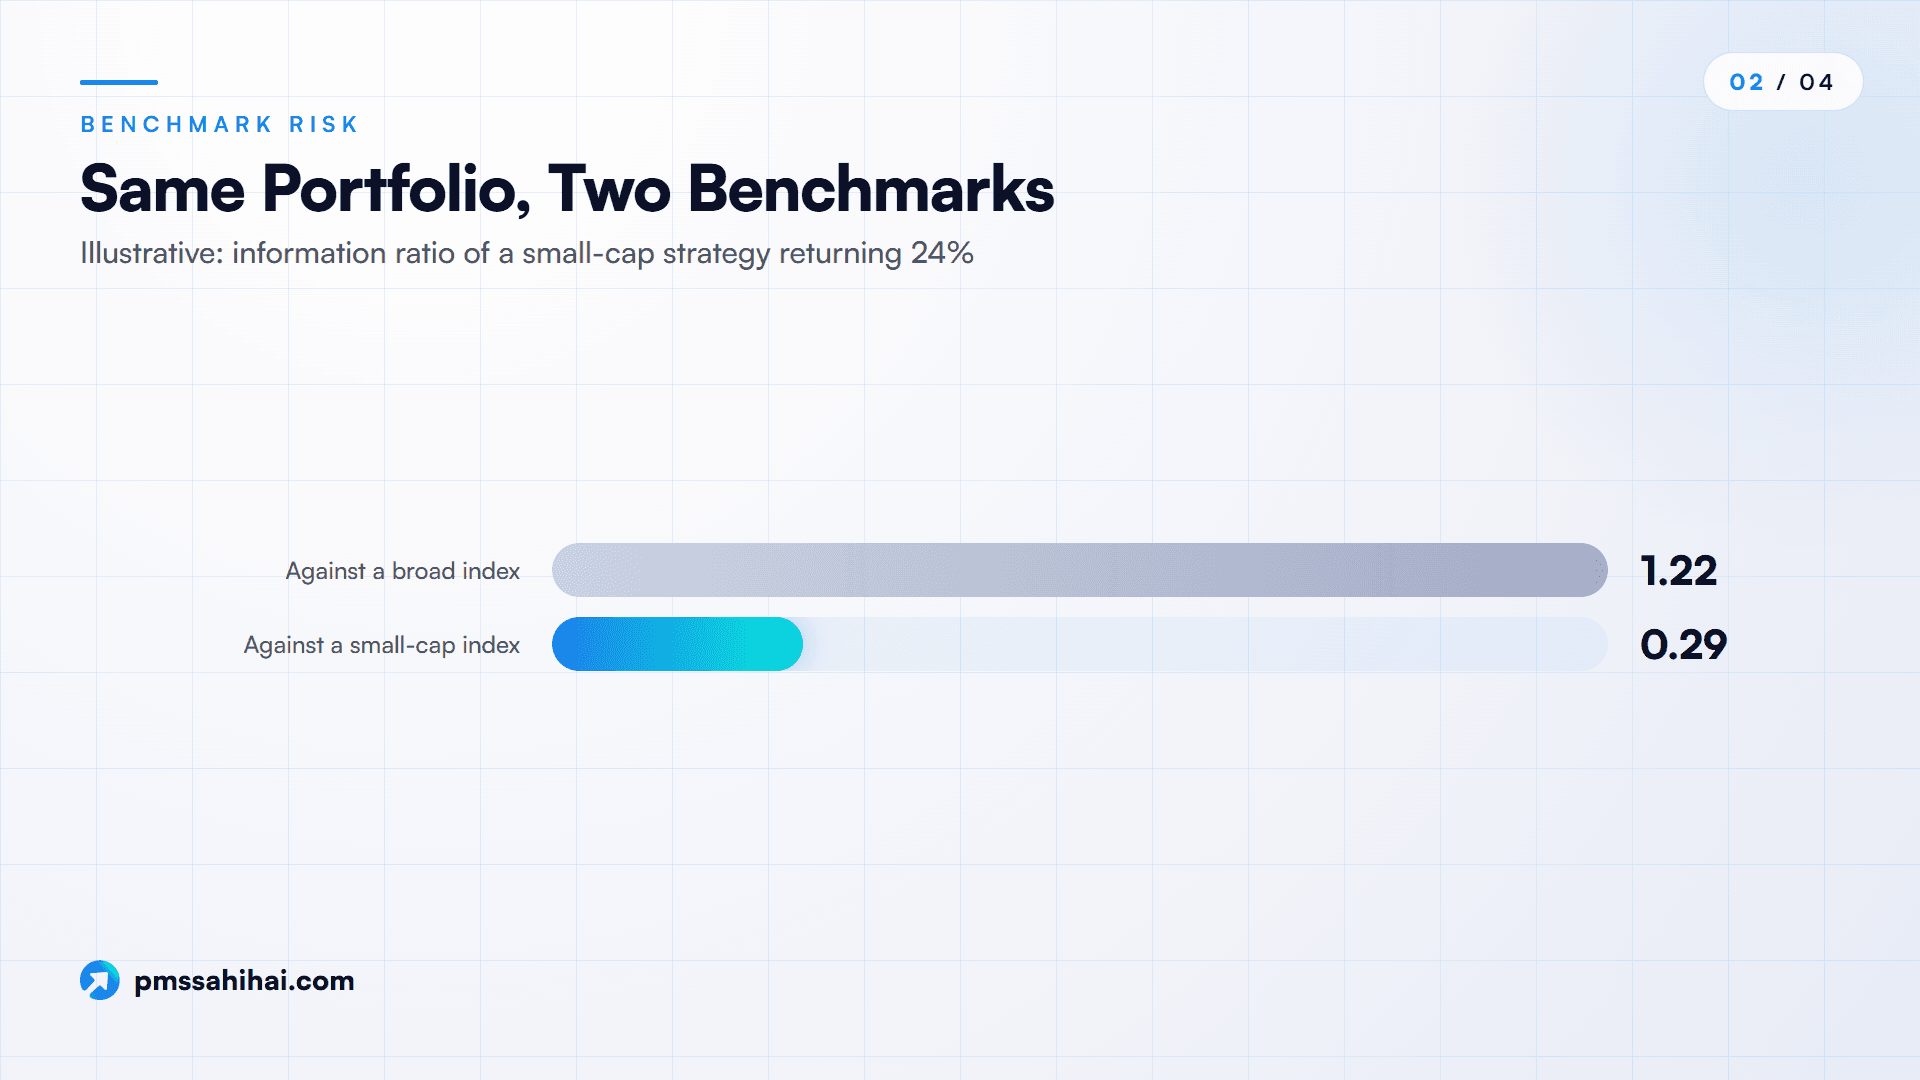
The wrong benchmark can invent skill. This is the largest risk, because benchmark-relative return is only as honest as the benchmark. Take a small-cap strategy returning 24%. Against a broad index returning 13%, with 9% tracking error, its information ratio is 1.22. Against a small-cap index returning 22%, with 7% tracking error, it is 0.29. Same portfolio, same manager, and a very different story. Much of the apparent skill was exposure to smaller companies.
A price index in place of a total return index flatters the result. A price index leaves out dividends. If those are worth 1.2 points a year and tracking error is 6%, the information ratio is overstated by 0.20. APMI's circular specifies total return indices for PMS equity benchmarks, so check that the ratio you are shown used one too.
Cash hurts the score but not always the investor. Take a strategy returning 18% with 16% volatility, against a benchmark returning 14% with 15% volatility and a correlation of 0.85. Tracking error is 8.54%, the information ratio is 0.47 and the Sharpe ratio is 0.72. Now hold 25% in cash earning the 6.5% risk-free rate. Return falls to 15.13%, volatility to 12%, and tracking error to 7.94%. The Sharpe ratio stays at 0.72, because mixing with a riskless asset cuts reward and risk in equal proportion. The information ratio collapses to 0.14. In a falling market the same cash would lift the information ratio. So a manager's cash call moves one ratio and not the other. Ask how much cash the strategy held during the period.
It ignores the size of the bet. A manager adding 0.6% with 1% tracking error and one adding 3% with 5% tracking error both score 0.60. After fees, those are very different investments. A very low tracking error also makes the ratio unstable, since a small denominator amplifies small differences. This is why closet indexing can produce a respectable-looking number with almost no real value added.
Fees eat it faster than they eat Sharpe. A 2.5-point annual fee takes a 4% gross active return with 6% tracking error from an information ratio of 0.67 to 0.25. The same fee takes a Sharpe ratio from 0.72 to 0.56 in the 18% strategy above. Active return is a thin slice, so costs bite proportionately harder. Always ask whether the ratio is gross or net.
Which Ratio Fits Which Investing Decision
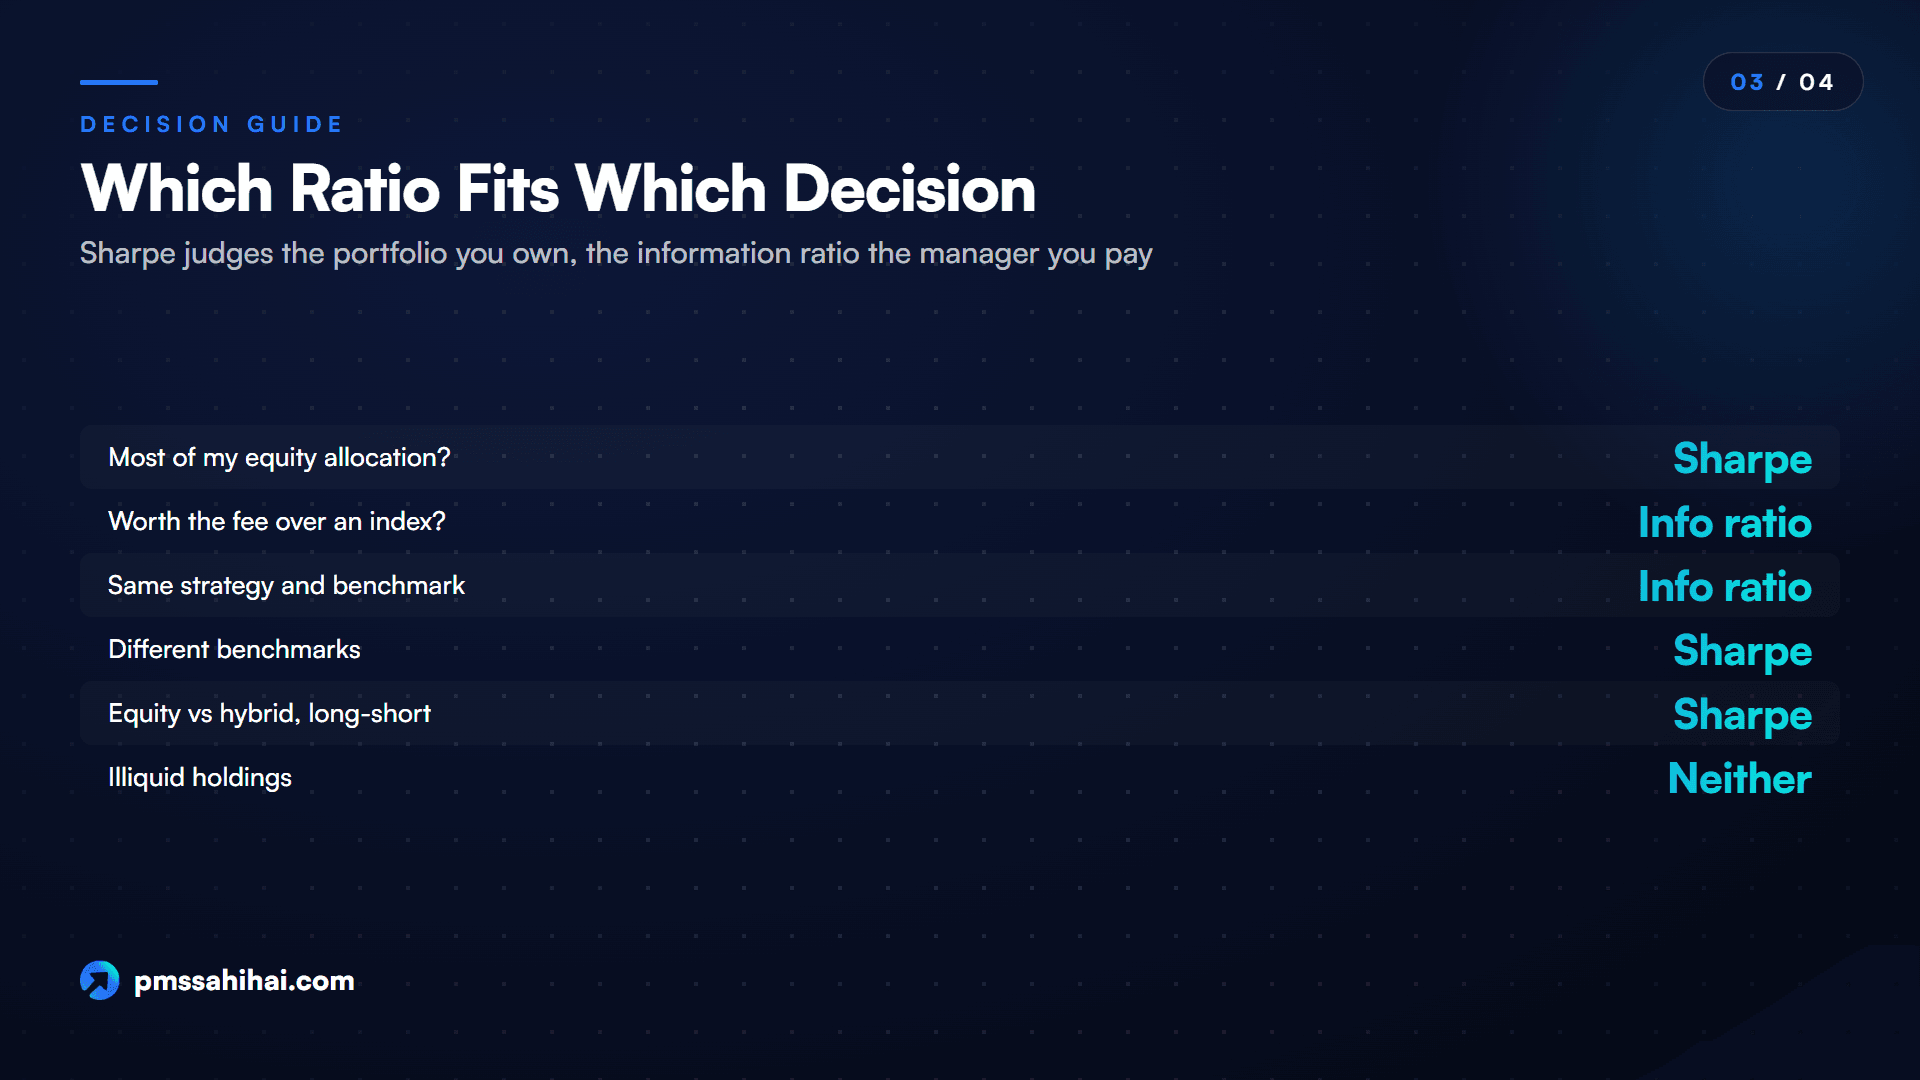
Neither ratio wins the information ratio vs Sharpe ratio contest in general; each fits a particular decision. Sharpe's strength is the whole portfolio, and the information ratio's is the single mandate. As the CFA Institute's curriculum puts it, Sharpe measures reward per unit of risk in absolute returns, and the information ratio does so in benchmark-relative returns.
| Decision | Lead with | Why |
|---|---|---|
| Should this be most of my equity allocation? | Sharpe ratio | You will live with its total swings |
| Is this manager worth the fee over an index? | Information ratio | The index is your real alternative |
| Two managers, same strategy, same benchmark | Information ratio | The benchmark is a fair common yardstick |
| Two strategies with different benchmarks | Sharpe ratio | Information ratios are not comparable across benchmarks |
| Comparing equity with hybrid or long-short | Sharpe ratio | A single equity index is a poor yardstick for all |
| Illiquid or infrequently priced holdings | Neither alone | Both inherit the smoothing problem |
How Indian Mutual Funds and PMS Use These Ratios
The regulatory position differs between the two, and it decides how much work you have to do yourself.
Mutual Funds Have a Uniform Information Ratio Rule
SEBI's circular of 17 January 2025 tells mutual funds to disclose the information ratio of equity-oriented schemes on their websites every day, alongside performance. AMFI must make it available in a comparable, downloadable, machine-readable format. The formula is set: portfolio return less benchmark return, divided by the standard deviation of excess return. It uses the scheme's Tier 1 benchmark and daily return values. SEBI's stated reason is that the ratio is often used to gauge a portfolio manager's skill and consistency. The same circular does not apply to debt schemes.
PMS Investors Get Benchmarks, Not Ratios
For PMS, SEBI's framework gives you the raw material. Under the December 2022 circular, each investment approach is tagged to one strategy (equity, debt, hybrid or multi-asset). APMI prescribes up to three benchmarks per strategy, and the manager selects one. Performance communicated publicly must show time-weighted return (TWRR) along with the benchmark's trailing return. To an investor, the manager also reports XIRR. A manager who changes the tagging must offer an exit without exit load, and cannot use the earlier track record.
Three practical points follow.
- The ratios are not mandated. A text search of SEBI's Master Circular for Portfolio Managers of 16 July 2025 finds no use of "Sharpe", "information ratio", "tracking error" or "standard deviation". Any figures you see are the manager's or a third party's calculation, so ask about the method.
- The published benchmark may be a broad one. Many equity strategies report against a broad index. In our own review of PMS records, 546 were benchmarked to the BSE 500 TRI or the Nifty 50 TRI. That is fair for a diversified mandate but generous to a small-cap strategy. Since an October 2024 SEBI letter, managers may optionally add one secondary benchmark from a set list. Where one exists, calculate on it too.
- Numbers are not automatically comparable with mutual funds. The mutual fund formula uses daily data, while a PMS figure may use monthly data. A published figure also describes the investment approach, not your account, and your XIRR will differ. Reported performance should be net of fees and expenses under the master circular, so check whether the number you see is.
SEBI's monthly PMS reports can be pulled by manager, year and month, with Excel and XML downloads. The SEBI (Portfolio Managers) Regulations, 2026 take effect on 1 April 2027; until then the 2020 Regulations and the master circular apply, so recheck these points after that date.
What Counts as a Good Reading on Each Ratio
Be wary of any fixed scale, and note that no regulator sets one. Goodwin's paper exists because what counts as "good" has long been unclear.
For the information ratio, Wikipedia's entry states that top-quartile managers typically achieve annualised readings of about one-half. Indian retail explainers commonly call 0.5 good and 1.0 very strong, but they usually give no source. Treat those as rough starting points.
For the Sharpe ratio, the most meaningful comparison is the benchmark's own Sharpe ratio over the same period. In our example, the 0.69 on Strategy A means little until you see the benchmark's 0.46. Fixed cut-offs such as "above 1 is good" vary with the market period: almost everything clears them in a rally.
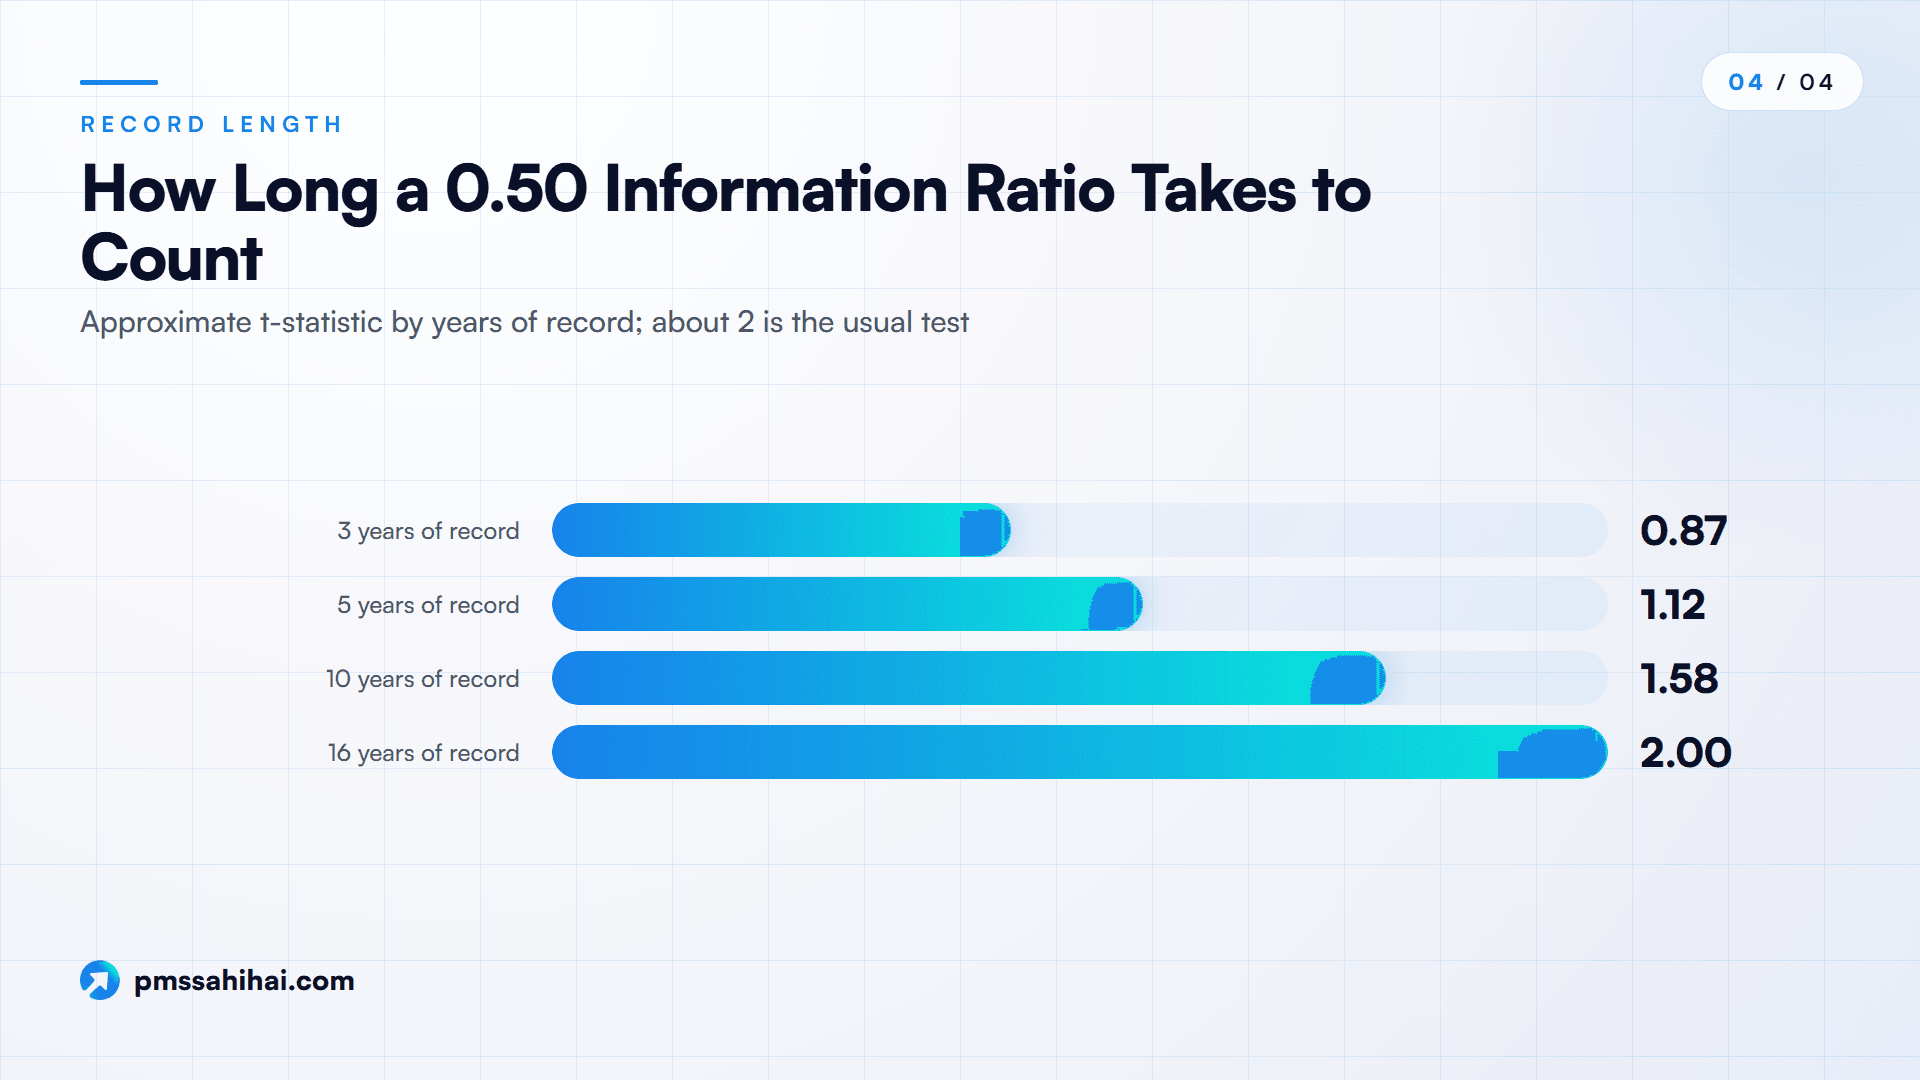
The more useful question is how much data supports the number. An information ratio's t-statistic is approximately the annual ratio times the square root of the number of years. That is the relationship Goodwin's paper examines, and the same form applies to Sharpe. A common rough test for statistical confidence is a t-statistic of about 2.
| Annual information ratio | Years of data | t-statistic |
|---|---|---|
| 0.50 | 3 | 0.87 |
| 0.50 | 5 | 1.12 |
| 0.50 | 10 | 1.58 |
| 0.50 | 16 | 2.00 |
| 1.00 | 4 | 2.00 |
Read that table carefully. A manager with a top-quartile reading of 0.5 needs about 16 years of record before the result clears the usual test. Many PMS strategies do not have that, so a three-year information ratio is a hint rather than proof. Strategy A's 1.06 over one year has a t-statistic of just 1.06.
Period and frequency matter too. Sharpe recommended short measurement periods such as monthly for information content, annualised for comparison. A monthly ratio of 0.15 annualises to 0.52, so check you are comparing annual figures with annual figures.
Advantages of Reading Both Ratios Together
Each ratio covers the other's main weakness, which makes the pair more useful than either alone.
- It separates the portfolio from the manager. Sharpe judges the ride; the information ratio judges the driver. A strong reading on both is a stronger case than either one alone.
- It exposes bull-market flattery. A high Sharpe ratio with a negative information ratio says the market did the work.
- It exposes "good loser" records. A high information ratio with a negative Sharpe ratio says the manager beat a falling index, but you lost money.
- It flags benchmark games. A high information ratio with an unremarkable Sharpe ratio suggests checking whether the benchmark is too easy.
- It reveals defensive value. A strategy with a low information ratio and a high Sharpe ratio, like Strategy B, may be a useful diversifier even though it would never win a benchmark race.
Taken together, four quick readings cover most situations.
| Sharpe | Information ratio | Likely reading | Next question |
|---|---|---|---|
| High | High | Good portfolio, manager added value | Is the record long enough? |
| High | Low or negative | Market or low risk did the work | Would an index or a calmer fund do? |
| Low or negative | High | Beat a poor market, or an easy benchmark | Is the benchmark right? Could I bear the loss? |
| Low or negative | Low or negative | Neither test passed | Why stay invested? |
How PMS Sahi Hai Helps You Read Both Ratios in Context
Ratios only help when the inputs beside them are clear, and that is the practical problem PMS Sahi Hai is built around: putting strategy facts on one basis so you can ask better questions.
- Line strategies up on one page. The compare page lets you shortlist up to four PMS, AIF or GIFT City strategies and view them side by side, including returns and risk measures. Strategy pages show the benchmark, so you can start with the check this article puts first: is this the right yardstick?
- Check what a score does and does not cover. Nyra, PMS Sahi Hai's AI research tool, rates strategies from 0 to 10 across five pillars under a published scoring methodology: return performance, risk-adjusted return, downside protection, consistency, and structure and stewardship. Strategies with under 12 months of track record show as "Not Rated". The score is backward-looking, so use it as a filter and not as a verdict.
- Ask about the method. You can ask Nyra to explain how a ratio works or what a term in a document means. Nyra describes itself as an analytical tool, not a SEBI-registered investment adviser, so treat its output as information to check.
- Go deeper on the inputs. Our guides cover the Sharpe ratio in full, picking a fair PMS benchmark, alpha and beta in PMS and reading a PMS factsheet.
One plain limit: we could not confirm that the platform displays an information ratio for each strategy. Where a page does not show it, take the benchmark and return data to the manager and ask for the calculation, or work it out from monthly returns as shown above.
Honest Limits Both Ratios Share
Reading both ratios still leaves real gaps, and a responsible comparison should say so.
Both look backward. Sharpe himself wrote that using unadjusted historic ratios as forecasts is "subject to serious question". Managers change, styles drift and market regimes shift.
Both assume volatility describes risk. Standard deviation counts a big upside surprise and a big downside surprise the same way. Financial returns are often not normally distributed, so skew and fat tails can hide real danger. Tracking error has the same symmetry: an unusually large month of outperformance raises it and lowers the information ratio.
Neither reflects your own account. Entry date, additional flows, your fee slab and taxes all shape your actual result. Both ratios describe the investment approach, usually before tax.
Neither measures concentration, liquidity or stewardship. A portfolio can post fine ratios while holding a few illiquid stocks that would be hard to sell in a crisis, so these numbers need to sit beside a reading of the holdings and the manager's process.
Neither fixes bad inputs. Short windows, a mismatched benchmark or gross returns compared with net will produce a precise-looking, wrong answer. This article is general information, not investment advice, and a real decision should also weigh your goals, tax and existing holdings.
Putting Information Ratio vs Sharpe Ratio to Work
The practical takeaway from the information ratio vs Sharpe ratio comparison is that you should not choose between them. Ask which question you face. If it is "should I own this?", start with Sharpe and compare it with the benchmark's own Sharpe over the same period. If it is "should I pay this manager?", start with the information ratio against the narrowest fair benchmark, net of fees.
Then look for agreement. Where the two ratios agree over several years and different market conditions, you have a stronger case. Where they conflict, the conflict itself tells you what to ask next. Finally, keep your confidence modest: many PMS records are too short for either ratio to prove skill by itself. PMS Sahi Hai's compare tools and Nyra can help you gather the inputs, but the judgement about which question matters remains yours.
Start Comparing Strategies on Both Yardsticks
Take the two or three strategies you are considering and collect the same details for each: monthly net returns, the benchmark and whether it is a total return index, and the period covered. Calculate both ratios on the same window, then read them with the table above.
Then compare those strategies side by side on PMS Sahi Hai, ask Nyra about anything you cannot explain, or book a conversation with the team to go through the numbers before you commit. This article is general information as of 30 October 2026, not investment advice.
PMS Sahi Hai is a distributor of Portfolio Management Services and Alternative Investment Funds, APMI-registered (Registration No. APRN08358). This article is for education only and is not investment advice, a recommendation, or an offer to buy or sell any security. Investments in securities markets are subject to market risks; read all scheme-related documents carefully. Past performance is not indicative of future results. Consult your advisor before investing.
Ishaan founded PMS Sahi Hai to make India's PMS, AIF and GIFT City markets legible to serious investors, comparing every SEBI-registered manager on the same comparative basis, with no shelf products and no commission bias.
Frequently asked
What is the main difference between the Sharpe ratio and the information ratio?
The Sharpe ratio compares return above a risk-free rate with total volatility, so it measures absolute risk-adjusted return. The information ratio compares return above a market benchmark with tracking error, so it measures benchmark-relative performance. Sharpe judges the whole portfolio you own, while the information ratio judges whether a manager's active decisions added value compared with an index.
Is the information ratio better than the Sharpe ratio?
Neither is better overall, because they answer different questions. The information ratio is more useful for judging whether a manager earned a fee against a fair benchmark. The Sharpe ratio is more useful for judging total risk, or comparing strategies with different benchmarks. Claims that one is simply more accurate ignore the cases where each one misleads.
Can a fund have a high Sharpe ratio and a low information ratio?
Yes. In a strong rally, a strategy can post a high Sharpe ratio while trailing its index. In our example, a 28% return against a 32% benchmark gives a Sharpe ratio of 1.54 and an information ratio of -0.67. A calm strategy that only matches the benchmark's return can also show this pattern, as Strategy B does.
Can the information ratio be positive when a fund loses money?
Yes. The information ratio only measures performance against the benchmark, so losing less than the index produces a positive reading. A strategy falling 12% while its benchmark falls 18%, with 4% tracking error, has an information ratio of 1.50. Its Sharpe ratio is -0.93, which is why you should read the two together.
Does SEBI require PMS providers to disclose the information ratio?
The information ratio mandate of 17 January 2025 covers equity-oriented mutual funds, not PMS. PMS rules require time-weighted returns shown with a selected benchmark's trailing return. SEBI's portfolio manager master circular of 16 July 2025 does not use the term, so any PMS figure is voluntary. Ask how it was calculated, over what period and against which benchmark.
Is tracking error the same as standard deviation?
Not quite. Standard deviation in the Sharpe ratio measures how much a portfolio's own returns vary. Tracking error is the standard deviation of the gap between portfolio and benchmark returns. A calm portfolio can have low volatility and high tracking error if it behaves differently from the index, while a volatile index-like fund can have the reverse.
Which ratio should a PMS investor check first?
Check the benchmark first, because a poor benchmark distorts the information ratio. Then read the Sharpe ratio to judge whether the total ride suits you, and compare it with the benchmark's own Sharpe ratio. Next read the information ratio, net of fees, to judge the manager. Look at three to five years or more, and across different market conditions.
Keep reading
All articles
Passive vs Active Management: Mutual Funds, ETFs and PMS Compared
Passive vs active management in India: 2026 cost caps, SPIVA evidence, tracking error, and when index funds, active funds or PMS fit.
Information Ratio vs Alpha: Size of the Edge or Its Reliability?
Alpha shows the size of a PMS manager's edge; the information ratio shows how reliable it is. See four worked strategies and how to read both.

Portfolio Manager vs Fund Manager vs Wealth Manager: Who Does What
Portfolio manager, fund manager or wealth manager? Their SEBI licences, duties and pay in India, and how to check which one is handling your money.
Read it. Now pressure-test it.
Ask Nyra how this applies to your portfolio, or talk to our team, no pitch, no pressure.