
What Shapes a PMS Standard Deviation Figure: 6 Measurement Choices
Window, data frequency, annualisation, fees, model vs client returns and benchmark: six choices that shape the standard deviation on a PMS factsheet.

A reported standard deviation is not a fixed fact about a PMS strategy. It is the output of six choices: the measurement window, daily vs monthly returns, the annualisation convention, gross of fees or net of fees, model portfolio or real client accounts, and whether a benchmark standard deviation sits next to it. SEBI requires PMS performance to be reported net of all fees and expenses, but we found no SEBI rule on how a portfolio manager must compute standard deviation. Change any one choice and the number moves, sometimes by several percentage points. Use the checklist in this guide to make sure two strategies are measured the same way before you compare them.
Why the Same PMS Can Show Different Standard Deviations
Open the manager's monthly PMS factsheet and a third-party data screen for the same strategy and you may find two volatility numbers, say 14.2% and 16.8%. Neither is necessarily wrong. They were built from different ingredients.
Standard deviation measures how widely a portfolio's periodic returns scatter around their average. This guide skips the formula and the general interpretation and covers the layer most investors never see: the measurement decisions made before the number reached the page.
Those decisions matter because investors compare strategies side by side. If Strategy A's figure uses three years of month-end returns net of fees and Strategy B's uses one year of daily returns gross of fees, the comparison is meaningless even though both cells say "standard deviation".
There are six choices to look for:
| Choice | The question to ask | Typical options |
|---|---|---|
| 1. Measurement window | Over what period? | 1 year, 3 years, 5 years, since inception |
| 2. Data frequency | From which returns? | Daily, weekly, monthly |
| 3. Annualisation | Scaled how? | Monthly × √12, daily × √252 or √250, not annualised |
| 4. Fee basis | Before or after fees? | Gross of fees, net of fees |
| 5. Return series | Whose returns? | Model portfolio, investment-approach aggregate, your own account |
| 6. Benchmark context | Compared with what? | Benchmark standard deviation over the same window, or nothing |
How Volatility Reporting Rules Evolved for Funds and PMS in India
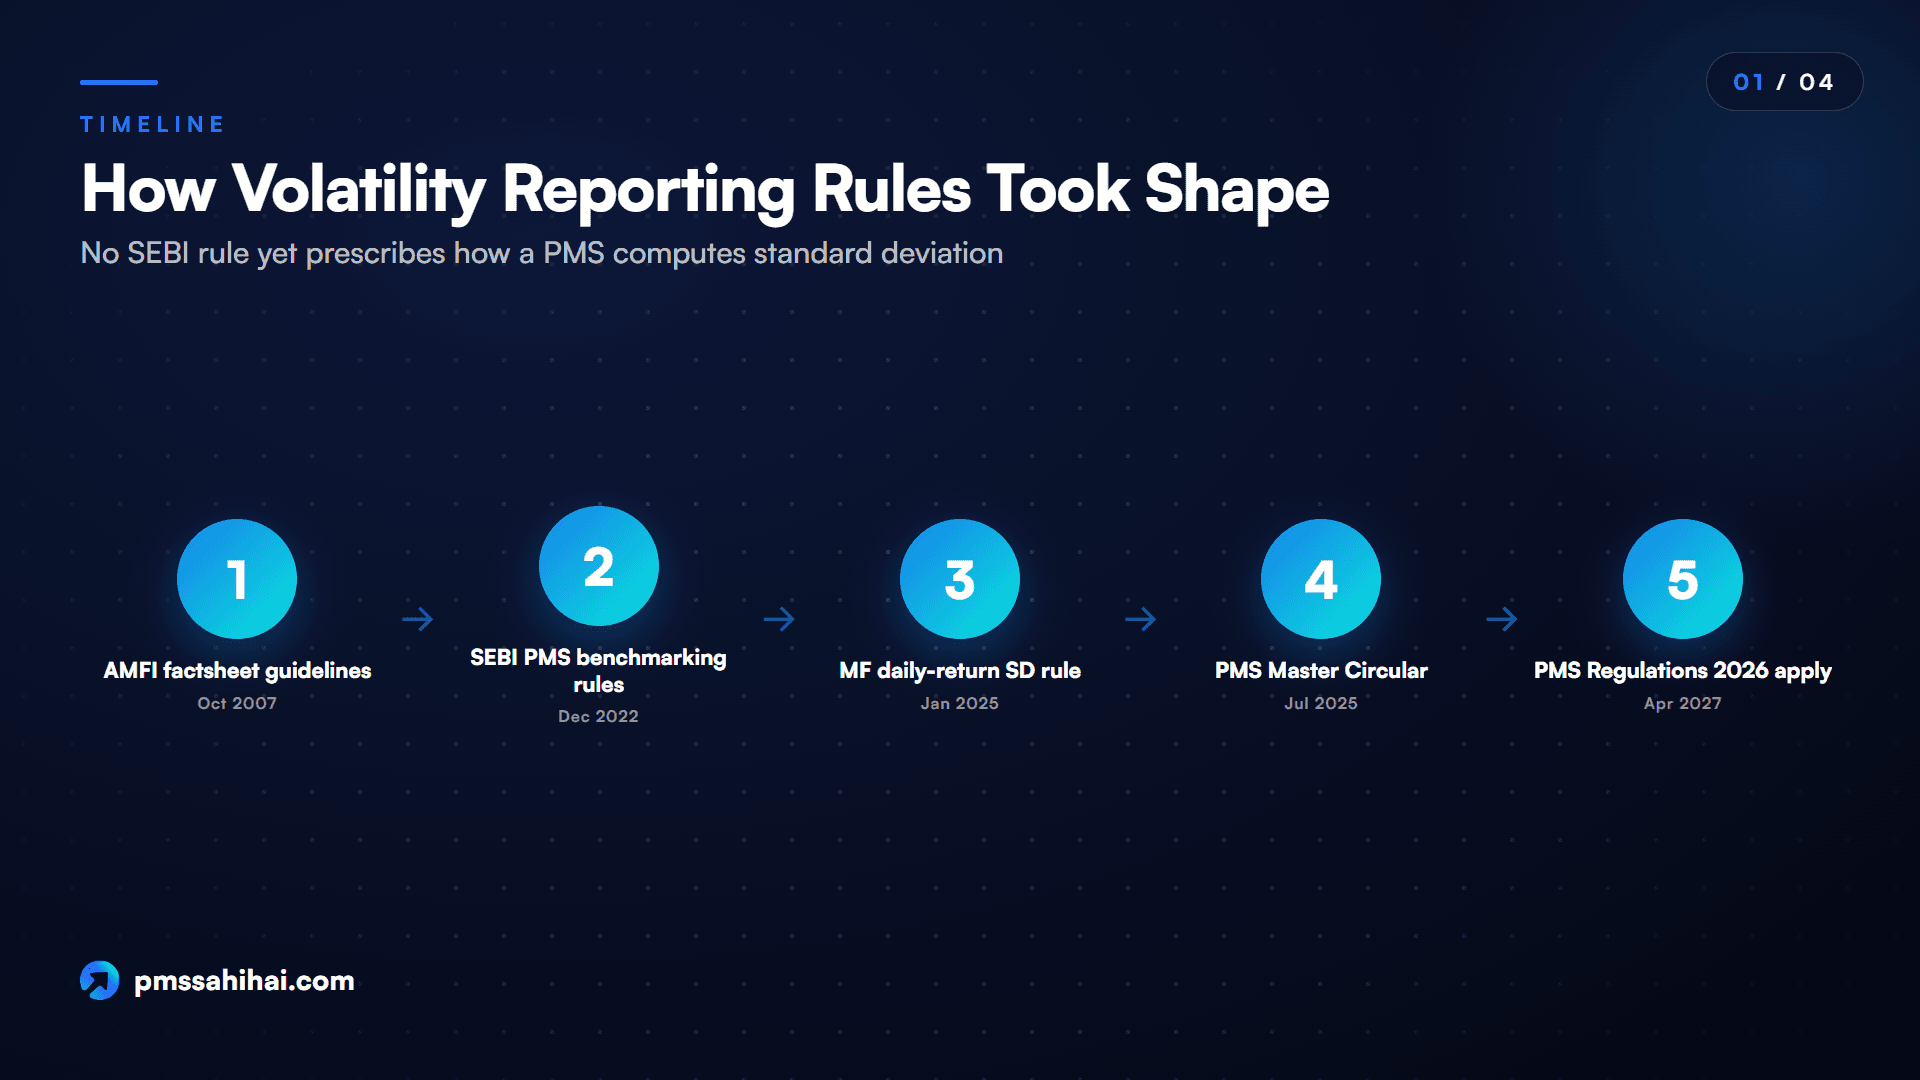
Indian rules on risk statistics grew piece by piece, and PMS never received the prescription mutual funds did.
From AIMR Standards to the 2007 AMFI Factsheet Guidelines
On 25 October 2007, the Association of Mutual Funds in India issued Best Practices Guidelines Circular No. 14/2007-08 on standardising mutual fund factsheets. AMFI said it acted at SEBI's request because factsheets showed "no uniformity in the content, presentation and treatment of various ratios". The annexure says its quantitative data follow AIMR standards, the US performance presentation standards of the time.
The 2007 guidelines set out a default method for equity funds:
- Input data are month-end NAVs of the growth or dividend-adjusted series.
- By default, the last 36 month-end data points are used for equity funds and 12 for fixed income, index and hybrid funds.
- If another period is used, it must be shown with the figure.
- Monthly volatility is annualised by multiplying by the square root of 12, which the circular rounds to 3.46.
- Variance divides by the number of observations minus one.
- Ratios for periods under 12 months should not be annualised.
- The risk-free rate used for the Sharpe ratio must be uniform and disclosed.
Those guidelines apply to mutual funds, not portfolio managers, but they remain the closest Indian statement of how a careful 3-year standard deviation should be built.
GIPS, SEBI's 2022 PMS Benchmarking Rules and the 2025 Daily-Return Rule
Globally, the CFA Institute's Global Investment Performance Standards (GIPS), which are voluntary, ask firms that comply to present the three-year annualised ex post standard deviation, using monthly returns, for both the fund or composite and its benchmark. A firm must disclose it when the figure is missing because 36 monthly returns are not yet available.
For Indian portfolio managers, SEBI's rules focus on returns rather than risk statistics. The Master Circular for Portfolio Managers dated 16 July 2025 requires managers to include all cash and liquid-fund holdings in performance, to report performance net of all fees and all expenses (including taxes), and to show the time-weighted rate of return (TWRR) of each investment approach with the trailing return of its benchmark. SEBI's December 2022 framework added four broad strategies (Equity, Debt, Hybrid and Multi Asset) and up to three benchmarks per strategy prescribed by APMI. We searched the full 207-page circular for "standard deviation", "volatility", "Sharpe", "risk ratio" and "beta" and found no provision prescribing how a portfolio manager must compute any of them.
Mutual funds moved the other way. A SEBI circular of 17 January 2025, now in the Master Circular for Mutual Funds of 20 March 2026, makes equity schemes publish an information ratio every day and states that the standard deviation inside it "shall be calculated on the basis of daily return values". So within Indian regulation, a monthly-data convention (AMFI 2007) and a daily-data convention (SEBI 2025) now sit side by side.
One more date matters: the SEBI (Portfolio Managers) Regulations, 2026, notified in October 2026, take effect on 1 April 2027. Until then the 2020 Regulations and the July 2025 Master Circular apply; watch for any later circular on risk ratios.
How Today's Data Platforms Produce the Number
Today index providers, fund houses, PMS managers, research platforms and AI assistants compute standard deviation automatically from whatever return series they are fed. The NSE Indices factsheet for the Nifty 50, for example, labels its figure "average daily standard deviation annualised", based on the price return index. Automation makes the number cheap to publish and its basis easy to hide: a single cell in a comparison table rarely says which inputs were used.
Choice 1: The Measurement Window Behind a 3-Year Standard Deviation
The measurement window is the stretch of history over which returns are collected. It is the single biggest driver of a reported standard deviation, because markets go through calm and stormy phases and the window decides which phases count.
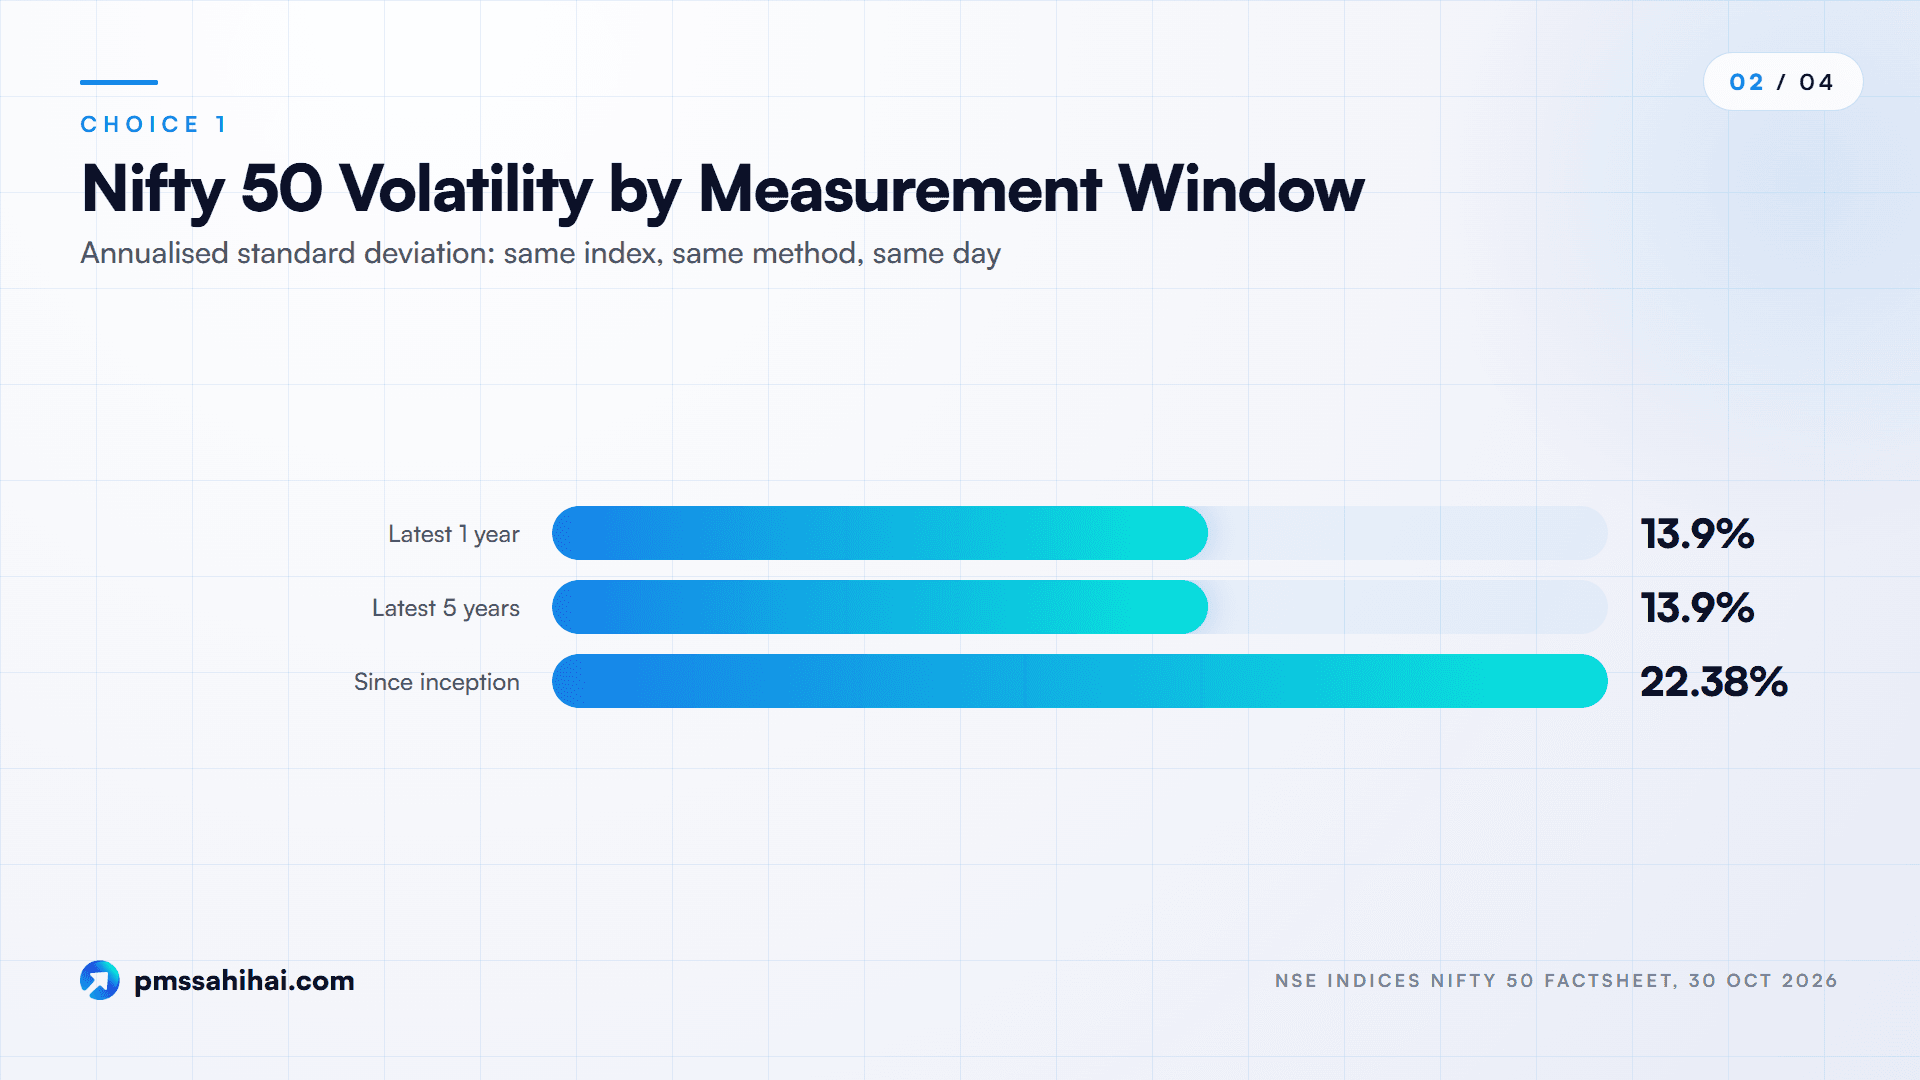
The Nifty 50 factsheet dated 30 October 2026 shows this clearly. The index's annualised standard deviation is about 13.9% over both the latest one year and the latest five years, but 22.38% since inception. Same index, same method, same day. The long window simply contains more turbulent periods, such as 2008, that the recent windows do not.
PMS factsheets commonly show a 1-year, 3-year or since-inception figure, and sometimes all three. The 3-year standard deviation is the most common default because it follows the AMFI convention and the GIPS requirement, but no rule forces a PMS to use it.
One Bad Month Rolling In or Out of the Window
A rolling window drops the oldest month and adds the newest every month. When an extreme month leaves the window, the figure can fall sharply even though nothing about the strategy changed.
Here is a hypothetical illustration. Take 35 ordinary months with a monthly standard deviation of about 3.3%, then add one more month:
| 36th month | Annualised standard deviation |
|---|---|
| A −20% crash month | 16.56% |
| A +1% ordinary month | 11.17% |
One month out of 36 moves the reported standard deviation by more than five percentage points. This is why a strategy's figure can drop abruptly about three years after a crash: the crash has rolled out of the 36-month measurement window, not because the manager became more careful. When comparing strategies, check three things:
- Same length. A 1-year figure against a 3-year figure is not a fair comparison.
- Same end date. Two 3-year windows ending six months apart can contain different crises.
- Stated explicitly. If the factsheet only says "standard deviation", ask which window it uses.
Short Track Records and Since-Inception Figures
A strategy launched 14 months ago cannot produce a 3-year standard deviation, so some factsheets show a since-inception figure instead. That is fine if labelled, but 14 monthly returns give a far less reliable estimate than 36, and a quiet launch year can make a young strategy look calmer than its holdings justify.
GIPS handles this by asking firms to disclose when the three-year figure is missing because 36 monthly returns are not available. AMFI's 2007 guidelines say ratios for periods shorter than 12 months should not be annualised at all. A PMS investor can apply the same discipline: treat any figure built on fewer than 36 monthly observations as provisional.
Choice 2: Daily vs Monthly Returns as the Raw Data
The second choice is the frequency of the raw data. Daily vs monthly returns is not a cosmetic difference. A 3-year standard deviation built from monthly data rests on 36 observations. The same window in daily data has around 750 observations, at roughly 250 trading days a year.
More observations make the estimate statistically tighter, which is why index providers and SEBI's information-ratio rule use daily values. Monthly data match how PMS performance (TWRR, the time-weighted rate of return) is usually published, and they are the GIPS convention.
Why the Two Frequencies Disagree
If daily returns were independent of each other, a daily estimate scaled up to a year and a monthly estimate scaled up to a year would differ only by random noise. Real markets do not behave that way.
A well-known study of the S&P 500 since 1950, published on R-bloggers in November 2011, compared the two over non-overlapping three-year windows. It found long runs of windows where the daily-based estimate sat below the monthly-based one, which would be unlikely if both were measuring the same thing. The author put this down to autocorrelation, meaning today's return is partly related to yesterday's:
- Momentum (positive autocorrelation) tends to make monthly-based volatility larger than scaled-up daily volatility.
- Mean reversion (negative autocorrelation) tends to make daily-based volatility larger.
The lesson for a PMS investor: daily-based and monthly-based figures are different estimates of risk. They can be close for a large-cap strategy in a calm period and far apart for a small-cap or thinly traded portfolio, where prices may lag news. Never treat the gap between a daily-based and a monthly-based number as information about the manager.
Choice 3: The Annualisation Convention Used
Raw standard deviations are per period, such as 1.0% per day or 4.5% per month. Almost every PMS factsheet scales them to an annual number, and the scaling convention is the third choice.
Square Root of 12, 250 or 252
The usual shortcut, the square-root-of-time rule, multiplies by the square root of the number of periods in a year:
| Raw data | Factor | Example |
|---|---|---|
| Monthly | √12 ≈ 3.46 | 5% per month → about 17.3% a year |
| Daily, 252 trading days | √252 ≈ 15.87 | 1% per day → about 15.9% a year |
| Daily, 250 trading days | √250 ≈ 15.81 | 1% per day → about 15.8% a year |
The gap between 250 and 252 days is small. The gap between monthly and daily inputs, as we saw, can be larger. The bigger point is that the square-root rule itself is a convention, not a law of nature. It assumes returns are independent and identically distributed, which they are not.
A 2013 CFA Institute Digest summary of published research argued that multiplying monthly standard deviation by the square root of 12 is mathematically invalid for simple returns, because a year's return is the product of monthly returns, not their sum. The bias depends on the average monthly return as well as the volatility. In the study's sample of 1,824 Canadian funds the error was usually small, within about one percentage point for 96% of funds, and the digest noted the shortcut remains the most common method. So you need not throw out every √12 figure, but two managers using different conventions can publish slightly different numbers from identical portfolios. What matters here is that the convention is disclosed.
When Annualising Should Not Happen at All
Annualising a few months of data makes a figure look more meaningful than it is. AMFI's 2007 guidance says risk ratios for periods under 12 months should not be annualised, or should carry a disclaimer if they are. A "p.a." volatility figure for a six-month-old strategy is a warning sign, not a data point.
Also look for the unit. The AMFI guidelines suggested showing volatility as a percentage with its period, such as "2% p.m.", rather than as a bare decimal. A factsheet that prints "0.04" without saying monthly or annual leaves you guessing by a factor of more than three.
Choice 4: Gross of Fees or Net of Fees
The fourth choice is the fee basis. A gross of fees return is what the portfolio earned before management and performance fees. A net of fees return is what the client kept. SEBI requires portfolio managers to report performance net of all fees and all expenses, including taxes. But a risk statistic in a marketing deck, a data screen or a manager's presentation might still be computed on gross returns, especially if it comes from a model or from the manager's internal analytics.
Does the fee basis change volatility much? Usually less than it changes returns, and that difference is where the trap lies.
A Worked Illustration of Fees and Volatility
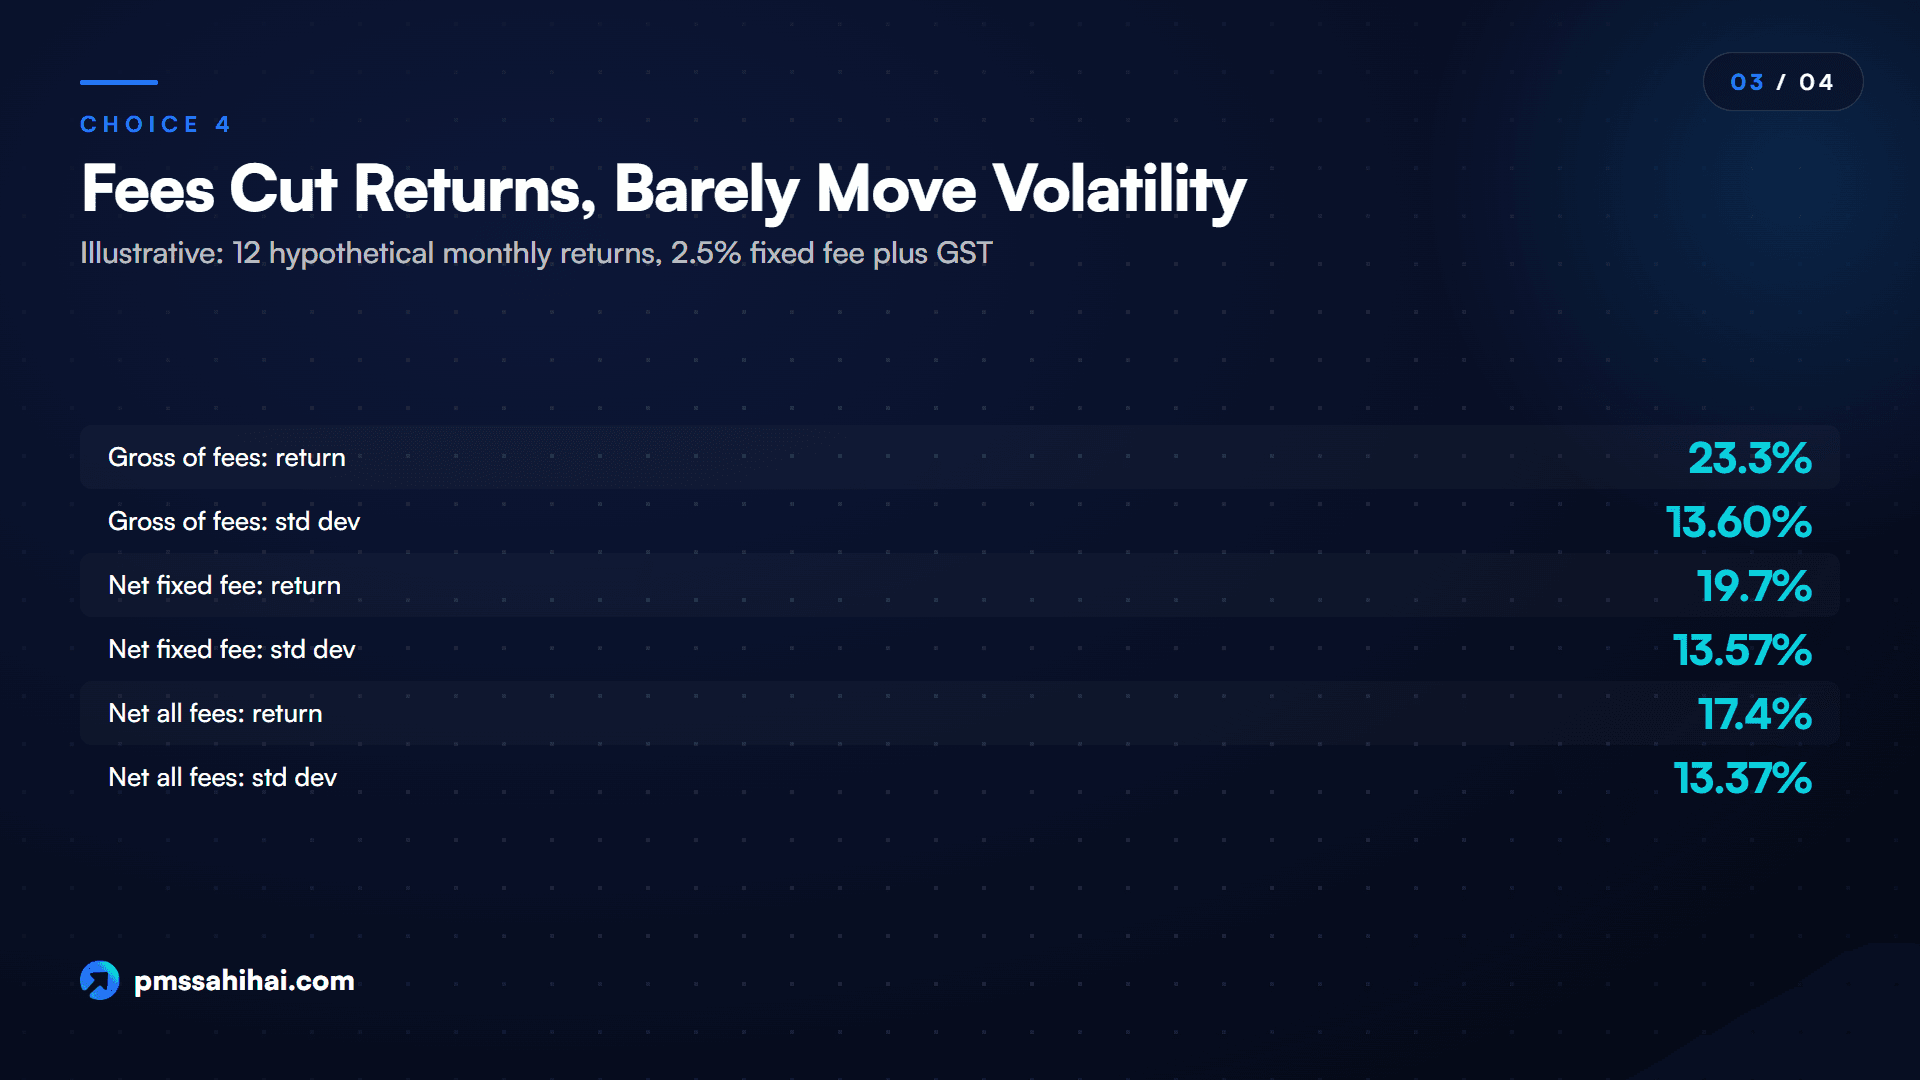
Take a hypothetical strategy with these 12 monthly gross returns: +6%, −4%, +3%, +5%, −2%, +4%, +7%, −5%, +2%, +3%, −1%, +4%.
| Basis | 12-month return | Annualised standard deviation |
|---|---|---|
| Gross of fees | 23.3% | 13.60% |
| Net of a 2.5% fixed fee plus 18% GST, charged monthly | 19.7% | 13.57% |
| Also net of a 20% performance fee above a 10% hurdle, charged in month 12 | 17.4% | 13.37% |
A steady fixed fee cuts returns by about 3.6 percentage points but barely touches volatility, because it shifts every month down by roughly the same amount. A performance fee charged in one month reshapes that month and nudges volatility slightly.
The real risk is a mismatch. If a manager shows a net-of-fees return but a gross-of-fees standard deviation, or computes a Sharpe ratio using gross returns, the risk-adjusted picture looks better than what the client actually experienced. When you read a PMS factsheet, check that return, volatility and any ratio that combines them all use the same fee basis. Ideally, all three are net of fees, matching SEBI's reporting rule.
Choice 5: Model Portfolio or Actual Client Accounts
The fifth choice is whose returns the statistic describes. In a PMS, every client owns securities in an individual account. Clients join at different dates, add and withdraw money at different times and may exclude certain stocks, so portfolios drift apart.
A manager can therefore compute volatility on at least three different series:
- A model portfolio. The manager's ideal target portfolio. It has no cash-flow timing, no lag in deploying new money and no client-specific restrictions. Its returns can look cleaner than any real account.
- The investment-approach aggregate. SEBI requires TWRR for each investment approach to include all clients in that approach during the period, and requires firm-level performance to equal the combined performance of all portfolios.
- Your own account. Your personal statement shows your XIRR, along with the minimum, maximum and median XIRR across all investors in the same investment approach, plus the approach's TWRR.
A model portfolio figure shows the strategy's design, not what any client lived through. Volatility from a model portfolio next to returns from the investment-approach aggregate is another mixed basis.
Dispersion Across Client Accounts
Even on the same strategy, a client who joined just before a fall and one who joined after it hold the same stocks today but have lived through different paths. GIPS deals with this through "internal dispersion", typically the standard deviation of individual portfolio returns within a composite. Its sample disclosures do not present the measure when a composite has five or fewer portfolios for the full year.
Indian PMS rules approach the same issue from the return side. The minimum, maximum and median XIRR that SEBI requires on each client's report show how widely investors' experiences differ. A wide spread is a hint that the reported standard deviation of the aggregate may not describe your account well.
Choice 6: Benchmark Standard Deviation Shown Alongside
The sixth choice is whether the factsheet gives you anything to compare the number with. A reported standard deviation of 18% means little on its own. Next to a benchmark standard deviation of 15% over the same window, the strategy has been bumpier than its index; next to 19%, the same 18% looks calm.
GIPS asks for the benchmark's three-year annualised ex post standard deviation next to the fund's, using the same monthly return basis. Indian PMS rules require benchmark returns alongside the TWRR of the investment approach, but do not require a benchmark standard deviation. Some managers show it; many do not.
Which Benchmark and Which Version of It
For a benchmark standard deviation to be useful, it must be measured exactly like the strategy's number: same window, same end date, same data frequency, same annualisation. Two further details matter:
- The right index. Under SEBI's framework, each investment approach is tagged to one strategy and to one of up to three benchmarks prescribed by APMI. A manager may change the tagging only after offering clients an exit without exit load, and may not use the track record before the change for performance reporting. Compare a small-cap strategy's volatility with a small-cap or broad-market index, not with a large-cap index chosen to flatter it.
- Price or total return version. Index providers often compute statistics on the price return index, as the Nifty 50 factsheet does. Dividends add a small, fairly steady component to returns, so the two versions usually have similar volatility; the version matters far more for return comparisons, but a careful factsheet still names it.
A Factsheet Checklist for Reading Reported Standard Deviation
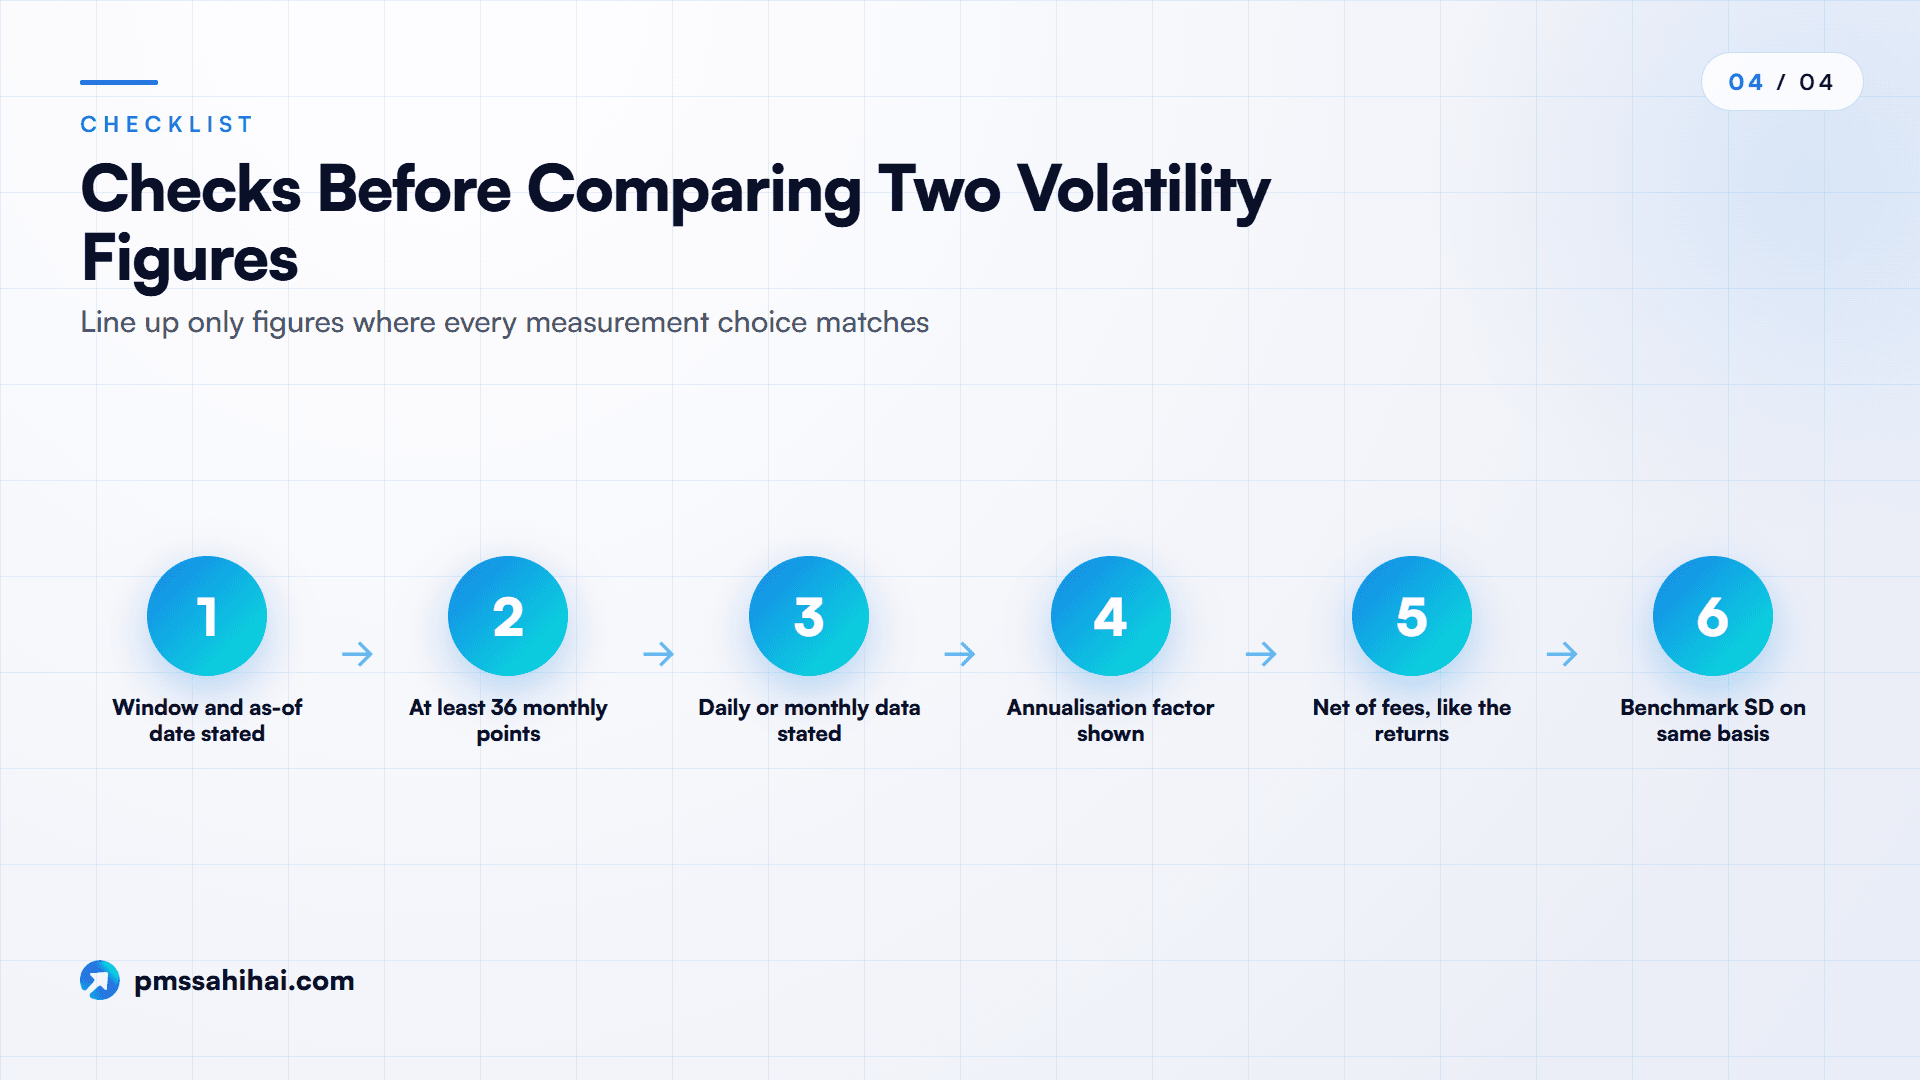
Use this checklist whenever you compare volatility across PMS strategies, or between a PMS and a mutual fund.
| # | Check | What a good PMS factsheet tells you | Red flag |
|---|---|---|---|
| 1 | Window | "3-year" or similar, with an as-of date | No period stated |
| 2 | Track record length | At least 36 monthly observations | Annualised figure on under 12 months |
| 3 | Data frequency | Daily or monthly, stated | Unstated, or mixed across strategies |
| 4 | Annualisation | √12, √252 or "not annualised" | Bare decimal with no unit |
| 5 | Fee basis | Net of fees, matching the return figures | Gross of fees volatility next to net returns |
| 6 | Return series | Investment-approach aggregate | Model portfolio returns presented as client experience |
| 7 | Benchmark | Benchmark standard deviation on the same basis | No benchmark figure, or an unrelated index |
| 8 | Index version | Price or total return stated | Unstated |
| 9 | Companion ratios | Sharpe/Sortino using the same series and a disclosed risk-free rate | Ratios built on a different series |
| 10 | Consistency over time | Same method month after month | Method changed without a note |
If a factsheet does not answer a question, ask the manager or your distributor in writing. A good portfolio manager should be able to state the window, frequency, annualisation and fee basis in one sentence.
When comparing a shortlist, write each figure down with its window, frequency and fee basis, mark anything under 36 months as provisional, and line up only figures where all six choices match.
Why Knowing the Measurement Basis Makes Comparison Easier
Checking the basis sounds like extra work, but it prevents expensive mistakes.
- Like-for-like comparison. When two figures share a window, frequency and fee basis, the gap between them says something real about the strategies.
- Fewer false alarms. A figure that jumps after one month or falls three years after a crash usually means the window moved, not the manager.
- Honest risk-adjusted ratios. Sharpe and Sortino ratios inherit every choice made for standard deviation; fix the basis once and they are fixed too.
- Sharper questions. "Is this monthly data, net of fees, on the investment-approach aggregate?" gets a clearer answer than "Is this strategy risky?"
- Better context. A benchmark standard deviation on the same basis shows whether the manager took more or less risk than the index.
- Protection against hype. Short-record annualised figures and model portfolio numbers are easy to spot once you know what to look for.
How PMS Sahi Hai Helps You Read the Inner Clause of a Volatility Number
The six choices above share one lesson: a risk number is only comparable when one method is applied to every strategy. That is the idea behind Nyra, the AI research analyst on PMS Sahi Hai.
The Nyra Score methodology (version 1.1, effective 1 July 2026) publishes how each strategy is rated on a 0–10 scale against fixed standards rather than a curve. Volatility is not judged alone. It sits inside a Downside Protection pillar (20% weight) with maximum drawdown and beta, next to a Risk-Adjusted Return pillar (25%) built on Sharpe and Sortino ratios, plus return, consistency and stewardship pillars. A strategy with less than 12 months of track record is marked Not Rated, which matches the short-record caution in this guide.
To be clear about the limits: the methodology page does not state the data frequency, lookback window, annualisation factor or fee basis behind its volatility input. Use Nyra as a consistent screen, and still run the checklist above on each PMS factsheet you are given.
Practical ways to use the platform for this job:
- Line up like with like. The PMS comparison tool filters by category, fund house, benchmark, AUM and style, and lets you put up to four strategies side by side, so a small-cap strategy is not judged against a large-cap one.
- Ask Nyra. Nyra answers questions about strategies with source-cited responses. Its output is informational, not personalised investment advice.
- Check fee and return bases. Our guides on gross vs net TWRR and on why your returns differ from published strategy returns cover choices 4 and 5 from the return side, and how to read a PMS factsheet walks through every other section of the document.
Limits of Standardising Any Single Volatility Number
Even a perfectly disclosed figure has limits, and getting the basis right does not fix them.
- No PMS rulebook for risk statistics. We found no SEBI requirement for how portfolio managers compute standard deviation, so you may simply not get the basis from the document. The 2007 AMFI guidelines cover mutual funds, GIPS compliance is voluntary, and the SEBI (Portfolio Managers) Regulations, 2026 only take effect on 1 April 2027.
- Standard deviation treats gains like losses. A strategy that occasionally jumps sharply upward is penalised as if it had fallen. Downside measures such as the Sortino ratio and maximum drawdown fill part of that gap.
- Fat tails and clustering. Market returns have more extreme days than a normal distribution predicts, and calm and stormy periods cluster. A 3-year standard deviation from a calm stretch can understate what a crisis will feel like.
- The scaling rule is an approximation. The square-root rule assumes independent returns. Autocorrelation and the arithmetic of compounding make every annualised number an estimate.
- Matching bases takes data you may not have. Recomputing a figure needs the return series, and many managers publish only summary numbers.
- Past volatility is not future volatility. A strategy that changes its holdings, concentration or market-cap mix can behave differently from its history.
Reading Reported Standard Deviation With the Right Context
A reported standard deviation is the end of a chain of decisions: which window, which data frequency, which annualisation, which fee basis, whose returns and against which benchmark. Each link is reasonable on its own. Problems start when two numbers built on different chains are placed side by side and treated as equals.
The fix is not complicated. Ask what window the figure covers and how many observations it uses. Confirm the data frequency and the annualisation factor. Make sure volatility and returns are both net of fees, as SEBI requires for PMS performance. Prefer the investment-approach aggregate over a model portfolio, and insist on a benchmark standard deviation measured the same way. A PMS factsheet that answers all of this is one you can trust, and a consistent screen such as PMS Sahi Hai's Nyra Score helps you narrow the field before you dig into the footnotes.
Compare PMS Risk Numbers on a Like-for-Like Basis
Before you shortlist a PMS on its risk profile, run every strategy's reported standard deviation through the ten-point checklist above. Where a factsheet is silent, ask the manager in writing. Compare only figures that share a basis, and read them with drawdowns, the spread of client returns and the benchmark. A volatility number you understand is worth far more than one that merely looks low.
PMS Sahi Hai can help with the groundwork. Compare PMS strategies side by side, see how Nyra scores them, or run a portfolio scan on what you already hold, then take your checklist questions to the manager.
PMS Sahi Hai is a distributor of Portfolio Management Services and Alternative Investment Funds, APMI-registered (Registration No. APRN08358). This article is for education only and is not investment advice, a recommendation, or an offer to buy or sell any security. Investments in securities markets are subject to market risks; read all scheme-related documents carefully. Past performance is not indicative of future results. Consult your advisor before investing.
Ishaan founded PMS Sahi Hai to make India's PMS, AIF and GIFT City markets legible to serious investors, comparing every SEBI-registered manager on the same comparative basis, with no shelf products and no commission bias.
Frequently asked
Does SEBI prescribe how a PMS must calculate standard deviation?
We found no such provision. SEBI's Master Circular for Portfolio Managers (16 July 2025) requires performance to be reported using TWRR, net of all fees and expenses including taxes, alongside benchmark returns. It does not set a method for standard deviation or other risk ratios. Mutual funds are different: AMFI's 2007 guidelines set a monthly-data default, and the information-ratio rule in SEBI's Master Circular for Mutual Funds uses daily returns.
Why do two factsheets show different standard deviation for the same fund?
Because they probably made different measurement choices. The window, the end date, daily vs monthly returns, the annualisation factor, the fee basis and the return series all change the number. Often both figures are correctly computed, just on different bases, so check each item before deciding which one to trust.
Is a 3-year standard deviation better than a since-inception figure?
Neither is better. They answer different questions. A 3-year standard deviation shows recent behaviour and is comparable across strategies with at least three years of history. A since-inception figure covers more market cycles but depends on the launch date. The Nifty 50 shows about 13.9% over five years against 22.38% since 1995 inception, as of 30 October 2026.
Should standard deviation be calculated from daily or monthly returns?
Both are legitimate but not interchangeable. Monthly data match PMS performance reporting and the GIPS convention of 36 monthly returns. Daily data give more observations and are used by index providers and SEBI's mutual fund information-ratio rule. What matters is that the frequency is disclosed and that you compare like with like.
Is PMS standard deviation calculated net of fees?
It should be on the same basis as the reported returns, which SEBI requires to be net of all fees and expenses. In practice, a volatility figure from a model, a marketing deck or a third-party tool may be gross of fees. Fixed fees barely change standard deviation, but mixing a net return with a gross figure distorts the Sharpe ratio and similar measures.
What is the difference between model portfolio and client volatility?
A model portfolio is the manager's ideal target holdings, with no cash-flow timing or client restrictions. Real client accounts differ because clients join at different times and add or withdraw money. SEBI requires investment-approach returns to include all clients, and each client's report must show the minimum, maximum and median XIRR across investors.
Why should a benchmark standard deviation appear next to a PMS figure?
Because volatility is only meaningful in context. A strategy at 18% looks risky next to an index at 15% and calm next to one at 19%. The benchmark figure must use the same window, end date, frequency and annualisation. GIPS requires a benchmark standard deviation alongside the fund's; Indian PMS rules require benchmark returns but not benchmark volatility.
What is a good standard deviation for a PMS?
There is no universal good number; a small-cap strategy will naturally swing more than a large-cap one. Compare a strategy with its own benchmark and with same-category peers, over the same window and on the same basis, then read it with drawdown history, because standard deviation treats upside and downside swings alike.
Keep reading
All articles
What Is Market Capitalization? Formula, SEBI Cap Bands and PMS Use
Market capitalization explained: the formula, SEBI's large, mid and small cap ranks, AMFI's June 2026 cut-offs and why it matters for PMS investors.
What Are Trailing Returns? How the As-of Date Changes the Number
Trailing returns explained: how they are calculated, why the as-of date moves the number, and how to read 1Y, 3Y and 5Y figures in a factsheet.
Free Float Market Capitalisation: How NSE’s IWF Sets Index Weights
How free float market capitalisation is calculated with NSE's investible weight factor, which shares are excluded, and why Nifty and Sensex use it.
Read it. Now pressure-test it.
Ask Nyra how this applies to your portfolio, or talk to our team, no pitch, no pressure.