
Free Float Market Capitalisation: How NSE’s IWF Sets Index Weights
How free float market capitalisation is calculated with NSE's investible weight factor, which shares are excluded, and why Nifty and Sensex use it.

Free float market capitalisation counts only the shares that ordinary investors can actually buy and sell, leaving out promoter, government, strategic and locked-in holdings. In India, NSE turns this into a number called the investible weight factor (IWF), worked out from each company's quarterly shareholding pattern after removing 22 categories of holders, and rounded to six decimals. The Nifty 50 has been weighted this way since June 2009 and the Sensex since September 2003; today every broad Nifty index is free float weighted. If you hold an index fund or compare a PMS against the Nifty 50 or Nifty 500, the weights you are measured against are free float weights, not company size.
Why Free Float Market Capitalisation Shapes Every Index You Track
Open any Nifty 50 factsheet and you will see a list of weights. Many investors assume those weights follow company size: the biggest company by market value gets the biggest slice. That is close, but not quite right. The weights follow free float market capitalisation, which is company size adjusted for how many shares are genuinely available to the public.
The difference is large in a market like India's, where promoters, the government and strategic partners often hold a big share of listed companies. A company can be among the most valuable in the country and still carry a modest index weight because most of its shares are locked up with its founders or the state.
This guide explains the adjustment from the ground up: what it measures, how NSE calculates the investible weight factor, which holders it excludes, how the Nifty and Sensex came to use it, and what it means for a PMS benchmark. We use NSE's published rules and dated, real index data. Plain market capitalisation and the head-to-head comparison with full market cap are covered in separate explainers.
What Free Float Market Capitalisation Actually Measures
Free float market capitalisation is the market value of a company's free float shares: the shares held by public investors who are free to trade them on the exchange. It answers a practical question. If a fund wanted to buy this company in proportion to its size, how much stock could it actually find in the market?
The idea is old in global markets. It is also called float-adjusted market capitalisation, the term NSE uses in its Nifty 50 methodology, and Investopedia's guide to free float methodology describes it as the system major indices, including the S&P 500, use to weight their members.
The Formula in One Line
The free float market cap formula has two equivalent forms:
- Free float market cap = Share price × Free float shares
- Free float market cap = Share price × Total shares outstanding × IWF
The second form is the one NSE uses. The IWF, or investible weight factor, is a number between 0 and 1 that represents the share of the company's equity available for trading. A free float factor of 0.60 means 60% of the shares count; 1.00 means the whole company counts.
So a company with a full market value of ₹1,00,000 crore and an IWF of 0.40 has a free float market capitalisation of ₹40,000 crore. In a free float index, it is the ₹40,000 crore that counts.
Free Float Shares Versus Shares Outstanding
Shares outstanding are every share the company has issued. Free float shares are a subset. The gap is made up of holdings that, by their nature, are not expected to trade: a promoter group's controlling stake, a government's strategic holding, shares a private equity investor or foreign direct investor holds as a long-term partner, shares under lock-in after an IPO, and so on.
Free float also moves over time. It rises when promoters sell stakes, when a lock-in period ends, or when a company issues new shares to the public. It can fall when a promoter buys more shares or when a buyback shrinks the public's holding. As a general pattern, smaller floats tend to be more volatile and trade with wider bid-ask spreads, which is one reason large institutions prefer larger floats.
How the Investible Weight Factor Is Calculated
NSE's definition is precise. In its guideline note on calculating investible weight factors, the investible weight factor is "a unit of floating stock expressed in terms of a number available for trading and which are normally expected to be available for trading in the market." A higher IWF means more shares sit with investors reported under the public category of the shareholding pattern.
The raw material is the shareholding pattern every listed company files with the stock exchanges each quarter. NSE starts with total shares and subtracts every holding that falls into an excluded category, where that holding can be identified separately.
The 22 Shareholder Categories NSE Excludes
NSE's current guideline note, last updated on 22 April 2025, lists 22 categories excluded from the free float factor. Grouped for readability, they are:
Promoter and related holdings
- Shareholding reported under the promoter category
- Depository receipts (DRs) held by promoters and promoter groups
- Associate or group companies and cross-holdings
- Family members of the promoter
- Trusts managed by the promoter or promoter group companies
- Persons acting in concert with promoters
Insiders and board-linked holders
- Employee benefit trusts and employee welfare trusts
- Directors
- Key management personnel (KMP)
- A public shareholder that nominates a board member
- A public shareholder entitled to nominate a board member
- Holdings with a first right of refusal in favour of the company or promoters
Strategic and long-term investors
- Strategic investment by corporate bodies
- Central or state government holdings in a government-owned company (excluding insurance companies)
- Central or state government holdings in a company where government is not the promoter (excluding insurance companies)
- Foreign direct investment
- Private equity investors
- Private equity funds
- Foreign venture capital investors
- Sovereign wealth funds
Shares that cannot trade for now
- Shares under lock-in reported in the public category
- Shares held by the Investor Education and Protection Fund (IEPF)
Two details matter. The exclusions apply "where identifiable separately", so the IWF is only as good as the disclosure behind it. And the list goes well beyond promoters: a sovereign wealth fund or private equity investor can be excluded because its stake is strategic rather than freely traded.
NSE's Own XYZ Ltd Example, Step by Step
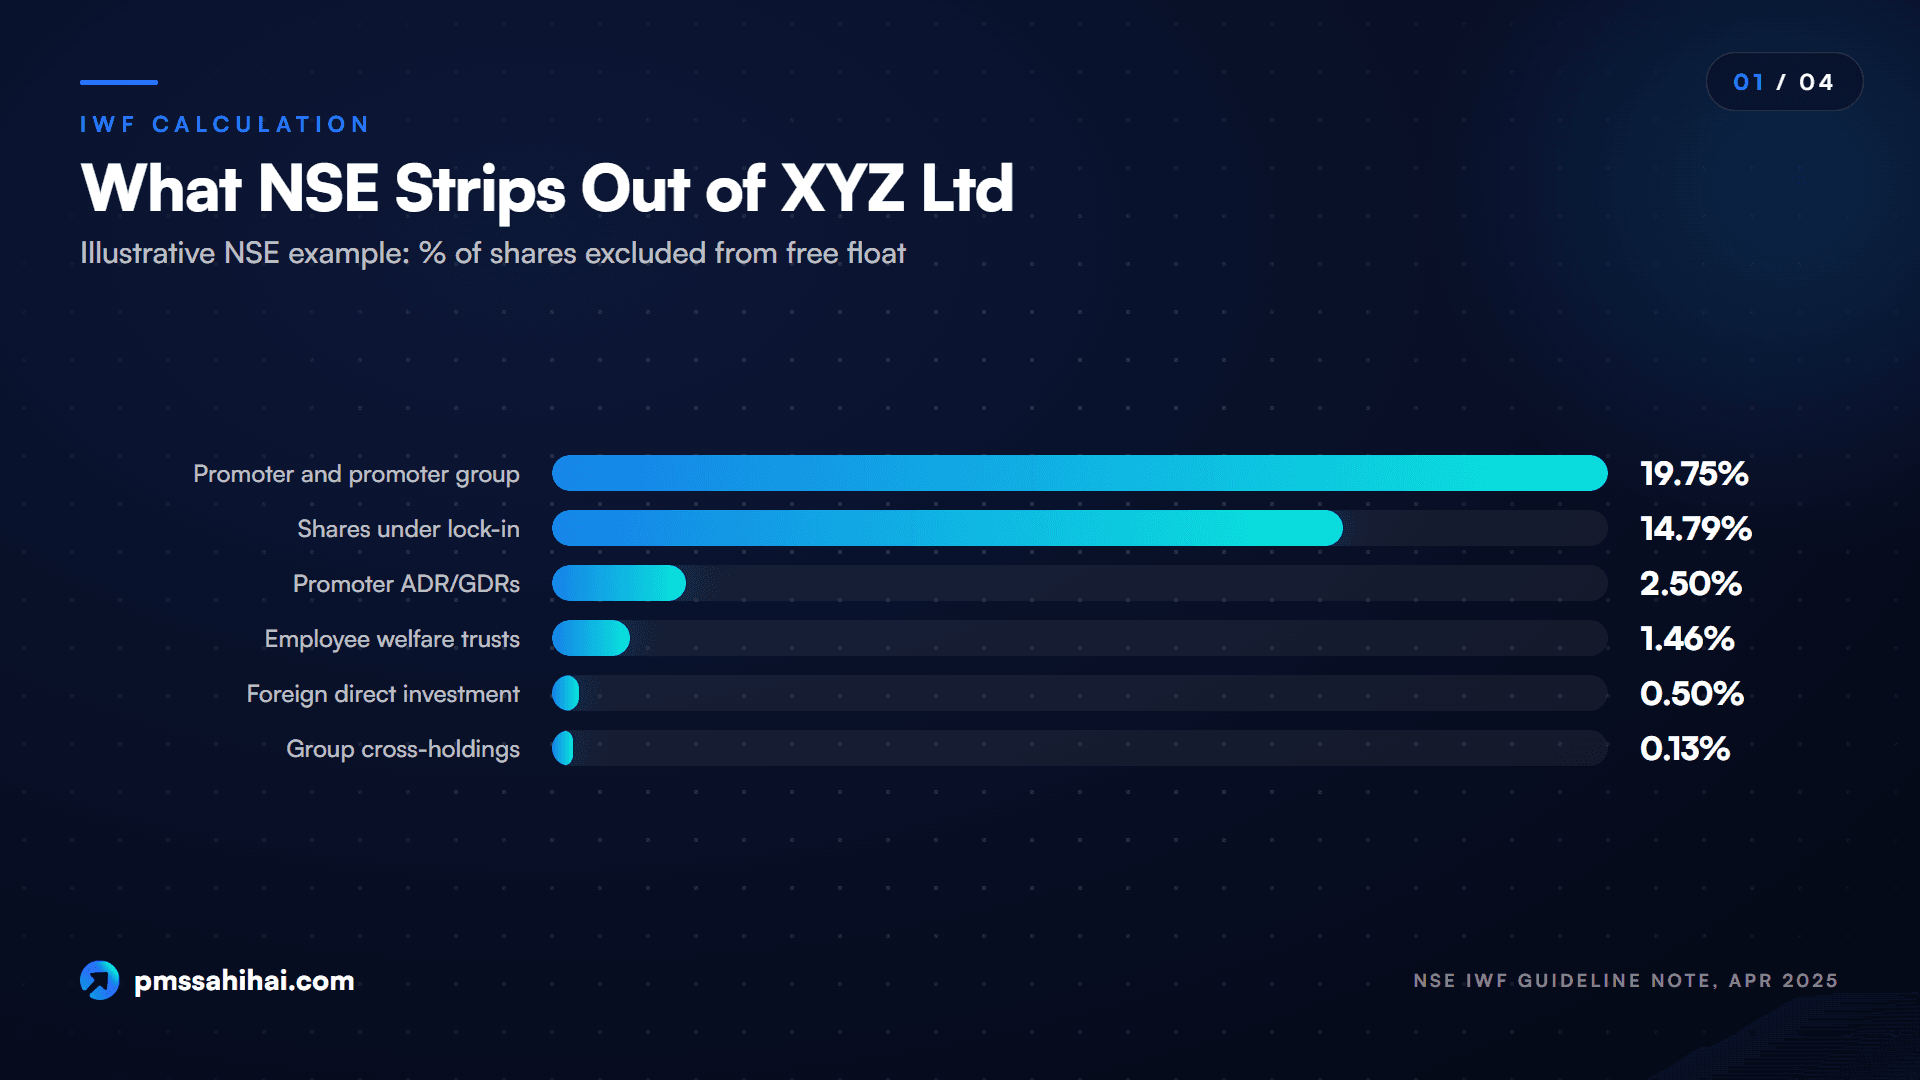
NSE illustrates the calculation with a hypothetical company, XYZ Ltd, that has 1,00,00,000 shares outstanding. The excluded holdings are:
| Holding | Shares | % of total |
|---|---|---|
| Promoter and promoter group | 19,75,000 | 19.75 |
| Foreign direct investment | 50,000 | 0.50 |
| Promoter shares held through ADR/GDRs | 2,50,000 | 2.50 |
| Associate/group company cross-holdings | 12,575 | 0.13 |
| Employee welfare trusts | 1,45,987 | 1.46 |
| Shares under lock-in | 14,78,500 | 14.79 |
The excluded total is 39,12,062 shares. Subtract that from 1,00,00,000 and you have 60,87,938 free float shares. Divide by total shares:
IWF = 60,87,938 ÷ 1,00,00,000 = 0.608794
NSE states that the IWF "will be rounded to six decimals". To finish the free float market cap calculation, assume XYZ trades at ₹500 (our assumption, not NSE's). Full market cap is ₹500 crore. Free float market capitalisation is ₹500 crore × 0.608794 = about ₹304.4 crore, and that is the figure that would enter a Nifty index.
Notice the lock-in line: nearly 15% of XYZ's shares cannot trade yet. When that lock-in expires, the IWF and the index weight rise at the next update, with no change in share price.
How Often the IWF Changes
Because the IWF comes from the shareholding pattern, it is refreshed as those quarterly filings arrive. IISL's 2009 announcements said the free float factor would be "updated based on the shareholding pattern submitted on a quarterly basis". Corporate events such as mergers, demergers and rights issues trigger their own adjustments under the methodology's corporate-action rules, with the index divisor adjusted so the index level does not jump.
A Worked Example With Real Nifty IWFs From 2009
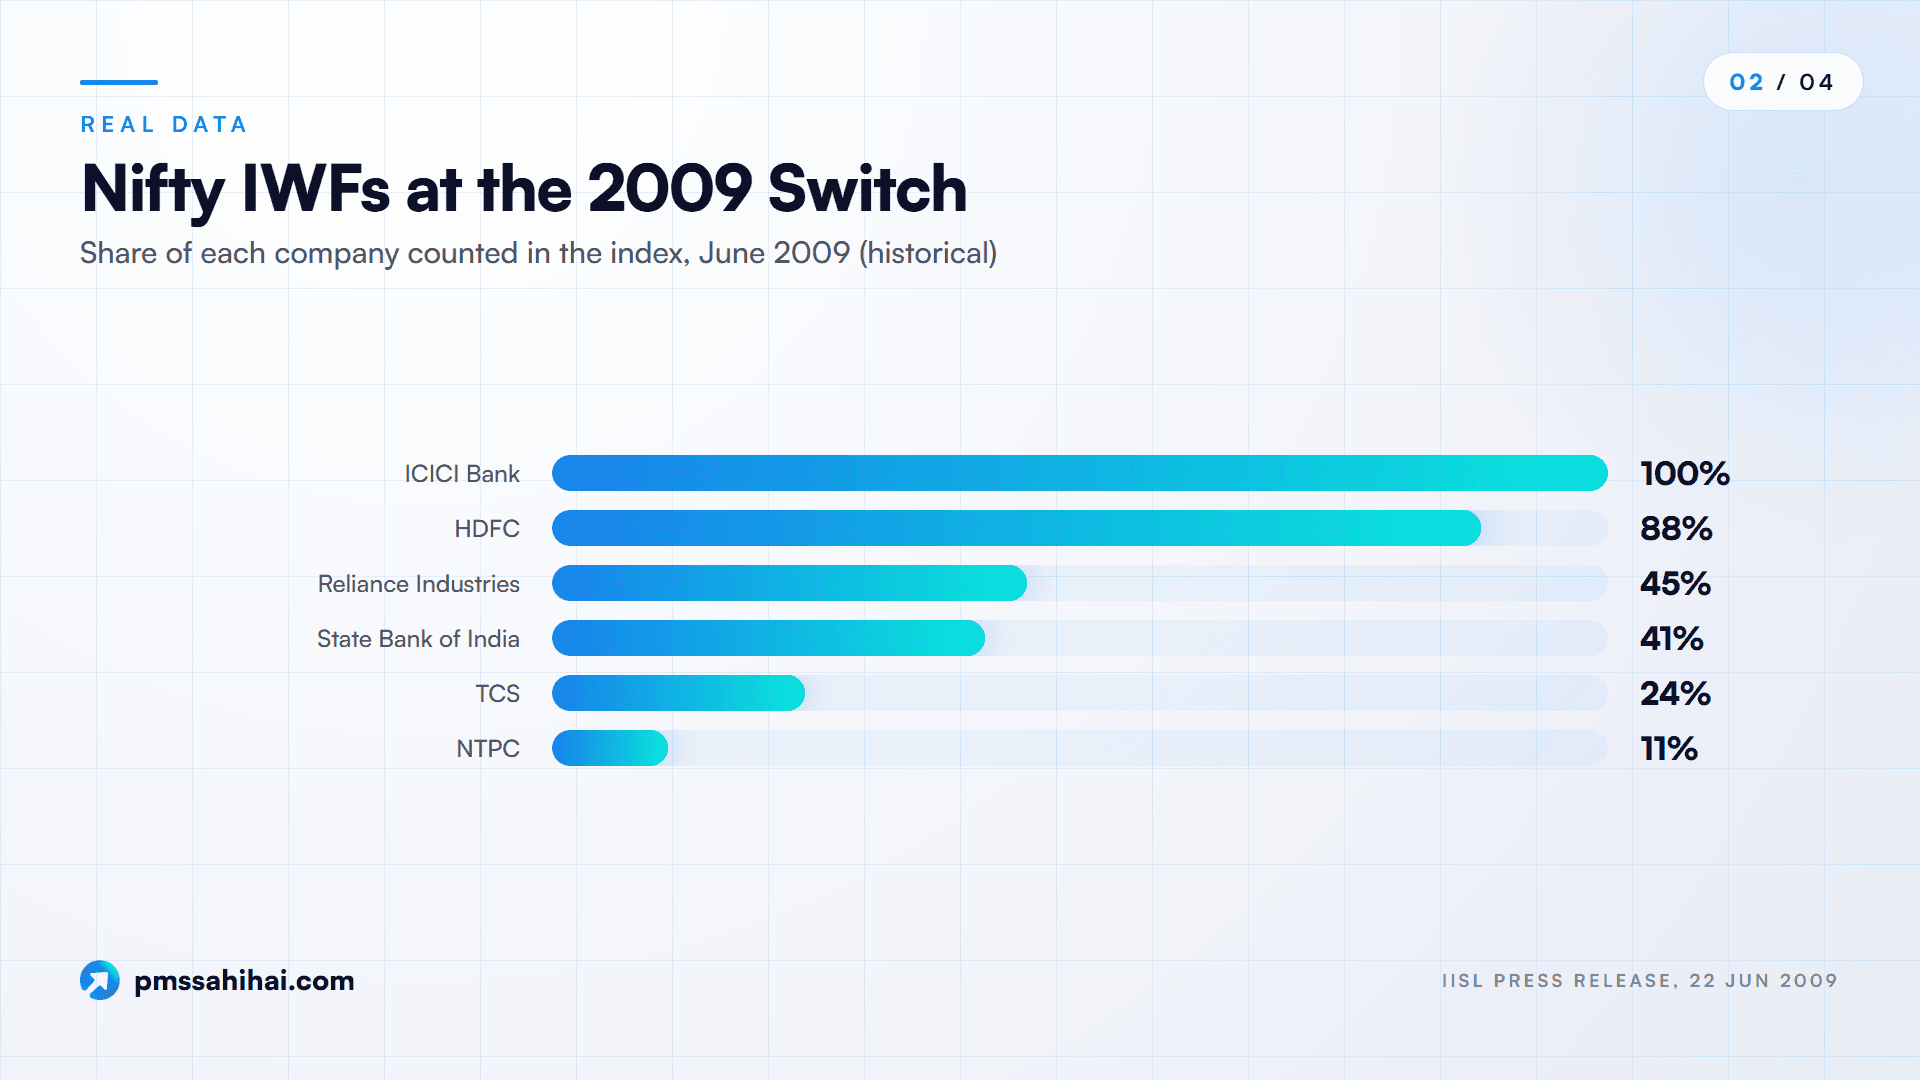
Hypothetical companies are useful, but real numbers show the scale. When the S&P CNX Nifty (now the Nifty 50) switched to free float on 26 June 2009, IISL published the IWF of every constituent in a press release dated 22 June 2009. A few of those figures:
| Company (2009) | IWF on 22 Jun 2009 | Share of market value counted |
|---|---|---|
| ICICI Bank | 1.000000 | 100% |
| Larsen & Toubro | 1.000000 | 100% |
| HDFC | 0.882700 | 88% |
| Infosys Technologies | 0.835056 | 84% |
| Reliance Industries | 0.452200 | 45% |
| State Bank of India | 0.405861 | 41% |
| TCS | 0.237868 | 24% |
| ONGC | 0.157700 | 16% |
| NTPC | 0.105007 | 11% |
These are historical figures from 2009 and will not match today's IWFs. They are useful because they show how sharply free float reshapes weights.
Take two companies with an identical full market value of ₹1,00,000 crore. One has an IWF of 1.000000, as ICICI Bank did; the other 0.237868, as TCS did. Under full-cap weighting they would carry equal weight. Under free float weighting, the first counts as ₹1,00,000 crore and the second as about ₹23,787 crore, so the first carries roughly 4.2 times the weight of the second. Push the IWF down to NTPC's 0.105007 and the same company counts as about ₹10,501 crore, close to a tenth of its full value.
Widely held companies scored at or near 1; those with a dominant promoter or government owner scored far lower. Free float market capitalisation measures what is investable, not who is biggest.
How Free Float Weighting Evolved in India
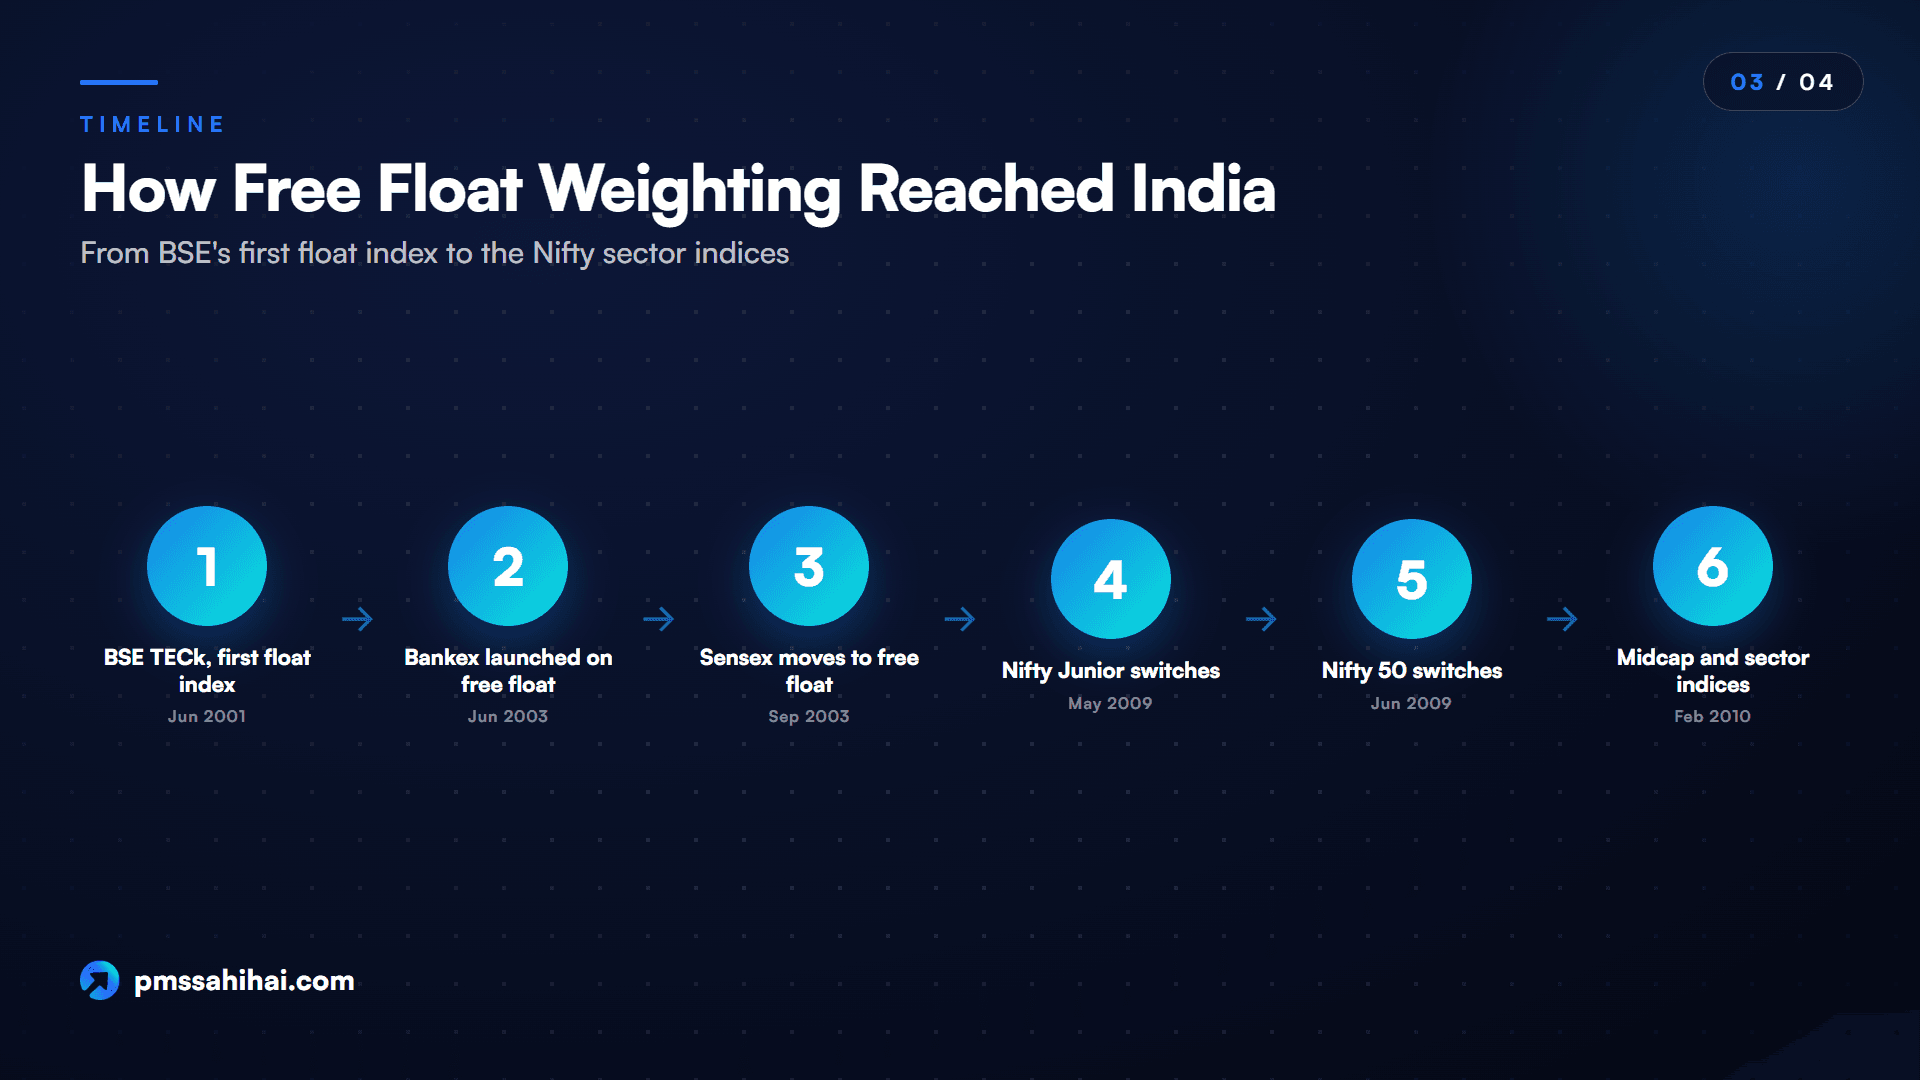
Free float did not arrive in India all at once. It came through a sequence of index launches and switches over about seven years, following moves already under way at global index providers.
Global Index Providers Moved First
By the early 2000s, global index families were moving to float adjustment. BSE's 2003 notice called free float the "globally accepted" methodology, and a 2010 Business Standard report said most major indices, including the S&P 500 and FTSE, had adopted it, with MSCI weighting by free float as well. S&P's US indices completed their shift in 2005, according to S&P announcements at the time.
BSE Sensex Switches in 2003
BSE moved first. According to its notice of 19 July 2003 (reproduced by Mondo Visione), BSE had launched the country's first free float index, BSE TECk, in June 2001, and the free-float-based Bankex in June 2003. The Sensex then moved from full market capitalisation to free float with effect from 1 September 2003, becoming the first broad-market index in India built on the method. BSE said the change would make it easier for foreign investors to benchmark their investments.
Nifty Follows in 2009 and 2010
NSE's index company, then called India Index Services & Products Ltd (IISL), announced on 24 March 2009 that the Nifty would move to free float. Business Standard reported the next day that the change covered the Nifty, the CNX Nifty Junior, the CNX 100 and the dollar-denominated Defty. Nifty Junior moved first, from 4 May 2009, and the S&P CNX Nifty became float-adjusted on 26 June 2009.
A second wave followed. IISL's release of 23 November 2009 said CNX IT, CNX Bank, CNX Midcap and Nifty Midcap 50 would move to free float from 26 February 2010. It promised there would be "no change to the index value on the date of transition", with the index divisor adjusted to keep the series continuous. The remaining full-cap indices were to follow in phases.
The other big push came from policy. In 2010 the government raised the minimum public shareholding for all listed companies to 25%, and Business Standard reported the expectation that this would raise India's free float and therefore its weight in global emerging-market indices. Higher float requirements and free float index methodology work together: the more shares that are public, the more of the market the index can count.
How NSE Applies Free Float in Nifty Indices Today
NSE Indices' methodology document (September 2026 edition) lists every broad-market Nifty index, from the Nifty 50 and Nifty 100 to the Nifty 500, Nifty Midcap 150, Nifty Smallcap 250, Nifty Microcap 250 and Nifty Total Market, as free float weighted. Sector indices such as Nifty Bank and Nifty Auto are too, with extra caps on single-stock weights (19% and 33% respectively).
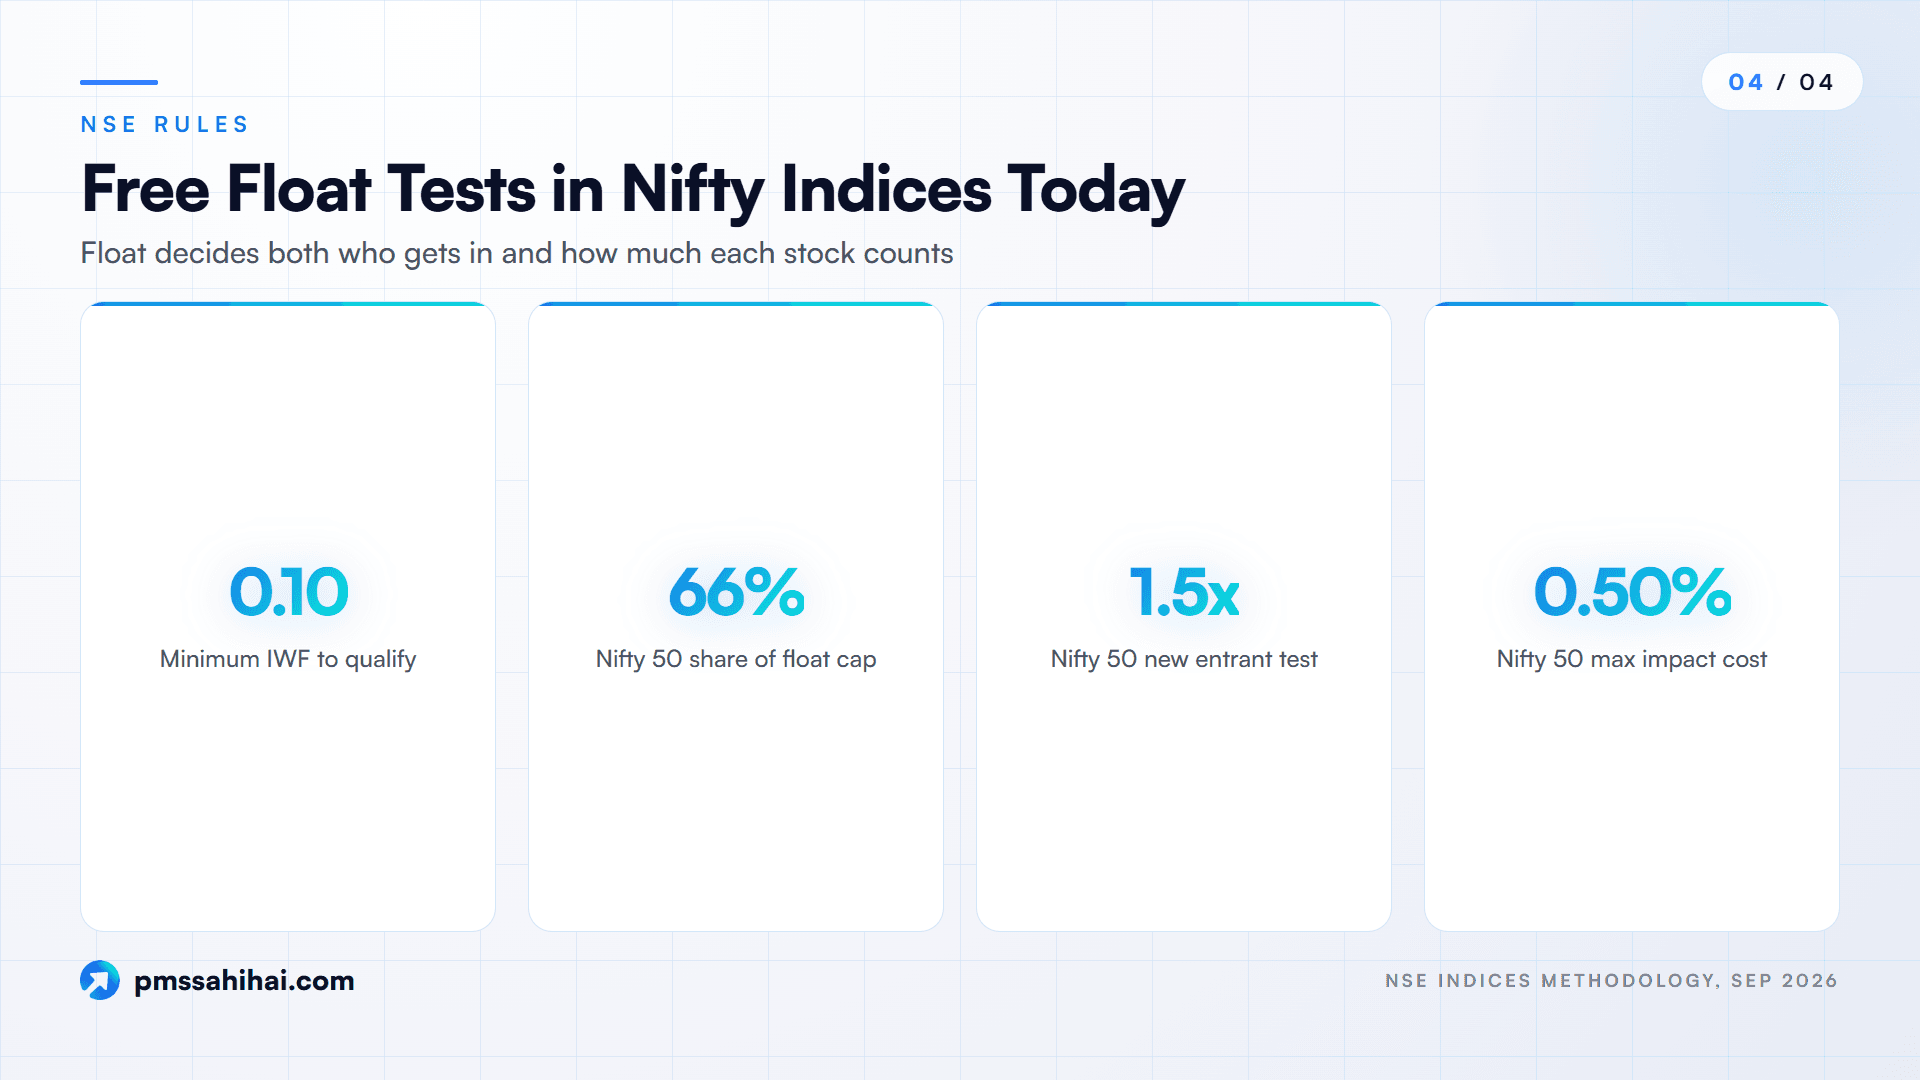
The methodology describes the Nifty 50 as "a 50 stock, float-adjusted market-capitalization weighted index" that captures about 66% of the float-adjusted market capitalisation of NSE. Its base date is 3 November 1995, with a base value of 1,000. Index providers also sit inside a regulatory frame now: in March 2024 the SEBI board approved a framework for index providers based on IOSCO benchmark principles, applying for now to "significant indices" SEBI notifies, and the SEBI (Index Providers) Regulations, 2024 followed.
The Index Calculation Formula
The formula is short:
Index value = Index market capitalisation ÷ Base market capitalisation × Base index value
where, for each stock, index market capitalisation = Shares outstanding × IWF × Capping factor × Price, summed across constituents.
Two settings make the same formula serve different indices. For a full market cap index, the IWF is set to 1. For an uncapped index, the capping factor is 1. So the IWF is literally the dial that converts a size-weighted index into a free float index.
Free Float Floors for Index Eligibility
Free float also decides who gets in. To enter the Nifty 500, Nifty 100 or Nifty Midcap 150 universe, a stock needs an IWF of at least 0.10 (10% free float), or a six-month average free float market capitalisation of at least 25% of the six-month average full market cap of the smallest existing constituent.
There is an interesting split here. For the Nifty 500 and Nifty 100, NSE ranks candidates by full market capitalisation (and turnover) to decide inclusion, but once a stock is in, its weight follows free float. Size gets you selected; float decides how much you count.
For the Nifty 50 itself, an eligible stock (a Nifty 100 constituent available in F&O) must have an average free float market capitalisation at least 1.5 times that of the smallest current constituent. It must also have traded on every day of the previous six months and show an impact cost of 0.50% or less for 90% of observations on a ₹10 crore basket. The index is reviewed semi-annually on data to January and July, changes take effect from the last trading day of March and September, and NSE gives four weeks' notice.
Foreign Investible Factor for FPI Indices
For foreign investors, even free float can overstate what they can buy, because many companies have foreign ownership limits. NSE handles this with a foreign investible factor (FIF), used in indices such as the Nifty India FPI 150 (base date 3 October 2022).
The FIF works in two steps. First, take the lower of the IWF and the company's foreign ownership limit (FOL). Then multiply by an adjustment factor based on the foreign room left. NSE's example: ABC Ltd has an IWF of 0.89 and an FOL of 74%, with 50% already used. The interim factor is 0.74, the foreign room is (74 − 50) ÷ 74 = 32%, which maps to an adjustment factor of 0.75, so the FIF is 0.555. On an average full market cap of ₹5,000 crore, ABC counts as ₹2,775 crore in a foreign-investible index.
How the Sensex Uses Free Float Methodology
The Sensex tracks 30 well-established BSE-listed companies. It has been published since 1 January 1986, with a base value of 100 set on 1 April 1979 and 1978–79 as its base year. Since September 2003, it has been calculated on free float market capitalisation.
The principle is the same as NSE's: each constituent's full market value is scaled by a free float factor derived from the shareholding pattern, and the index level reflects the total free float value of its members relative to the base period. BSE's free float methodology also excludes promoter and strategic holdings.
We have not reproduced BSE's banding or rounding rules because we could not verify the current text on BSE's website at the time of writing. For a stock's exact factor, use the index provider's own published files rather than a secondary summary.
Why Index Providers Prefer Free Float Weighting
NSE's own statement on investible weight factors sets out the case clearly. Free float methodology is "globally regarded as an ideal methodology for calculation of equity indices", and the reasons follow from it.
- It makes the index investable. An index weighted by full market cap would ask a fund to buy shares that are not for sale. Weighting by free float market capitalisation limits each company's influence "to the extent of its actual free float", so a fund can hold the index in practice.
- It reduces the pull of locked-up holdings. NSE says the method "reduces influence of large promoter/strategic holding (which generally is not available for trading) on the index". A company that is 75% owned by its promoter cannot dominate the index on the strength of shares no one can buy.
- It helps passive funds track closely. Index funds and ETFs can replicate free float weights with lower tracking error because the weights match available supply.
- It gives active managers a fair yardstick. NSE notes that active managers can compare their portfolios against an investable index. A manager who beats an index that could not actually be bought has not proven much.
- It matches global practice. Indian free float indices line up with the method used by the S&P 500, FTSE and MSCI indices, which makes cross-border benchmarking simpler.
- It is rule-based and transparent. The IWF comes from public shareholding-pattern data and a published list of 22 exclusions, so anyone can check the logic.
How Free Float Makes Investing Decisions Easier
Free float sounds like index plumbing, but it answers everyday questions.
Reading index weights. When a large, promoter-heavy company carries a smaller Nifty weight than you expected, the IWF usually explains why. You do not need to suspect an error; check the free float.
Understanding index fund flows. When a promoter sells a stake through an offer for sale, or a lock-in ends, the stock's free float rises. At the next IWF update its index weight rises too, and passive funds buy more. That flow comes from the methodology, not from a change in the business.
Interpreting "overweight" and "underweight". When a fund or PMS factsheet says a strategy is overweight a stock versus the Nifty 50, the comparison is against that stock's free float weight. A manager holding 5% of a company with a 2% free float weight is making a meaningful bet, even if the company's full market cap would suggest it "should" be bigger.
Spotting investability limits early. The 10% IWF floor and the Nifty 50's 1.5x free float test explain why some very valuable companies sit outside major indices or join only after promoters dilute.
How PMS Sahi Hai Helps You Read Free Float Benchmarks
PMS Sahi Hai does not publish IWFs or explain index construction; that is NSE's and BSE's job, and their documents are the right reference. What the platform does is put the benchmark next to every number, which is exactly where free float matters for a PMS investor.
Every return comes with its benchmark. The homepage promise is that "if we show you a return, you also see the period, the benchmark, and where the figure came from." On a strategy page such as Marcellus Rising Giants, the stated benchmark (listed as the "S&P BSE 500 Total Return Index") sits beside the 3-year CAGR and an "index" comparison, so you can see the strategy against a free float weighted yardstick at a glance.
Filter by benchmark. The compare shelf lets you slice strategies by category, fund house, benchmark, size or style, and pin up to four side by side. Grouping strategies that share a broad free float index makes relative performance easier to read.
Nyra scores the gap, not the headline. The Nyra methodology gives 30% of the Nyra Score to return performance, defined as excess return over the strategy's stated benchmark across 1, 3 and 5 years, and another 15% to consistency, meaning how often it beat that benchmark. Downside protection, which carries 20%, includes beta. If the benchmark is a free float index, the score is effectively asking whether the manager's active bets against free float weights paid off. Nyra is an analytical tool, not a SEBI-registered investment adviser.
Context on benchmark choice. Published insights on benchmark selection in PMS and which PMS categories beat their benchmark in 2026 cover the next question: whether the index a manager picked fits the strategy's universe.
Limitations of Free Float Market Capitalisation
Free float is the right tool for index construction, but it has real limits.
- It can understate economic size. A company with a large promoter holding can be a major business and still carry a small index weight. Free float measures investability, not importance in the economy.
- It depends on disclosure. NSE excludes categories "where identifiable separately". If a strategic holder is not separately identifiable in the shareholding pattern, its stake may still count as float.
- It updates with a lag. IWFs move with quarterly shareholding patterns. Between updates, a large stake sale or lock-in expiry can leave index weights temporarily out of step with reality, and the catch-up creates rebalancing trades.
- Float is not liquidity. A large free float does not guarantee active trading. That is why NSE screens Nifty 50 candidates separately on impact cost and trading frequency.
- Ownership events move weights. Promoter sales, stake purchases and lock-in expiries change index weights and passive flows even when nothing about the business has changed.
- It needs extra adjustments for some investors. For foreign portfolio investors, foreign ownership limits can bind before free float does, which is why NSE created the FIF.
Free Float Myths Worth Correcting
Several claims appear repeatedly on pages that rank for this topic. Here is what the primary sources say.
Myth: NSE rounds the IWF up to the next 0.05. At least one ranking glossary says so. NSE's current guideline note says the IWF "will be rounded to six decimals", and its own worked example produces 0.608794. The 2009 IWF list also shows six-decimal values such as 0.405861.
Myth: Free float just means "everything except promoters". NSE's list has 22 categories. Directors, key management personnel, employee welfare trusts, sovereign wealth funds, private equity, FDI and locked-in public shares are all excluded where identifiable.
Myth: IWFs are revised once or twice a year. The index review for the Nifty 50 is semi-annual, but the IWF is based on quarterly shareholding patterns. Those are two different processes.
Myth: The biggest company always has the biggest index weight. Weight follows free float market capitalisation. In 2009, a company with TCS's IWF of 0.237868 counted at under a quarter of its full value.
What Free Float Means for Your PMS Benchmark
Most equity PMS strategies in India compare themselves against broad Nifty or BSE indices, and every broad-market Nifty index is free float weighted. That has three practical consequences for a PMS investor.
First, the benchmark is investable. If a manager reports beating the Nifty 500, the comparison is against a portfolio that could genuinely have been bought, which makes it a fair test.
Second, active bets are measured against free float weights. A concentrated PMS that holds 15 or 25 stocks will naturally look very different from a 500-stock free float index. The question is whether its overweights and underweights relative to free float weights are deliberate and paying off.
Third, ownership changes in benchmark heavyweights can move the benchmark itself. Large promoter stake sales or lock-in expiries raise free float, increase index weights and pull passive money in. A manager who understands those flows can read the benchmark more clearly.
Free float market capitalisation quietly decides how much each company counts, who qualifies for an index, and what "beating the market" means. Learn to read the IWF and every index weight makes more sense. When you compare strategies on PMS Sahi Hai, or ask Nyra how a manager has done against its benchmark, that free float yardstick is what sits on the other side of the comparison.
Compare PMS Benchmarks Against the Right Index With PMS Sahi Hai
Free float tells you how an index is built. The next step is checking how your PMS stacks up against that index, over the right period and net of fees. On PMS Sahi Hai's PMS comparison you can pin up to four strategies and see each one's benchmark, returns and drawdowns side by side, then ask Nyra how consistently a manager has beaten its stated benchmark. If you would rather talk it through, the team offers a 15-minute call with no upfront fees.
PMS Sahi Hai is a distributor of Portfolio Management Services and Alternative Investment Funds, APMI-registered (Registration No. APRN08358). This article is for education only and is not investment advice, a recommendation, or an offer to buy or sell any security. Investments in securities markets are subject to market risks; read all scheme-related documents carefully. Past performance is not indicative of future results. Consult your advisor before investing.
Ishaan founded PMS Sahi Hai to make India's PMS, AIF and GIFT City markets legible to serious investors, comparing every SEBI-registered manager on the same comparative basis, with no shelf products and no commission bias.
Frequently asked
What is free float market capitalisation?
Free float market capitalisation is the market value of only those shares available for public trading. It equals share price times total shares times the investible weight factor (IWF). Shares held by promoters, governments as strategic investors, private equity, FDI holders, employee trusts, directors and locked-in shareholders are excluded where identifiable. Indian indices such as the Nifty 50 and Sensex use it to set constituent weights.
What is the investible weight factor (IWF)?
The investible weight factor is NSE's free float factor: a number between 0 and 1 showing what share of a company's equity is available for trading. NSE calculates it from the quarterly shareholding pattern by subtracting 22 excluded categories of holdings from total shares and dividing by total shares. An IWF of 0.60 means 60% of the company's market value counts in a Nifty index.
How is free float market capitalisation calculated?
Start with total shares outstanding and subtract excluded holdings such as promoter, strategic, government, FDI, private equity and locked-in shares. Divide the remainder by total shares to get the IWF, rounded to six decimals. Then multiply the share price by total shares by the IWF. In NSE's example, XYZ Ltd's IWF works out to 0.608794, so about 61% of its market value counts.
When did the Sensex and Nifty switch to free float?
The Sensex moved from full market capitalisation to free float methodology with effect from 1 September 2003, after BSE TECk (June 2001) and Bankex (June 2003) were launched on free float. The Nifty followed on 26 June 2009, announced by IISL on 24 March 2009. CNX IT, CNX Bank, CNX Midcap and Nifty Midcap 50 moved on 26 February 2010.
Does NSE round the IWF to the nearest 0.05?
No. NSE's guideline note on investible weight factors states that the IWF is rounded to six decimals. Its worked example gives an IWF of 0.608794, and the IWFs published in June 2009 for Nifty constituents also carry six decimals, such as 0.405861 for State Bank of India. Pages that describe 0.05 steps do not match NSE's current published rule.
What is the minimum free float for a stock to enter Nifty indices?
For the Nifty 500, Nifty 100 and Nifty Midcap 150 universes, a stock needs an IWF of at least 0.10, meaning 10% free float, or a six-month average free float market cap of at least 25% of the smallest constituent's full market cap. For the Nifty 50, a candidate's average free float market cap must also be at least 1.5 times the smallest existing constituent's.
How often does a company's free float factor change?
NSE bases the IWF on the shareholding pattern that companies file with the exchanges every quarter, so the free float factor can change each quarter. Corporate actions such as mergers or demergers have their own adjustment rules. This is separate from the Nifty 50's semi-annual review, which decides which companies are in the index rather than how much each one counts.
Why does free float market capitalisation matter for PMS investors?
Most PMS strategies are benchmarked against broad indices such as the Nifty 50 or Nifty 500, and those are weighted by free float. That means a manager's overweights and underweights are measured against free float weights, and the benchmark is a portfolio that could genuinely be bought. Understanding free float helps you judge whether outperformance reflects skill against a fair, investable yardstick.
Keep reading
All articles
What Is Market Capitalization? Formula, SEBI Cap Bands and PMS Use
Market capitalization explained: the formula, SEBI's large, mid and small cap ranks, AMFI's June 2026 cut-offs and why it matters for PMS investors.
What Are Trailing Returns? How the As-of Date Changes the Number
Trailing returns explained: how they are calculated, why the as-of date moves the number, and how to read 1Y, 3Y and 5Y figures in a factsheet.

Passive Management in PMS: Can a Portfolio Manager Just Track an Index?
Can a PMS be passive? Index replication, direct indexing, rule-based models, SEBI's rules and what a passive PMS costs against a 0.04% ETF.
Read it. Now pressure-test it.
Ask Nyra how this applies to your portfolio, or talk to our team, no pitch, no pressure.