
What Are Trailing Returns? How the As-of Date Changes the Number
Trailing returns explained: how they are calculated, why the as-of date moves the number, and how to read 1Y, 3Y and 5Y figures in a factsheet.

Trailing returns measure performance over a fixed period, such as one, three or five years, that ends on a recent date: the latest NAV or the last month-end. In other words, a trailing return is a point-to-point return whose end date is "today". Periods of a year or more are normally annualised, and shorter ones are not. Because the end date keeps moving, the same fund can show a very different 1-year number a month later without anything changing in the portfolio: the Nifty 50's 1-year price return went from -4.65% at the end of September 2025 to +6.27% a month later. Read the as-of date first, check the benchmark on the same date, and treat the table as one snapshot.
Why Every Return Table Has a Hidden Date
Open almost any fund page and you will find a small table: 1 month, 3 months, 6 months, 1 year, 3 years, 5 years, since inception. Each cell holds a percentage, and the fund's figure usually sits next to its benchmark's. It looks like a complete record of how the fund has done.
What the table rarely makes obvious is that every one of those numbers depends on a single date. That date is the "as of" date: the last day included in the calculation. Change it and every cell moves, sometimes by a lot.
Trailing returns are the most common way performance is shown to investors in India, from mutual fund apps to portfolio management service (PMS) factsheets. They are useful and easy to read. They are also easy to misread, because the moving end date makes them look more stable and more comparable than they are.
This guide covers what trailing returns are, how they are calculated (including the date rules most explainers skip), why a single month can flip a 1-year figure from negative to positive, and how to read a trailing table with care. The worked examples use invented NAVs unless stated. The market example uses actual Nifty 50 month-end closes.
If you want the broader idea of returns measured between any two chosen dates, we have a separate explainer on point-to-point returns. This piece stays with the special case where the end date is "now".
What Trailing Returns Mean in Plain Terms
A trailing return is the change in an investment's value over a fixed look-back period that ends on the most recent available date. A 1-year trailing return as of 30 October 2026 compares the value on that date with the value one year earlier. A 3-year trailing return on the same date reaches back three years.
The word "trailing" describes the direction: you stand at the end date and look back. The end point is fixed at the present, and the start point is set by the length of the period. Next month, both points slide forward by a month.
The standard trailing periods
Most tables use a familiar menu of periods:
| Period | Start point | Usually shown as |
|---|---|---|
| 1 month, 3 months, 6 months | Same day 1, 3 or 6 months earlier | Absolute (not annualised) |
| Year to date (YTD) | Last day of the previous calendar year | Absolute |
| 1 year | Same day one year earlier | Absolute, which equals the annual rate |
| 3, 5 and 10 years | Same day 3, 5 or 10 years earlier | Annualised (CAGR) |
| Since inception | Launch date or first NAV | Annualised if over one year |
YTD is the odd one out. Its length changes through the year: in February it covers about two months, in November about ten. A YTD figure in March and one in November are not comparable with each other.
Trailing returns are point-to-point returns ending today
There is no separate formula for trailing returns. They are point-to-point returns with one restriction: the end date must be the latest date, not any date you choose. Value Research describes trailing returns as "also known as point-to-point returns", and that is accurate. The difference is only in how the dates are picked.
That restriction matters for interpretation. A point-to-point return between two arbitrary past dates answers a historical question: what happened between those dates? A trailing return answers a question about the present: what has this fund done for someone who invested exactly one, three or five years ago and is still holding today?
This also explains why some pages call a figure "trailing" when it is not. A return from 1 January 2023 to 15 September 2024 is a point-to-point return. It only becomes a trailing return if 15 September 2024 is the latest date in the data.
Where the Trailing Return Convention Came From
The arithmetic is ordinary compound growth, so there is no single inventor. What developed over time were the conventions: which end date to use, which periods to show and when to annualise.
- Fund data providers standardised month-end tables. Morningstar's published performance methodology calculates point-to-point returns over one to ten years ending at each month-end. It annualises periods of a year or more and reports one, three and six-month figures without annualising them.
- Global performance standards drew a line at one year. The 2020 Global Investment Performance Standards (GIPS), a voluntary code for investment firms, state that returns for periods of less than one year must not be annualised.
- Advertising rules fixed the periods. In the United States, the SEC's marketing rule requires adviser advertisements that show performance to include one, five and ten-year periods ending no earlier than the most recent calendar year-end.
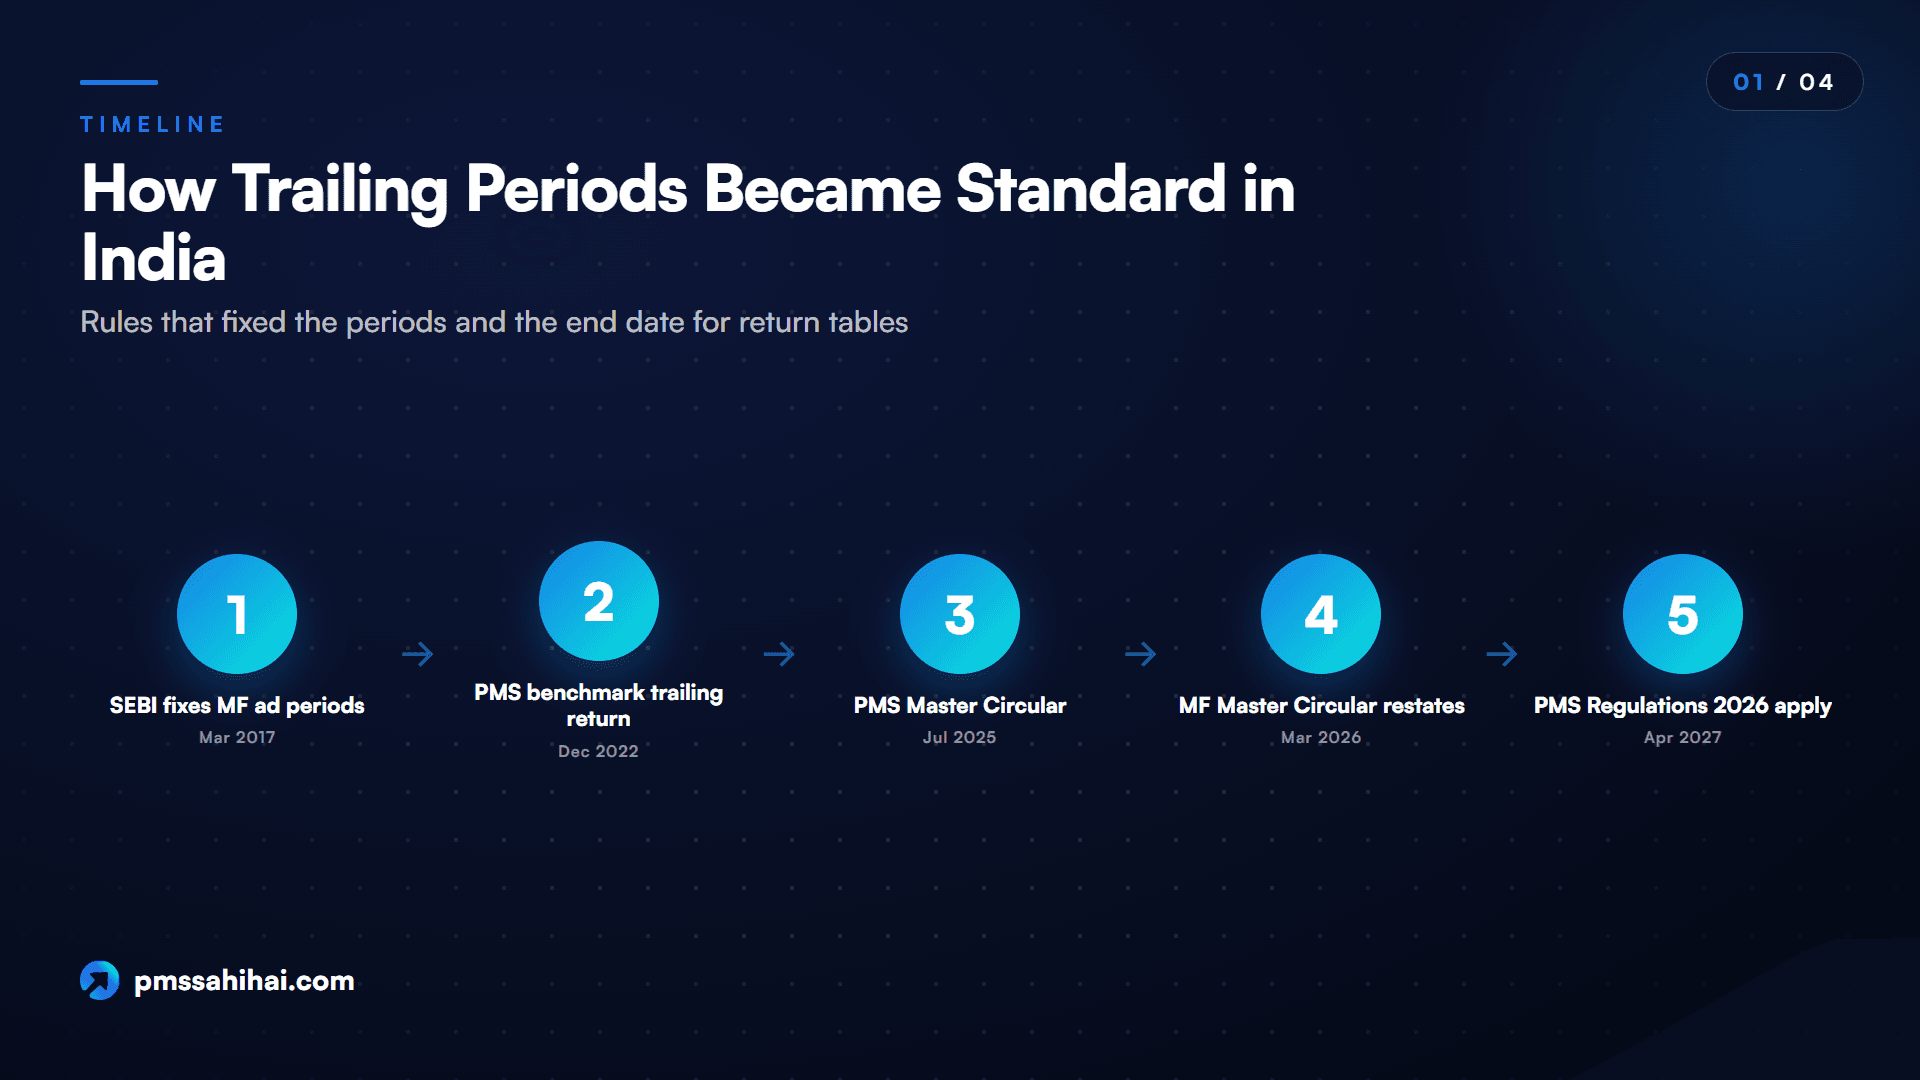
- India set month-end ends for fund ads. SEBI's circular of 15 March 2017 required mutual fund ads to show CAGR for 1, 3 and 5 years and since inception, based on the period ending on the last day of the month before the ad. The Master Circular for Mutual Funds dated 20 March 2026 keeps this at paragraph 14.2.1.
- PMS reporting adopted the term itself. A SEBI circular of 16 December 2022 required portfolio managers to show the time-weighted rate of return (TWRR) of an investment approach "along with the trailing return of the selected benchmark". This now sits at paragraph 5.6.1 of the Master Circular for Portfolio Managers dated 16 July 2025.
Each step had the same aim: make the numbers comparable by fixing the periods and the end date, so a fund house cannot pick a flattering window. The SEBI (Portfolio Managers) Regulations, 2026 take effect on 1 April 2027, so check PMS reporting details after that date.
How to Calculate Trailing Returns Step by Step
The trailing return formula has two forms, depending on the period length.
For periods under a year, use the absolute return:
Trailing return = (End value / Start value) - 1
For periods of a year or more, annualise it:
Annualised trailing return = (End value / Start value)^(1 / years) - 1
That second line is the CAGR formula, which our CAGR guide covers in depth. The end value is the NAV (or index level) on the as-of date. The start value is the NAV on the matching date at the start of the period.
A worked trailing returns table
Here is how to calculate trailing returns for a hypothetical equity fund. Its NAV on 30 October 2026, the last business day of the month, is Rs 250.00. It launched on 1 January 2019 at Rs 100.
| Period | Start date | Start NAV | Total change | Annualised |
|---|---|---|---|---|
| 1 month | 30 Sep 2026 | 246.10 | +1.58% | Not annualised |
| 3 months | 31 Jul 2026 | 238.40 | +4.87% | Not annualised |
| 6 months | 30 Apr 2026 | 231.00 | +8.23% | Not annualised |
| YTD | 31 Dec 2025 | 236.50 | +5.71% | Not annualised |
| 1 year | 31 Oct 2025 | 228.00 | +9.65% | 9.65% |
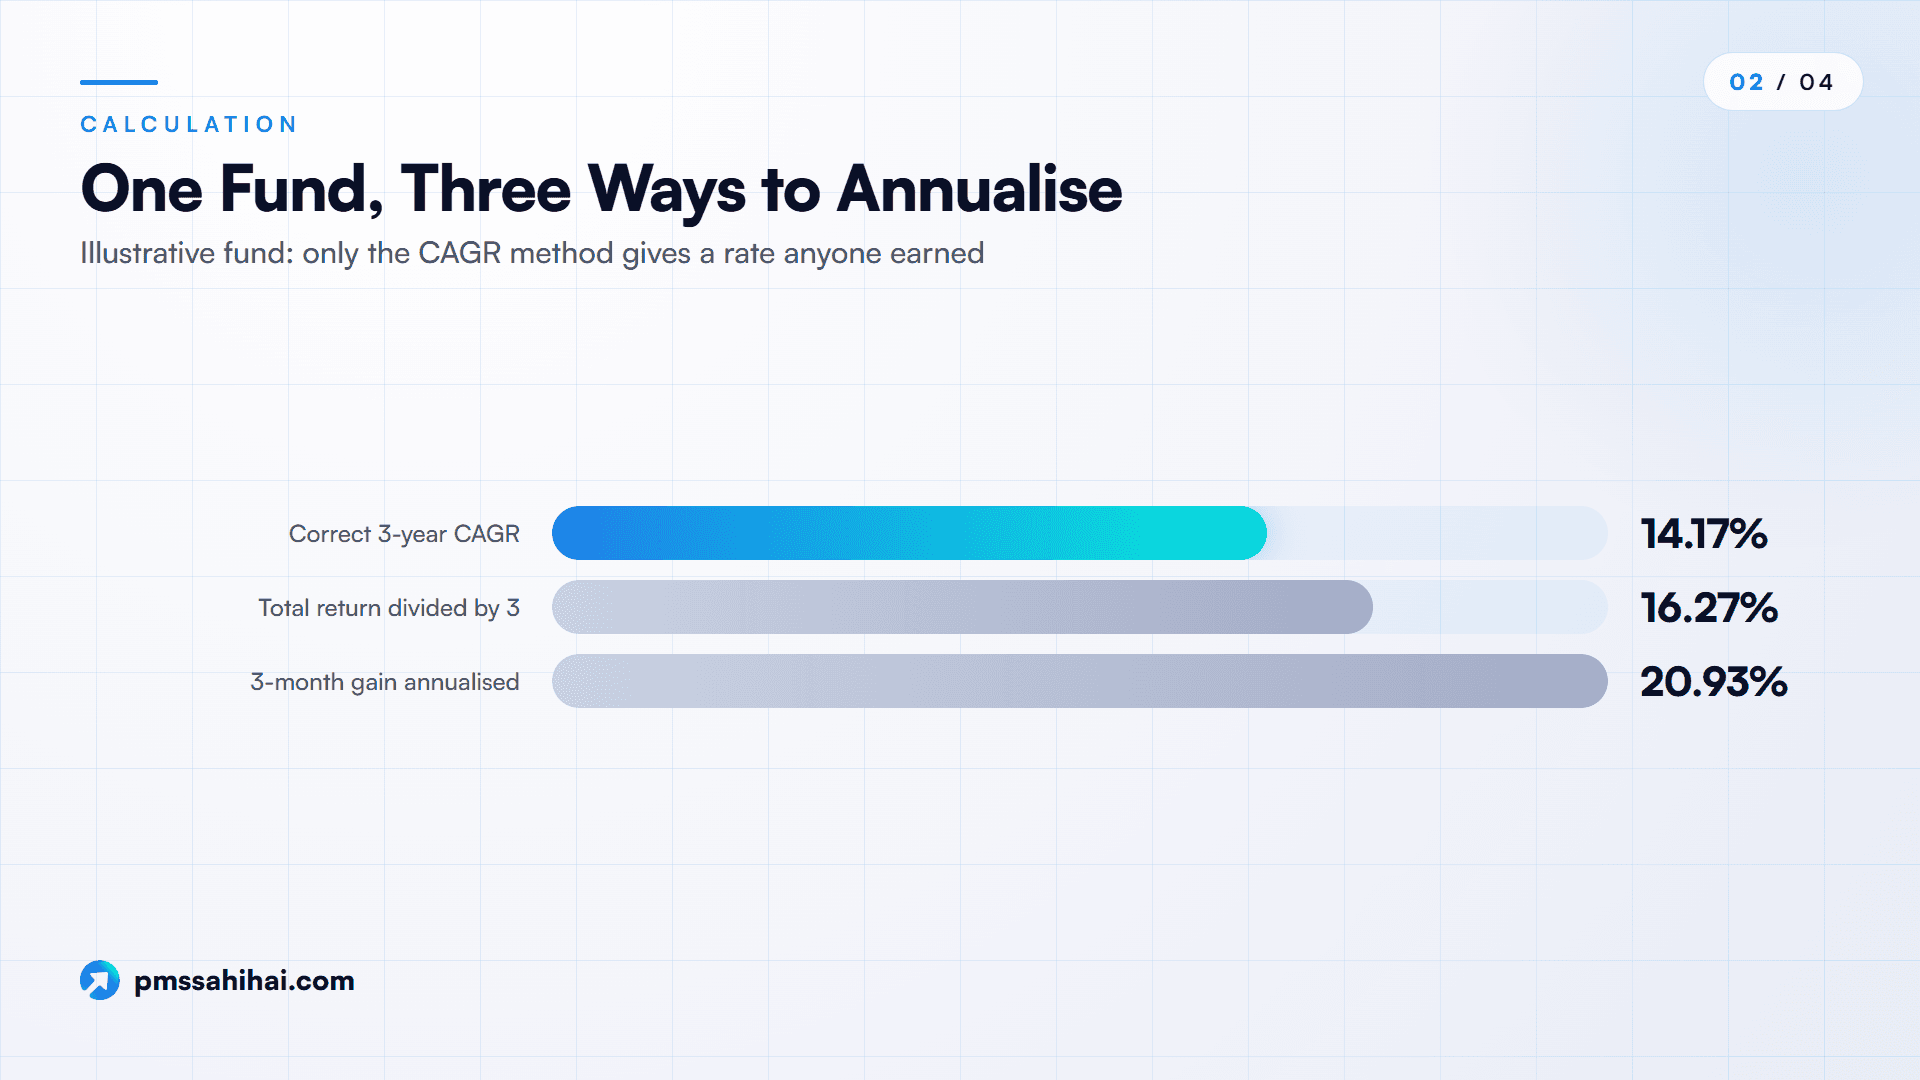
| 3 years | 31 Oct 2023 | 168.00 | +48.81% | 14.17% a year |
| 5 years | 29 Oct 2021 | 139.00 | +79.86% | 12.46% a year |
| Since inception | 1 Jan 2019 | 100.00 | +150.00% | 12.41% a year |
Take the 3-year row. Divide 250 by 168 to get 1.4881. Raise that to the power of one-third to get 1.1417. Subtract one: 14.17% a year.
Two shortcuts give the wrong answer. Dividing the 48.81% total by three gives 16.27%, which overstates the annual rate because it ignores compounding. Annualising the 3-month gain of 4.87% gives 20.93% a year, a figure nobody earned. Morningstar's methodology explains why it avoids that: annualising shorter-term returns "may imply that the returns are generally sustainable".
The since-inception row uses days rather than whole years, because the fund has existed for 2,859 days. The annual rate is (250 / 100)^(365 / 2,859) - 1, which is 12.41%. Morningstar's documented version divides the days by 365.25 to allow for leap years. On this example both give the same rounded result.
Date rules that change the answer
The formula is the easy part. The start date is where different sites quietly diverge.
- Non-business days. 31 October 2021 was a Sunday, so there is no NAV for that date. The table above uses the last NAV on or before it, 29 October 2021. Some providers use the next available NAV instead. Over five years the difference is small, but over one month it can be large.
- Month-end clamping. One month before 31 March has no 31st, so the start date becomes 28 or 29 February. One year before 29 February 2024 becomes 28 February 2023.
- Month-end vs same-day. A month-end series compares the last NAV of October 2026 with the last NAV of October 2025. A daily series run on 4 November compares 4 November with 4 November. The next section covers why this choice matters.
- Plan and income treatment. A growth-plan NAV includes reinvested income. An income distribution (IDCW) NAV drops when a payout is made, so using it without adding back payouts understates the return. Regular and direct plans have different costs, so their trailing figures differ too.
In a spreadsheet, list dates in column A and NAVs in column B. If the as-of date is in D1, the start date for a 1-year figure is EDATE(D1, -12). To pick the last NAV on or before that date, use XLOOKUP(EDATE(D1,-12), A:A, B:B, , -1). The 1-year trailing return is then the as-of NAV divided by that value, minus one. For three years, use EDATE(D1, -36) and raise the ratio to the power of 1/3.
Building trailing returns from monthly returns
A PMS does not publish a daily NAV the way a mutual fund does. Performance is usually reported as a series of monthly time-weighted returns. To get a trailing figure from that series, link the months rather than adding them.
Suppose the last three monthly returns are +2.0%, -3.0% and +1.5%. The 3-month trailing return is 1.020 x 0.970 x 1.015 - 1, which is +0.42%. Adding them gives +0.5%, which is close here but drifts further from the truth as returns get larger. For a 1-year trailing figure, link the last twelve months the same way. For three years, link 36 months and annualise the result.
Choosing the As-of Date: Latest NAV or Month-End
Every trailing table has an as-of date, and there are two common conventions.
Latest NAV. Many fund apps recalculate trailing returns every day from the most recent NAV. This is current, but it means the figure you see on Tuesday differs from Monday's. Two people looking at the same fund on different days will see different numbers.
Last month-end. Factsheets, regulatory reports and most comparison tables use the last business day of a month. SEBI's Master Circular for Mutual Funds requires ads to compute periods from the last day of the month before the ad. Under the Master Circular for Portfolio Managers, PMS managers report monthly to SEBI and to the Association of Portfolio Managers in India (APMI), within seven working days of month-end. Month-end figures stay fixed for a month, so they are easier to compare.
Mixing the two is a common error. Imagine a fund's 1-year return taken from an app on 4 November and its benchmark's 1-year return taken from a factsheet dated 30 September. The two figures cover different windows. The gap between them says as much about the dates as about the manager.
Before comparing any two trailing figures, check:
- Both have the same as-of date.
- Both use the same convention (month-end or daily).
- Both are the same type: total return index for the benchmark, growth plan for the fund.
- Both are net of the same costs. Mutual fund NAVs are after the expense ratio. PMS performance must be reported net of all fees and all expenses under a SEBI circular of 13 February 2020.
If a table does not print its as-of date, ask for it. A trailing return without a date is incomplete.
How One Month Can Flip a Trailing Return
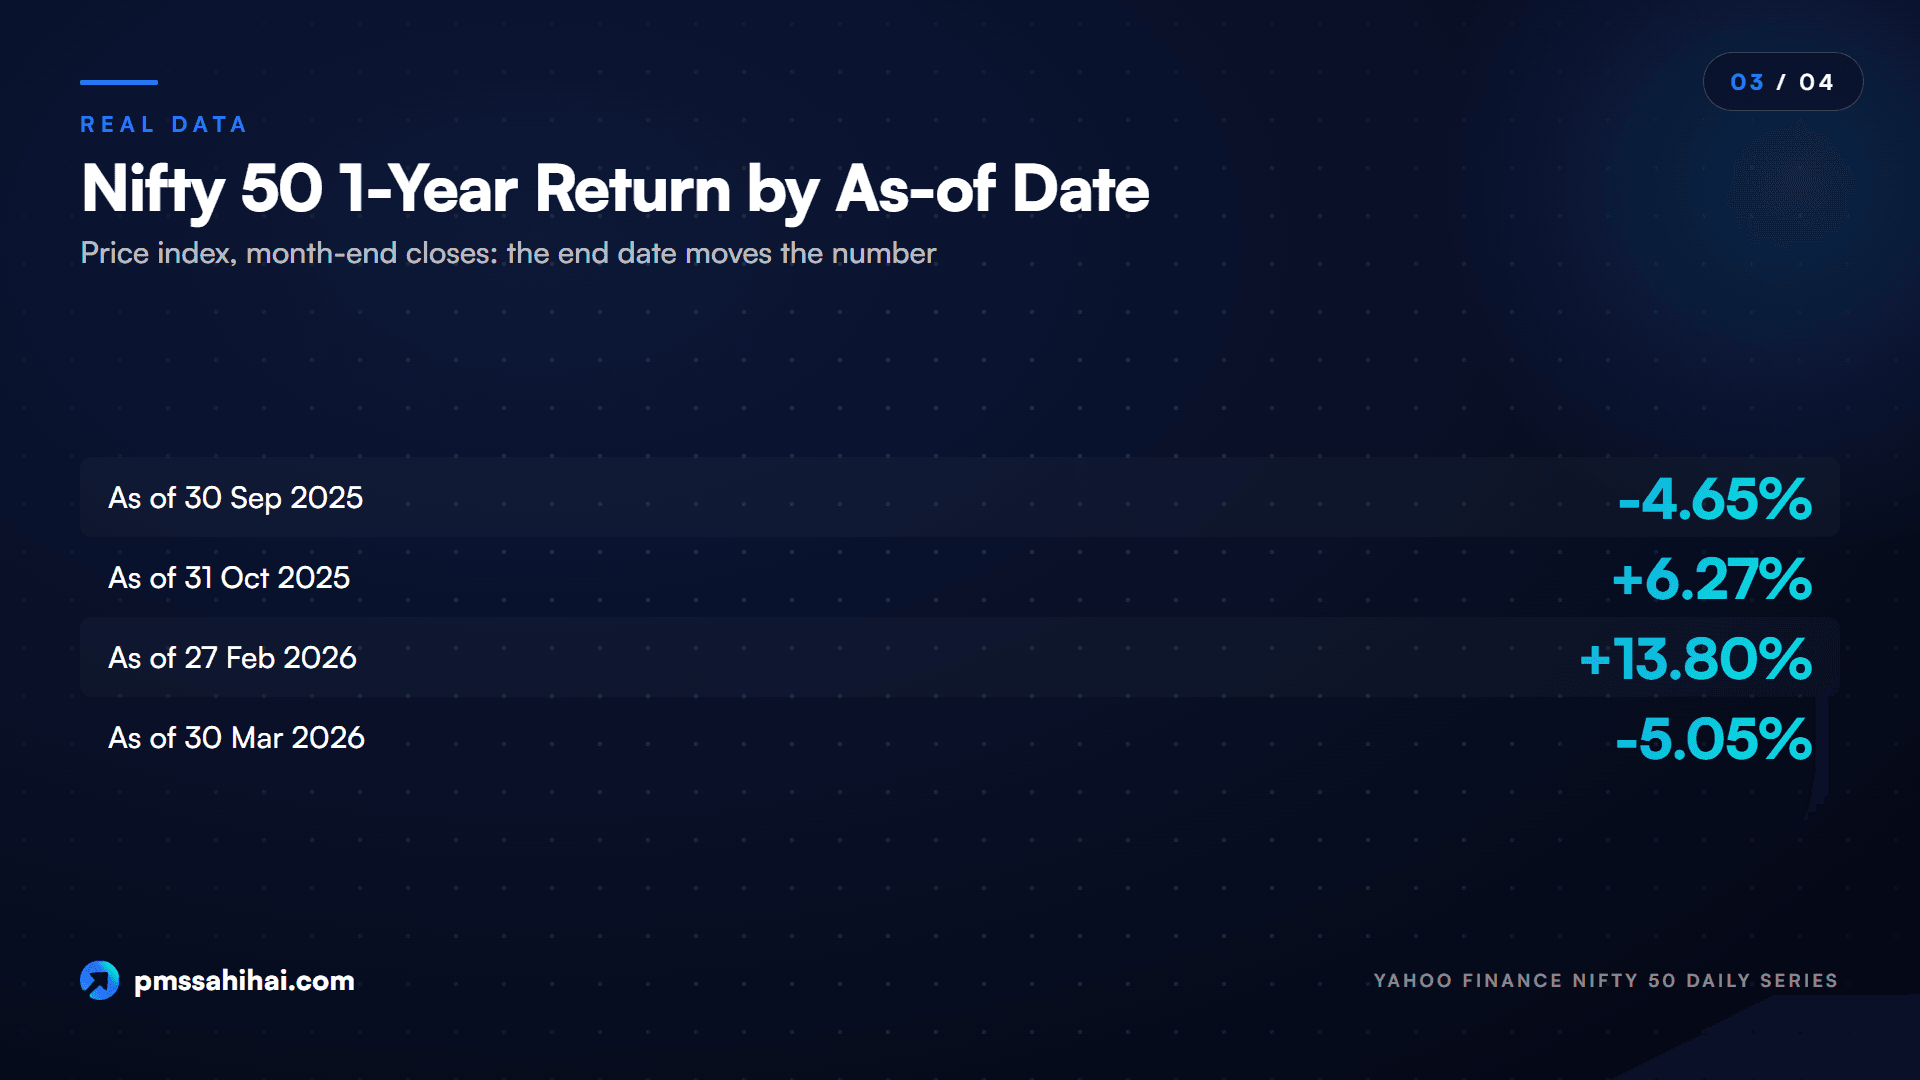
The most confusing thing about trailing returns is how fast they can change. A fund that did nothing unusual last month can show a 1-year return ten points higher or lower than it did a month ago. Here is a real example from the Nifty 50 price index, using month-end closes from Yahoo Finance's daily series.
| As-of date | Nifty 50 close | Close one year earlier | 1-year trailing return |
|---|---|---|---|
| 30 Sep 2025 | 24,611.10 | 25,810.85 (30 Sep 2024) | -4.65% |
| 31 Oct 2025 | 25,722.10 | 24,205.35 (31 Oct 2024) | +6.27% |
| 27 Feb 2026 | 25,178.65 | 22,124.70 (28 Feb 2025) | +13.80% |
| 30 Mar 2026 | 22,331.40 | 23,519.35 (28 Mar 2025) | -5.05% |
In one month, the 1-year figure went from -4.65% to +6.27%, a swing of almost eleven percentage points. Five months later it dropped from +13.80% to -5.05%. The 28 March 2025 and 30 March 2026 dates are the last trading days of those months in the series.
The month in, month out identity
Every time the end date moves forward a month, two things happen. A new month is added at the end, and an old month falls off the start. The new 1-year figure follows directly:
(1 + new 1-year return) = (1 + old 1-year return) x (1 + month added) / (1 + month dropped)
Apply it to October 2025:
- The month added, October 2025, was +4.51%.
- The month dropped, October 2024, was -6.22%.
- So: 0.9535 x 1.0451 / 0.9378 = 1.0626, a 1-year return of +6.27%.
More than half of that jump came from removing a bad month from a year ago, not from anything that happened recently. Economists call this a base effect: the result of a comparison depends on the reference point you start from.
March 2026 shows the reverse. The month added was -11.31%, and the month dropped, March 2025, was +6.30%. A bad new month and the loss of a good old month worked together, and the 1-year figure fell by almost 19 points.
This is why a 1-year trailing return can rise during a quiet or even weak month. It is also why a sharp drop in the 1-year figure does not always mean recent performance was poor. Before reacting, check which month just fell out of the window.
Why longer periods move lessThe same identity applies to 3-year and 5-year figures, but one month is a much smaller share of the window, and the effect is spread across more years when annualised. Between February and March 2026, the Nifty 50's 3-year price return moved from 13.32% a year to 8.76% a year. That is a real change, but far smaller than the 1-year swing.
These are price returns, so they leave out dividends, and the values come from a third-party data series. Confirm them against NSE's historical index data before using them elsewhere.
Reading a Trailing Returns Table Without Being Misled
A trailing table invites you to read across: strong 1-year, decent 3-year, solid 5-year, so the fund looks consistent. Be careful with that reading. All the periods end on the same date, so the most recent year sits inside the 1-year, 3-year and 5-year figures at once. One very good or very bad recent year colours every column.
Backing out the earlier years
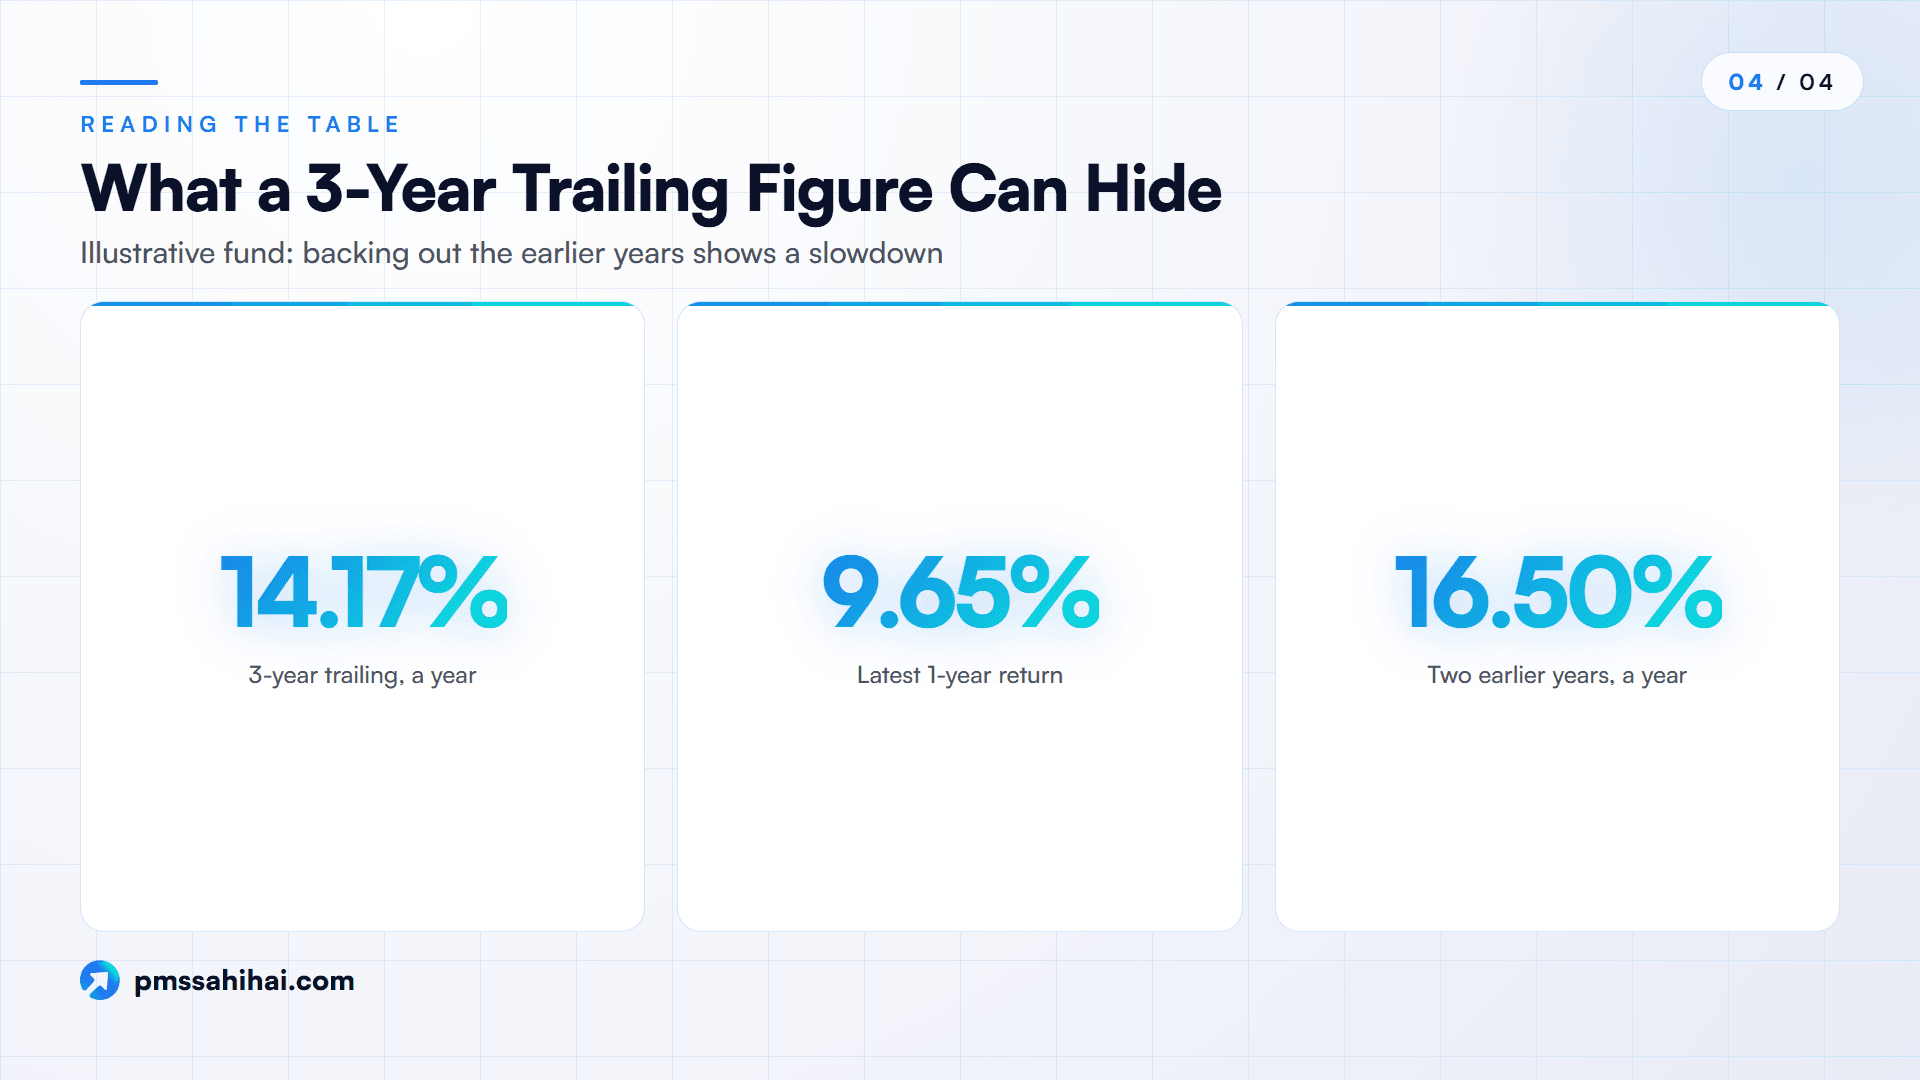
You can separate the recent year from the years before it with a little arithmetic. Take the hypothetical fund above: a 3-year return of 14.17% a year and a 1-year return of 9.65%.
- Growth over three years: 1.1417 cubed = 1.4881.
- Growth over the last year: 1.0965.
- Growth over the two years before that: 1.4881 / 1.0965 = 1.3571.
- As an annual rate: the square root of 1.3571, minus one, is 16.50% a year.
So the 3-year figure is propped up by two earlier years at 16.50%, while the most recent year was 9.65%. The trend is slowing, which the table alone does not show at first glance. The same method works for any pair of trailing figures with the same as-of date: divide the longer period's growth by the shorter period's growth, then annualise over the years in between.
Other checks that take a minute:
- Read the as-of date before any number.
- Check what is annualised. A label like "3Y: 48.81%" may be a total, not an annual rate. Some tables mix the two.
- Compare with the benchmark on the same row. Same date, same period, and a total return index rather than a price index. SEBI moved mutual fund benchmarks to the Total Return variant of an index from 1 February 2018 because a price index captures only capital gains.
- Check the benchmark choice itself. A same-date comparison only helps if the index fits the strategy; our guide to benchmark selection in PMS explains what to look for.
- Note the since-inception date. A fund launched just before a rally will have a flattering since-inception figure for years.
- Ask whose return it is. In a PMS, the strategy's TWRR is not your account's return. Your own figure is reported as XIRR, a money-weighted return, which reflects when you added or withdrew money.
Trailing Returns vs Annual and Calendar-Year Returns
The difference between trailing returns vs annual returns comes down to whether the window moves. A trailing 1-year return slides forward every month. A calendar-year return is fixed once the year ends: the return from 31 December to 31 December.
The two are linked. A calendar-year return is simply a 1-year trailing return frozen on 31 December. For the Nifty 50 price index, the 1-year figure as of 31 December 2025 was +10.51% (from 23,644.80 to 26,129.60), and that is also its calendar 2025 return. A financial-year return is the same idea frozen on 31 March.
| Feature | Trailing returns | Calendar-year returns |
|---|---|---|
| Window | Ends on the latest date | Fixed January to December |
| Changes over time | Yes, every day or month | No, once the year ends |
| Overlap between periods | 1Y sits inside 3Y and 5Y | Separate years, no overlap |
| Best for | Current snapshot, same-date comparison | Seeing year-by-year swings |
| Shows volatility | Poorly | Better, because bad years stand out |
The practical answer is to read both. A 5-year trailing return of 12% a year can hide one year of -20%. Five separate calendar-year returns will show it. Rolling returns go a step further by repeating the same-length calculation from many start dates, which a separate explainer covers.
Why Investors Still Rely on Trailing Returns
For all the caveats, there are good reasons trailing returns sit at the top of most fund pages.
- They are simple. Two values and a calculator. Anyone can check them.
- They are current. They answer what has happened up to now, which is usually the first question.
- They make same-date comparison easy. When every fund in a table uses the same as-of date and periods, timing luck is shared, so the comparison is fair on those dates.
- They capture compounding. Annualised 3, 5 and 10-year figures express growth as a steady yearly rate, which is easier to compare than raw totals.
- They are standardised. SEBI's rules for mutual fund ads and PMS reporting use fixed periods, so the figures are widely available and roughly consistent.
- They show a trend across horizons. Read with the back-out method above, the gap between 1-year, 3-year and 5-year figures hints at whether performance is improving or fading.
The everyday benefit is speed. A trailing table lets you narrow a long list of funds to a short one in minutes, provided you check the dates and the benchmark before going further.
How PMS Sahi Hai Displays Trailing Returns and Nyra Scores
Checking as-of dates and benchmarks by hand across several manager websites gets slow. PMS Sahi Hai, a research and comparison platform for PMS and AIF strategies, puts the trailing view for many strategies in one place. It does not have a trailing-return calculator or as-of-date tool, so the checks in this guide are still yours to run, but its pages shorten the legwork.
A trailing table against a total return benchmark. Each strategy page on the PMS comparison listing carries a "Trailing returns vs benchmark" table covering 1 month, 3 months, 6 months, 1 year, 3 years, 5 years and since inception. The page states its convention plainly: "Absolute for windows under a year, annualised (CAGR) beyond", with alpha shown as the strategy minus its benchmark. On the strategy page we checked, the benchmark was a total return index, which is the same-basis comparison described above. We did not find an as-of date printed beside that table, so confirm the reporting month in the factsheet before comparing it with figures from elsewhere. The platform's own disclaimer says it does not warrant third-party data for timeliness, which is one more reason to check.
Three horizons instead of one. Nyra is the platform's AI-powered research tool. Its published methodology gives 30% of the Nyra Score to excess return over the stated benchmark across 1, 3 and 5 years, weighted toward the longer horizons, and 15% to consistency. Spreading the return pillar across three trailing periods softens the single-date problem, though it cannot remove it, because all three periods still end on the same date. The methodology is dated (ratings as of 30 June 2026, recalculated monthly), strategies with under 12 months of record are Not Rated, and the page calls the score "not a prediction, not a recommendation".
Help with your own holdings. The portfolio health check reads a holdings list against the same five pillars. Your account's own return still needs separate reading: the guide to why your PMS returns differ from published strategy returns and the TWRR explainer cover that gap.
PMS Sahi Hai is an APMI-registered distributor (APRN08358) and states that it is not a SEBI-registered investment adviser, so treat any shortlist it produces as research, not advice.
Limits of Trailing Returns You Should Weigh
The weaknesses are as real as the strengths.
- One date controls everything. As the Nifty example shows, a single month can move the 1-year figure by more than ten points, for reasons that have little to do with recent skill.
- Recency dominates. Every period shares the latest months, so a strong recent run makes the whole table look strong.
- They hide the path. A fund that rose steadily and a fund that crashed and recovered can show the same 5-year figure. Neither drawdown nor volatility appears.
- Conventions vary. Daily or month-end, previous or next business day, 365 or 365.25 days: two sites can publish slightly different figures for the same fund and the same period.
- They may not be your return. A strategy's trailing figure ignores the timing of your own investments. It can also be gross or net, regular or direct plan. For a PMS, tax arises on each transaction in your own account, so a pre-tax figure differs from what you keep. For your own position, consult a tax adviser.
- They do not forecast. A strong 1-year number says nothing reliable about the next year. Past performance is not a guide to future returns.
None of these make trailing returns useless. They make them a starting point.
Making Trailing Returns Work in Your Next Review
Trailing returns are honest about one thing: what a fund did up to a single, recent date. They are easy to calculate, widely published and standardised enough to compare funds quickly. They are also sensitive to that date, dominated by the latest months and silent about the path.
Use them in four steps. Read the as-of date. Check the benchmark on the same date and the same basis. Back out the earlier years to see whether the trend is improving or fading. Then look at calendar-year or rolling figures before deciding anything. Done that way, a trailing table tells you much more than its headline numbers. If you are comparing PMS strategies, a platform such as PMS Sahi Hai lays the trailing tables side by side against a total return benchmark, and Nyra's score spreads the return view across 1, 3 and 5 years. Neither replaces the four checks, but both make them quicker to run.
Check the As-of Date on Your Shortlist Today
Take one fund or PMS strategy you are considering and find the as-of date on its trailing table. Recompute the 3-year figure from two values, back out the earlier years, and compare the benchmark on the same date. It takes ten minutes and shows you more than the headline number. To run the same check across several strategies, compare PMS strategies on PMS Sahi Hai, read how Nyra scores them, use our guide on how to read a PMS factsheet, or talk to the team about a shortlist. Past performance does not guarantee future results, and this article is general information, not investment advice.
PMS Sahi Hai is a distributor of Portfolio Management Services and Alternative Investment Funds, APMI-registered (Registration No. APRN08358). This article is for education only and is not investment advice, a recommendation, or an offer to buy or sell any security. Investments in securities markets are subject to market risks; read all scheme-related documents carefully. Past performance is not indicative of future results. Consult your advisor before investing.
Ishaan founded PMS Sahi Hai to make India's PMS, AIF and GIFT City markets legible to serious investors, comparing every SEBI-registered manager on the same comparative basis, with no shelf products and no commission bias.
Frequently asked
What are trailing returns in simple words?
Trailing returns show how an investment performed over a fixed period, such as one, three or five years, ending on the most recent date. A 1-year trailing return as of today compares today's value with the value one year ago. Periods of a year or more are usually shown as an annual rate, and shorter periods as a simple percentage.
How do you calculate trailing returns?
Divide the value on the as-of date by the value at the start of the period and subtract one. For periods over a year, raise the ratio to the power of one divided by the number of years before subtracting one. For example, a NAV rising from Rs 168 to Rs 250 over three years gives 14.17% a year.
Are trailing returns annualised?
Usually only for periods of one year or more. Morningstar's methodology annualises periods of a year or longer and reports one, three and six-month figures unannualised. The GIPS standards say returns for periods under a year must not be annualised. Year-to-date figures are also left as simple percentages. Always check the label, because some tables show totals.
Is a trailing return the same as a point-to-point return?
Yes, with one condition. A trailing return is a point-to-point return whose end date is the latest available date, such as today or the last month-end. A point-to-point return can use any two dates, including two dates in the past. Every trailing return is point-to-point, but not every point-to-point return is trailing.
Why did my fund's 1-year return change so much in one month?
Because a month was added at the end and a month dropped off the start. If the dropped month was a big loss, the 1-year figure jumps even if the new month was ordinary. The Nifty 50's 1-year price return went from -4.65% to +6.27% between September and October 2025, mostly because October 2024's -6.22% fell out.
Are trailing returns calculated from month-end or from today?
Both conventions exist. Many apps recalculate daily from the latest NAV, while factsheets, regulatory reports and most comparison tables use the last business day of the month. SEBI requires mutual fund ads to use the last day of the month before the ad. Check which one a table uses before comparing figures.
Do PMS factsheets show trailing returns?
They show trailing periods. Under SEBI's Master Circular for Portfolio Managers of 16 July 2025, a manager presents the TWRR of its investment approach with the trailing return of the selected benchmark. Client reports show 1, 3, 5 and 10 years and since inception. Your own account's return is shown separately as XIRR.
Are trailing returns good for choosing a fund?
They are good for a first filter, not a final decision. They make it easy to compare funds on the same date, but they depend on that date and hide volatility. Pair them with calendar-year returns, rolling returns, drawdown data and a same-date benchmark comparison before you shortlist anything.
Keep reading
All articles
What Is Market Capitalization? Formula, SEBI Cap Bands and PMS Use
Market capitalization explained: the formula, SEBI's large, mid and small cap ranks, AMFI's June 2026 cut-offs and why it matters for PMS investors.

Free Float Market Capitalisation: How NSE’s IWF Sets Index Weights
How free float market capitalisation is calculated with NSE's investible weight factor, which shares are excluded, and why Nifty and Sensex use it.

Passive Management in PMS: Can a Portfolio Manager Just Track an Index?
Can a PMS be passive? Index replication, direct indexing, rule-based models, SEBI's rules and what a passive PMS costs against a 0.04% ETF.
Read it. Now pressure-test it.
Ask Nyra how this applies to your portfolio, or talk to our team, no pitch, no pressure.