
What Is Market Capitalization? Formula, SEBI Cap Bands and PMS Use
Market capitalization explained: the formula, SEBI's large, mid and small cap ranks, AMFI's June 2026 cut-offs and why it matters for PMS investors.


Market capitalization is the stock market's price tag on a company's equity: the share price multiplied by the number of shares in issue. In India it also decides a company's official size label, because SEBI ranks every listed company by full market capitalization and calls the top 100 large caps, ranks 101 to 250 mid caps and everything below small caps, using a list AMFI redraws every six months. In AMFI's June 2026 list the large cap line sat near ₹1.06 lakh crore and the mid cap line near ₹33,700 crore, far above the ₹20,000 crore and ₹5,000 crore bands many websites still quote. Those bands bind mutual funds, not portfolio management services, so a PMS investor has to check a strategy's real market-cap mix rather than trust its name.
Why Market Capitalization Is the First Number Investors Should Understand
Open any stock page, fund factsheet or PMS presentation in India and the same idea appears within seconds: size. A strategy is "large cap", a stock is "mid cap", a manager hunts in "small and micro caps". Each label rests on one number, the company's market capitalization.
The arithmetic is simple. What is less obvious is how much of the Indian market is organised around it. SEBI uses it to define what a large cap mutual fund may call large. Stock exchanges use it to decide which companies must publish a sustainability report or webcast their annual meeting. Index providers weight their indices by a version of it. And every six months, one ranking of more than 5,000 companies moves dozens of them between size bands, which changes what a portfolio "is" without a single trade.
For an investor choosing a Portfolio Management Service (PMS), with its SEBI minimum of ₹50 lakh and shares held in your own demat account, the stakes are practical. Knowing what the measure captures, how SEBI and AMFI apply it and where it falls short is the quickest way to tell whether a "mid cap" strategy is really mid cap. Free float market capitalization, the version index providers use, is a separate measure and gets only a short note here.
What Market Capitalization Means and How to Calculate It
Market capitalization, usually shortened to market cap, is the total market value of a company's outstanding shares at a given moment. It is not revenue, assets, profit or the bank balance, and it is not what a buyer would pay for the whole business.
The Market Capitalization Formula With an Indian Example
The market capitalization formula has two inputs:
Market capitalization = current share price × total number of shares outstanding
Take a hypothetical listed company with 50 crore shares trading at ₹800 each:
- Shares outstanding: 50,00,00,000
- Share price: ₹800
- Market capitalization: 50 crore × ₹800 = ₹40,000 crore
If the price rises to ₹880 and the share count stays the same, the value rises 10% to ₹44,000 crore. The business has not changed; the market's valuation of it has.
In India the size label depends on where that number ranks, not on the number itself. At ₹40,000 crore, this company would have sat in the mid cap band of AMFI's June 2026 list, which started at roughly ₹33,700 crore. In another year the same figure could rank differently, because every other company's value moves too.
What Counts as Shares Outstanding
Shares outstanding are the equity shares a company has issued and that shareholders hold, including promoters, institutions, employees and the public. For SEBI's size bands the relevant figure is full market capitalization, which values all of those shares whether or not they trade.
Two refinements matter:
- Promoter and locked-in shares count. A promoter group holding 70% that never sells is still in the full figure. Index providers use free float market capitalization, which leaves such holdings out; that distinction has its own explainer.
- The figure is averaged. AMFI ranks on the average over the previous six months, and averages across exchanges where a company is listed on more than one.
What Changes Market Cap and What Leaves It Unchanged
Because market cap is price × shares, anything that moves either input moves the result.
| Event | Effect on market cap | Why |
|---|---|---|
| Share price rises or falls | Changes in the same direction | Price input changes |
| New shares issued (IPO, QIP, rights, warrant or ESOP exercise) | Usually rises | Share count rises; holders may be diluted |
| Share buyback | Usually falls by roughly the cash paid out | Share count falls |
| Stock split or bonus issue | No change in principle | More shares at a proportionally lower price |
| Merger or demerger | Can change sharply | Share count and business both change |
Share prices alone say nothing about size. A ₹50 stock with 100 crore shares (₹5,000 crore) is bigger than a ₹2,000 stock with 1 crore shares (₹2,000 crore).
How Market Capitalization Became India's Size Yardstick
Price multiplied by shares has long been the standard way global markets size listed companies. US data providers commonly use dollar bands such as large cap at about $10 billion and above, mid cap at $2 billion to $10 billion and small cap at $250 million to $2 billion. Those bands are conventions, not law.
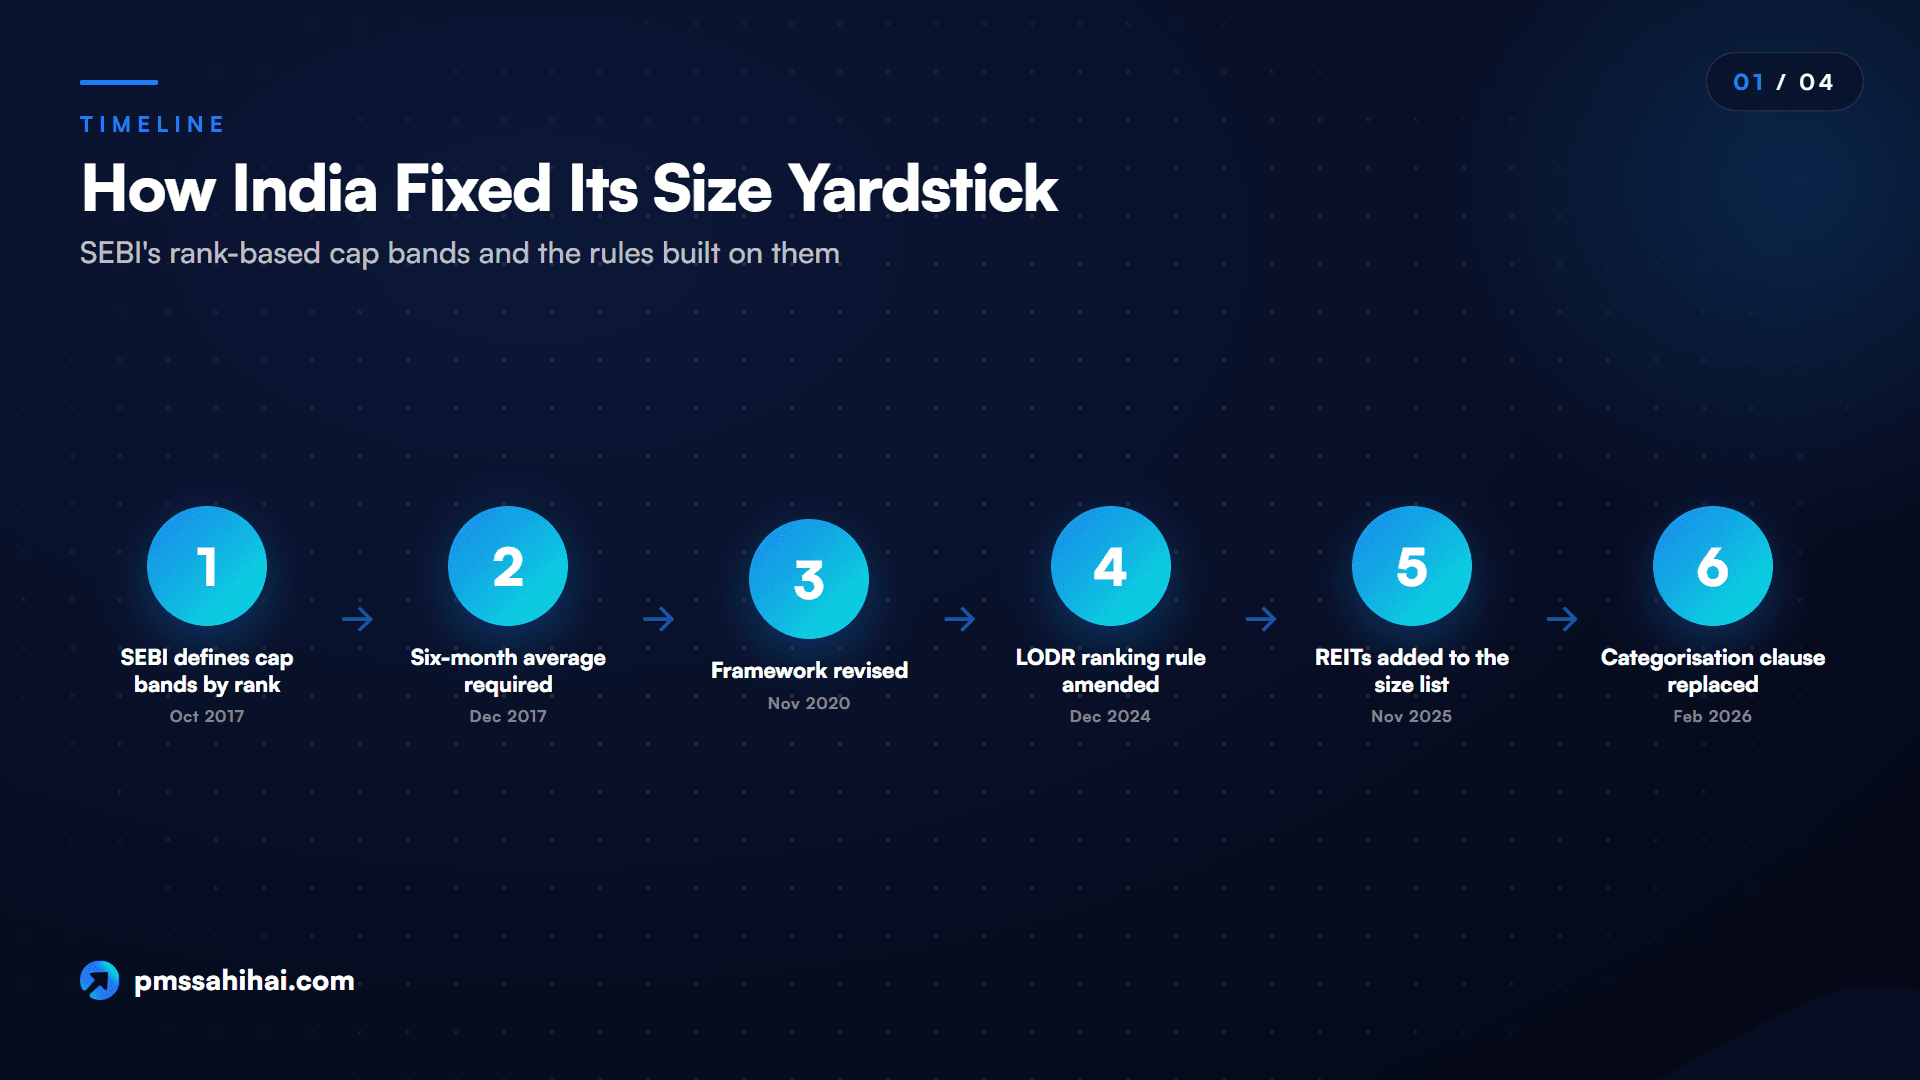
India chose a rank-based rule, and the key dates are recent:
- Before October 2017: no uniform regulatory definition existed, so two "mid cap" funds could hunt in very different pools.
- 6 October 2017: SEBI's circular on categorisation of mutual fund schemes defined large cap as the 1st to 100th company by full market capitalization, mid cap as the 101st to 250th and small cap as the 251st onwards, with a single AMFI list updated every six months.
- 4 December 2017: a SEBI clarification required the six-month average full market capitalization.
- 6 November 2020: a further SEBI circular revised the categorisation framework.
- 31 December 2024: an amendment to SEBI's listing regulations moved company obligations to a ranking by average market capitalization from 1 July to 31 December.
- 28 November 2025: SEBI reclassified REITs as equity-related instruments for mutual funds from 1 January 2026 and told AMFI to add them to the size list.
- 26 February 2026: SEBI replaced the categorisation clause, keeping the large, mid and small cap floors.
- 20 March 2026: the new Master Circular for Mutual Funds restated the definitions for "stocks/REITs".
The result is a published, regularly refreshed ranking that is more precise than the loose dollar bands used abroad.
SEBI's Large Cap, Mid Cap and Small Cap Bands Explained
The SEBI market cap classification fits in three lines. Under paragraph 3.9 of the March 2026 Master Circular for Mutual Funds:
- Large cap: 1st to 100th entities in terms of full market capitalization
- Mid cap: 101st to 250th entities
- Small cap: 251st entity onwards
The Rank-Based Rule in the 2017 Circular
The large cap mid cap small cap split is relative. A company becomes large cap by being among the hundred most valuable listed companies, not by crossing a rupee figure. If the whole market doubles, the bands double with it.
That design has a purpose: a mid cap fund from one fund house and a mid cap fund from another now fish in the same 150-company pond, so they are comparable. Note what the rule leaves out. "Micro cap" is a market term for the tail of the small cap band, usually well beyond rank 500, with no regulatory definition.
How AMFI Builds the Six-Monthly Market Cap List
The AMFI market cap list is the operational heart of the system. SEBI's Master Circular tells AMFI to:
- Take each company's average full market capitalization over the previous six months.
- Average across exchanges if the stock is listed on more than one; otherwise use the single exchange's figure.
- Rank the results and publish them within five calendar days of the end of June and December.
- Prepare a monthly list for companies that list between updates, including demergers.
Mutual funds then have one month to rebalance if an update pushes them outside their category limits.
The June 2026 file has one row per company for 5,427 companies, with BSE, NSE and MSEI six-month averages and the resulting category. By our count, about 2,153 had both a BSE and an NSE figure and 3,138 had a BSE figure only: most listed Indian companies are small, BSE-only names few investors ever meet.
What the June 2026 AMFI List Shows
The figures below are six-month averages across exchanges, calculated from AMFI's file for the six months ended 30 June 2026.
| Rank | Company | Six-month average market cap | Category |
|---|---|---|---|
| 1 | Reliance Industries | ≈ ₹18,73,300 crore | Large cap |
| 100 | GAIL (India) | ≈ ₹1,06,346 crore | Large cap |
| 101 | Bosch | ≈ ₹1,06,278 crore | Mid cap |
| 250 | Godrej Industries | ≈ ₹33,664 crore | Mid cap |
| 251 | Navin Fluorine International | ≈ ₹33,442 crore | Small cap |
| 500 | (rank 500) | ≈ ₹12,200 crore | Small cap |
| 1,000 | (rank 1,000) | ≈ ₹2,840 crore | Small cap |
Three things stand out.
The borders are razor thin. About ₹68 crore separated the 100th company from the 101st, under 0.1% of either company's value.
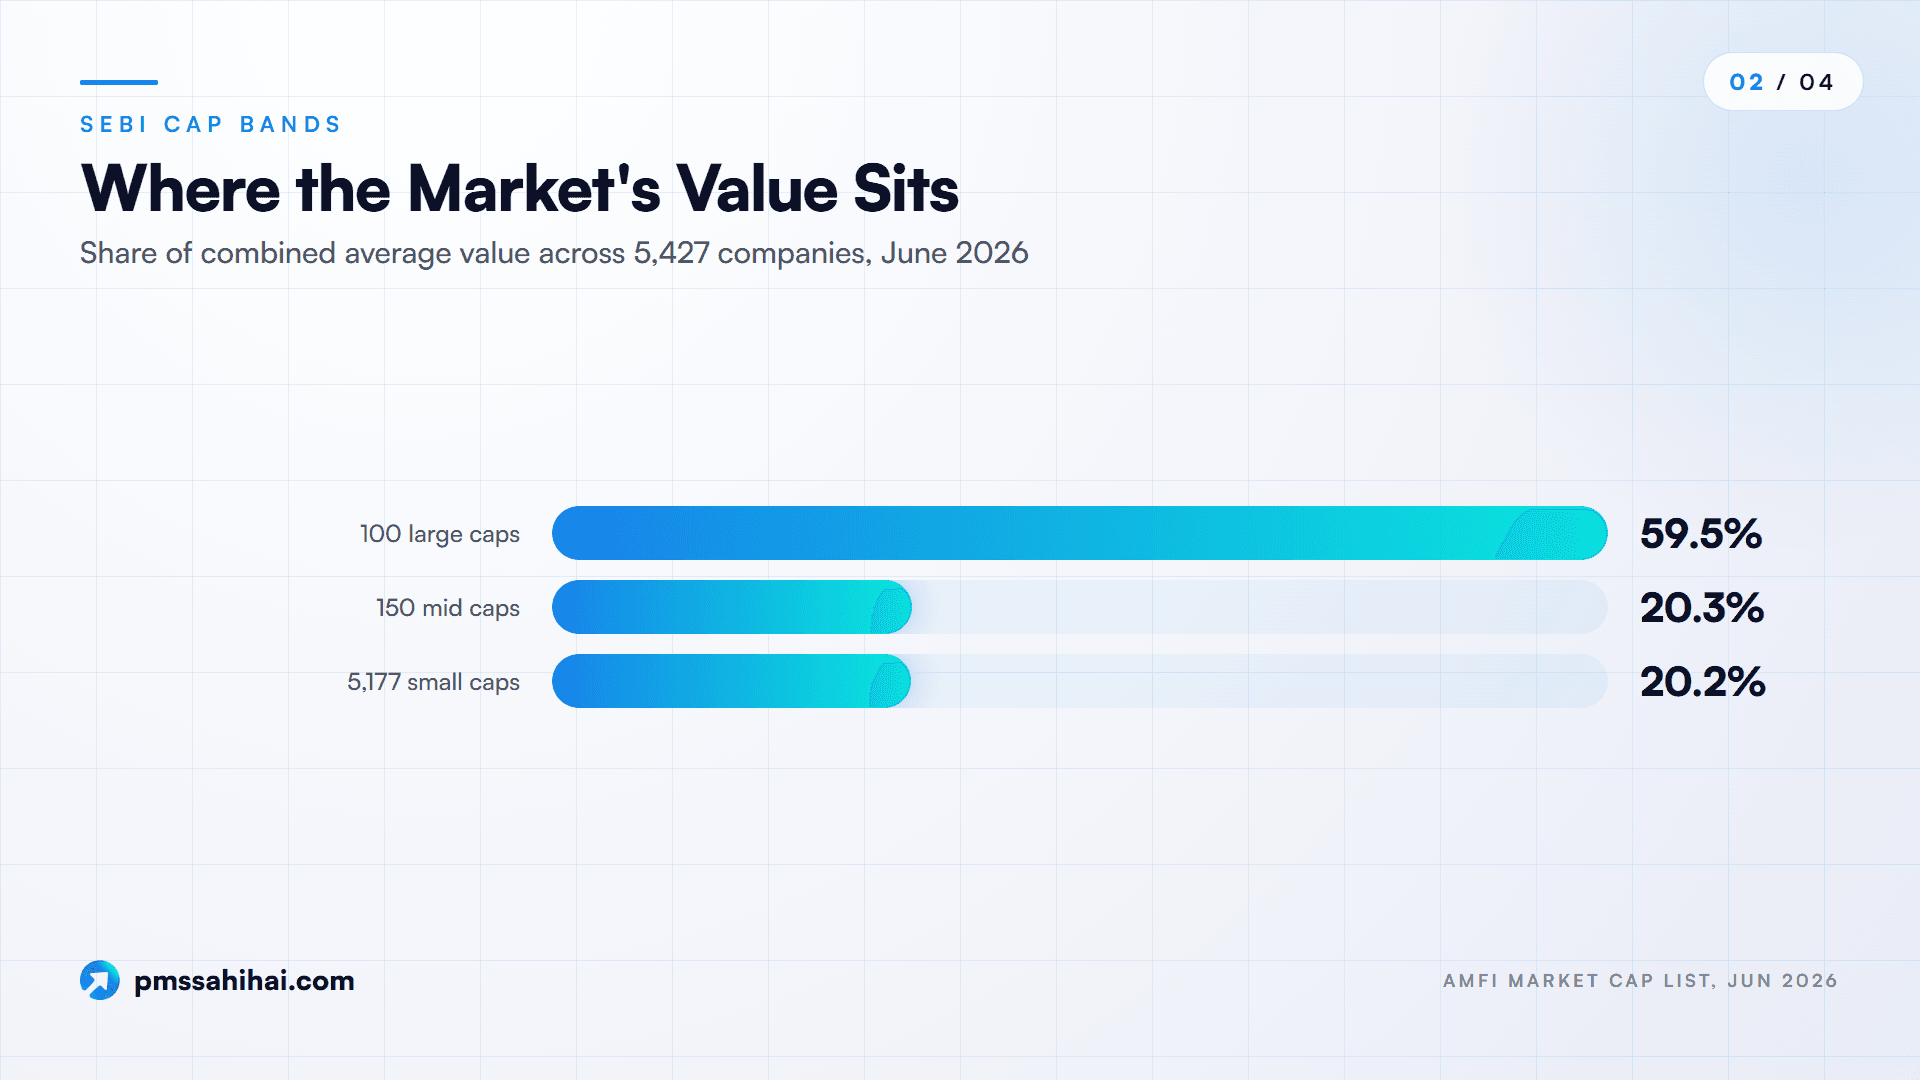
Value is concentrated at the top. By our calculation, the 100 large caps held about 59.5% of the combined average value of all 5,427 companies, the 150 mid caps about 20.3% and the 5,177 small caps about 20.2%. Close to 3,950 companies averaged under ₹1,000 crore.
REITs are now on the list. Three REITs entered as mid caps (Knowledge Realty Trust at rank 195, Embassy Office Parks REIT at 220 and Bagmane Prime Office REIT at 242), with Mindspace Business Parks REIT just outside at 265.
The trade publication Cafemutual counted the churn from AMFI's December 2025 list: nine companies fell from large to mid cap, including Bosch and Hero MotoCorp, and eight rose the other way, including BSE and Vodafone Idea.
Why Fixed Rupee Thresholds Mislead
Several widely read explainers still call companies worth ₹20,000 crore or more large caps and those below ₹5,000 crore small caps. Against the June 2026 list those bands are badly out of date: a ₹20,000 crore company ranked around 344th, a small cap, and 784 companies were worth ₹5,000 crore or more, over three times the 250 large and mid caps.
Treat any rupee threshold as a dated snapshot. The rank is the rule; the rupee line is whatever the latest AMFI file says.
Where Market Capitalization Is Used in Indian Markets Today
The measure is now wired into regulation, product rules and the software investors use every day.
Mutual Fund Category Rules
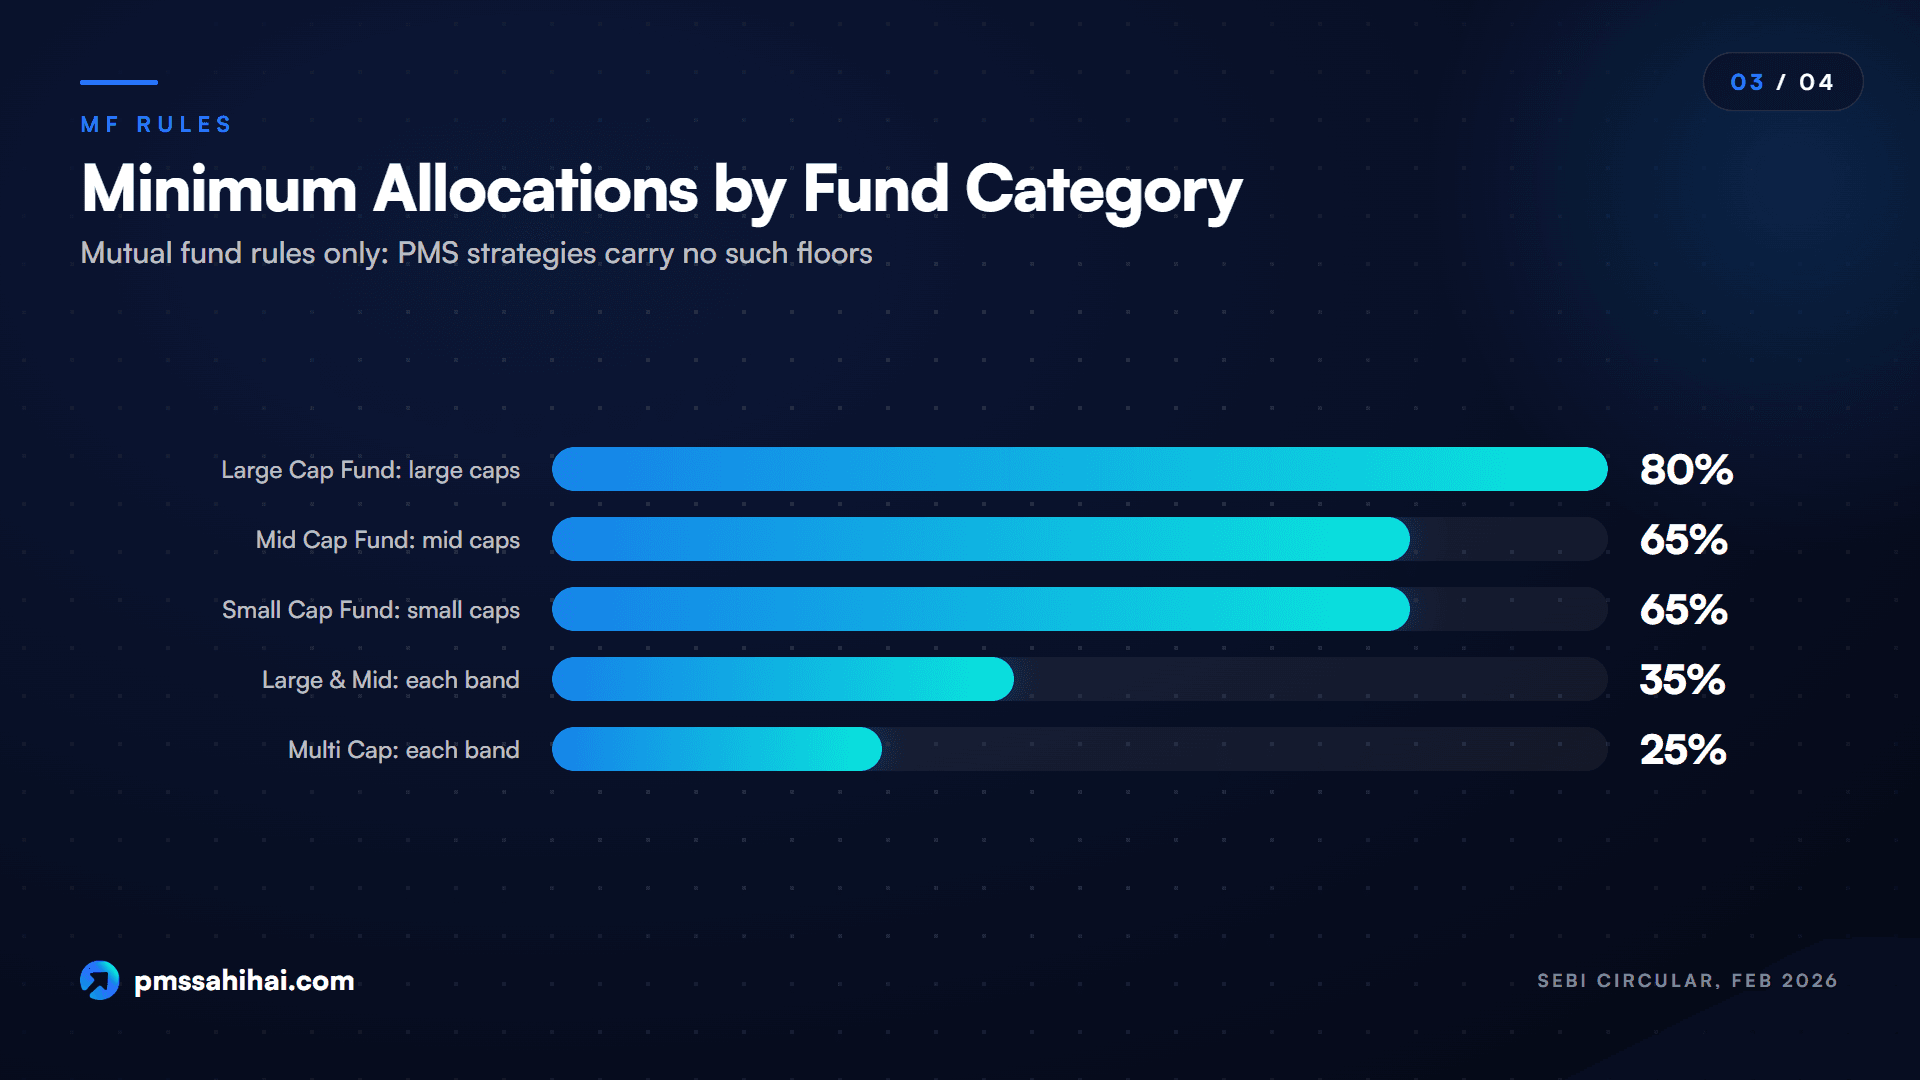
SEBI's February 2026 circular sets minimum allocations that only work because the bands are defined:
| Mutual fund category | Minimum allocation |
|---|---|
| Large Cap Fund | 80% of total assets in large caps |
| Mid Cap Fund | 65% in mid caps |
| Small Cap Fund | 65% in small caps |
| Large & Mid Cap Fund | 35% each in large and mid caps |
| Multi Cap Fund | 75% in equity, with at least 25% each in large, mid and small caps |
| Flexi Cap Fund | 65% in equity, free to move across sizes |
Each new AMFI list can trigger rebalancing within a month, which is why market commentators track every six-monthly rejig.
Listing Obligations for the Top 100, 250, 1,000 and 2,000 Companies
Under SEBI's Listing Obligations and Disclosure Requirements (LODR) Regulations, each stock exchange prepares a list on 31 December ranking companies by average market capitalization from 1 July to 31 December. Duties start from the next 1 April or the next financial year, whichever is later. Examples, as amended up to 15 October 2026:
| Market-cap rank | Obligation under LODR |
|---|---|
| Top 100 | Annual general meeting within five months of year end, with a live webcast |
| Top 100, then top 250 | Confirm, deny or clarify market rumours after a material price movement |
| Top 1,000 | An independent woman director, a Risk Management Committee, a dividend distribution policy and a Business Responsibility and Sustainability Report |
| Top 2,000 | A board of at least six directors |
Under the old rule, a company that once crossed a threshold stayed bound even if it fell back. Since the 2024 amendment, duties lapse only after three consecutive years outside the threshold. For investors, rank is a quick proxy for how much a company must disclose.
Index Weights and Data Tools
India's main indices are weighted by the free-float version of market value. NSE Indices says the Nifty 50 has used a free float market capitalization weighted method since 26 June 2009 and represented about 49% of the free float value of NSE-listed stocks on 30 September 2026.
The AMFI file is also the backbone of most size tags you see. Broker apps show a large, mid or small cap label beside each stock from AMFI's list, screeners sort by size in a click, and PMS analytics platforms tag a strategy's holdings by band. Because the file is public and machine-readable, anyone can reproduce those tags in a spreadsheet.
Market Cap Compared With Share Price, Enterprise Value and Book Value
Market capitalization is one of several numbers that describe how big or valuable a company is, and mixing them up is a common beginner error.
| Measure | What it tells you | Formula | Best used for |
|---|---|---|---|
| Share price | Value of one share | Last traded price | Trading; says nothing about size alone |
| Market capitalization | Market value of all equity | Price × shares outstanding | Size ranking, index weights, SEBI bands |
| Enterprise value (EV) | Value of the whole business to all capital providers | Market cap + debt + preference capital + minority interest − cash | Comparing companies with different debt; EV/EBITDA |
| Book value | Accounting value of equity | Assets − liabilities | Price-to-book ratio; banks and asset-heavy firms |
Take the hypothetical ₹40,000 crore company again, with ₹10,000 crore of debt, ₹2,000 crore of cash and no preference capital or minority interest:
- Enterprise value = ₹40,000 crore + ₹10,000 crore − ₹2,000 crore = ₹48,000 crore
- With a balance-sheet net worth of ₹8,000 crore, the price-to-book ratio is 5 times
A buyer of the whole company takes on its debt as well, which is why enterprise value is considered the more comprehensive measure of takeover cost. Two companies with the same market cap can be very differently geared. Market cap answers only "how big is the equity in the market's eyes?"
Why Market Capitalization Matters for PMS Strategies
For PMS investors the measure shapes what a strategy owns, how it is judged and how easily it can be exited.
Cap Labels Without Legal Floors
SEBI's 80% and 65% floors apply to mutual fund schemes. The SEBI Master Circular for Portfolio Managers of 16 July 2025 contains no definition of large, mid or small cap and no market-cap allocation limits. It requires a documented investment approach, "the documented investment philosophy" a manager follows, tagged to one broad strategy such as equity, debt, hybrid or multi-asset.
So a strategy called "Mid & Small Cap" uses the size words by choice. Many managers follow the AMFI bands closely; some do not. A mid cap PMS can hold large caps, small caps or cash in whatever proportion its investment approach allows. That flexibility is part of why investors choose a PMS, but it moves the checking from the regulator to you.
The SEBI (Portfolio Managers) Regulations, 2026 were notified on 7 October 2026 and take effect from 1 April 2027. Until then the 2020 Regulations and the July 2025 Master Circular apply, and neither sets market-cap floors for PMS.
Benchmarks and the Market-Cap Mix
Under the Master Circular, APMI prescribes up to three benchmarks per broad strategy, and every equity strategy reports against the NIFTY 500, S&P BSE 500 or MSEI SX40. These broad indices are dominated by large caps, so a strategy holding mostly mid and small caps is measured against an index whose weight sits largely in the top 100.
That flatters or punishes depending on the cycle. When smaller companies lead, a mid and small cap strategy looks brilliant against the NIFTY 500; in a large cap led market it looks poor. Since a SEBI letter of 3 October 2024, managers may also disclose an optional secondary benchmark from a list that includes the Nifty Midcap 150, Nifty Smallcap 250 and Nifty Large Midcap 250, a fairer size-matched yardstick. Our 2026 review of PMS categories against their benchmarks shows how much the choice of yardstick matters.
So read a strategy's market-cap mix (its share in large, mid and small caps plus cash) alongside its benchmark. A portfolio that is 60% small cap and benchmarked to a broad index needs a size-matched comparison before its "alpha" means much.
Drift After Every AMFI Update
Because the bands are relative, a PMS's mix can change without a trade. In the June 2026 update Bosch fell into the mid cap band and BSE rose into the large cap band, so a "large cap" strategy holding Bosch, or a "mid cap" strategy holding BSE, woke up with a different mix.
Mutual funds must rebalance within a month; a PMS need not. That lets a manager keep a winner that has outgrown its band, which can help returns, but over time it can turn a mid cap strategy into something closer to multi cap. Checking the mix after each January and July update shows whether the strategy you bought is still the one you hold.
Liquidity and Strategy Capacity
Larger companies generally trade more and carry lower impact costs; smaller ones can be hard to trade in size without moving the price. The AMFI file shows how steep the curve is: the 500th company averaged about ₹12,200 crore, the 1,000th about ₹2,840 crore.
For a PMS, which holds shares directly in each client's account, this limits how much money a small cap strategy can run before its own trades hurt returns, and how quickly holdings can be sold if many clients exit at once. The market-cap mix is a first, rough read on liquidity risk.
Advantages of Using Market Capitalization as an Investor
Used well, the measure saves time and sharpens questions.
- One comparable size number. It puts a bank, a software exporter and a cement maker on the same scale, whatever their share prices.
- A shared, rule-based vocabulary. SEBI fixed the ranks and AMFI publishes one list, so "mid cap" means the same 150 companies across every fund house, and you can apply that yardstick to any PMS.
- A predictable schedule. Updates arrive every six months, and six-month averaging smooths one-day spikes, so labels do not flip daily.
- A quick read on risk and liquidity. As a tendency, larger companies are more liquid and less volatile; smaller ones swing harder and trade thinner.
- A check on what a manager actually does. PMS holdings sit in your demat account, so you can map each one to AMFI's list and compare the real mix with the investment approach.
- A link to governance expectations. LODR duties tied to the top 100, 1,000 and 2,000 ranks mean size also signals disclosure standards.
- Free, public data. The AMFI file costs nothing, so the check takes a spreadsheet and an hour.
How PMS Sahi Hai Helps You Read Market Capitalization in a PMS
Everything above points to one habit: look past the label to the mix. That is the job PMS Sahi Hai is built for, and it is worth being precise about what the platform shows and what it leaves to you.
Start with categories, then check the mix. The PMS comparison table lists each strategy with a category such as "Equity: Mid Cap", "Equity: Mid & Small Cap" or "Equity: Multi Cap", alongside AUM, vintage, returns and a Nyra score, and the compare shelf filters PMS by size category, benchmark, AUM and style. Treat those categories as the manager's own label. The useful step comes next: every strategy page carries a "Market-cap mix" block splitting the portfolio into large, mid and small caps plus cash.
See label, mix and benchmark side by side. On 6 November 2026, the Stallion Asset Core Fund page, a multi cap strategy, showed 37% large, 30% mid, 25% small and 8% cash. The Marcellus Rising Giants page showed 4% mid, 79% small and 17% cash. Both report against the S&P BSE 500 TRI. Seeing a 79% small cap book next to a broad benchmark is exactly the prompt to ask for a size-matched comparison, the check our guide to choosing a PMS puts bluntly: "The index must match the mandate."
Ask Nyra for the detail. Strategy pages do not show full holdings, but they invite you to ask Nyra for the current portfolio. Nyra can also review a portfolio you already own for overlap, drift and fee drag. Its rating methodology scores strategies within peer groups by asset class and category on five published pillars, so a small cap PMS is compared with small cap peers rather than with a large cap fund.
Know the limits. The pages do not say which AMFI list or date the market-cap mix is based on, and Nyra's score does not grade whether a strategy's name matches its holdings. For that, run the seven-step check below against the latest AMFI file. Nyra is an analytical tool, not a SEBI-registered investment adviser.
Limitations of Market Capitalization Every Investor Should Know
Treating the measure as a verdict on a company or a strategy is a mistake.
- It measures price, not quality. It tells you what the market pays for the equity today, not whether the business is good, cheap or well run.
- It ignores debt and cash. For an indebted company it understates the value of the business; enterprise value answers that question.
- It moves with sentiment. A company can climb from small to mid cap in a rally and fall back in a correction with no change in its business.
- Full market cap overstates what can be traded. It counts promoter and locked-in holdings; for liquidity, free float and trading volumes matter more.
- Rupee thresholds go stale fast. Bands quoted on many websites lag the AMFI list by years.
- Borders are arbitrary. About ₹68 crore separated the last large cap from the first mid cap in June 2026; rank 100 and rank 101 are, for most purposes, the same kind of company.
- For PMS, labels carry no legal floor. A PMS name is a description, not a guarantee.
How to Use Market Capitalization When Choosing a PMS
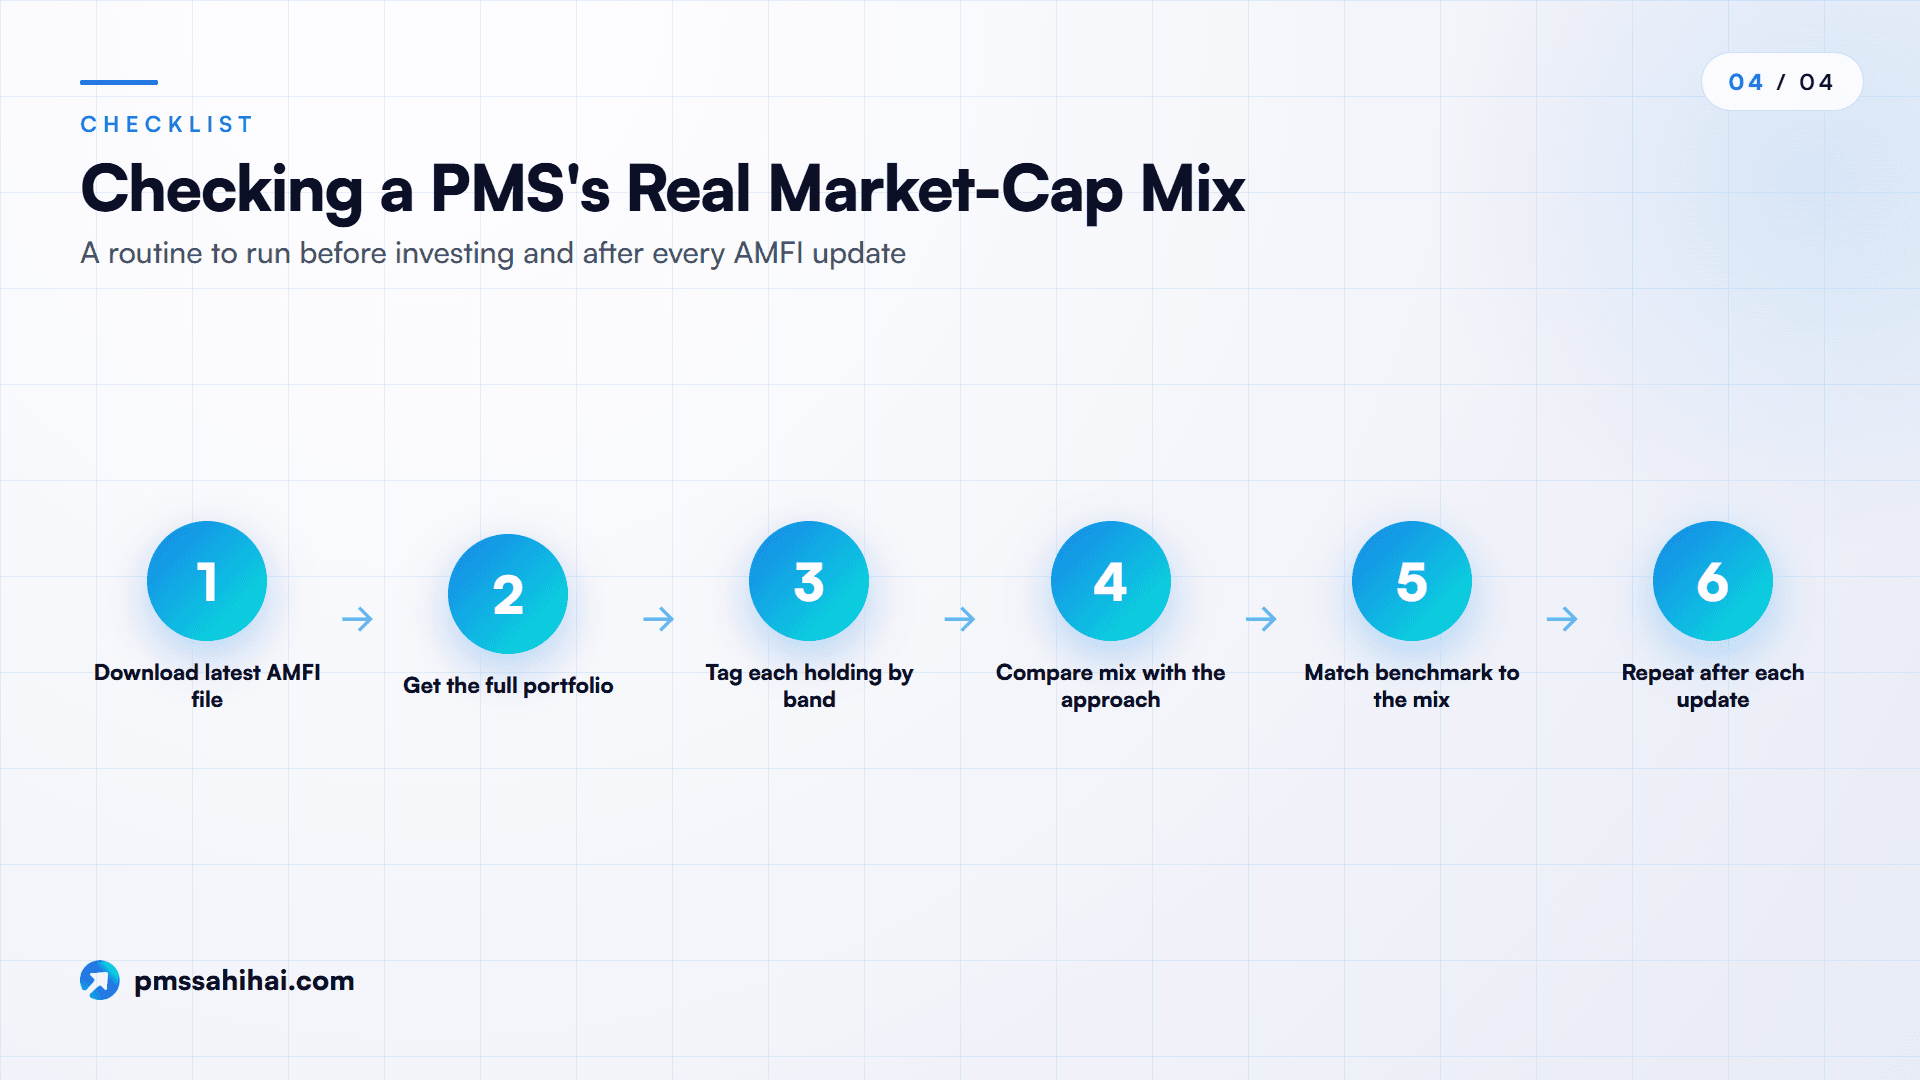
A practical routine before you commit ₹50 lakh or more:
- Download the latest AMFI file (January and July releases) and note its date.
- Get the full portfolio, not just the top ten, plus the investment approach document.
- Tag every holding with its AMFI category and add up the weights in large, mid and small cap, plus cash.
- Compare the mix with the approach. If a "large cap" strategy is 40% mid cap, ask whether that is deliberate or drift.
- Match the benchmark to the mix. Check the primary benchmark and whether a size-matched secondary one is disclosed.
- Look at the tail. Note how much sits below rank 500 or rank 1,000, where liquidity and governance risk concentrate.
- Repeat after each update in January and July. A changing mix is not always bad, but it should never be a surprise.
For how each band behaves as a PMS style, see our guides to large cap PMS, mid cap PMS, small cap PMS and micro cap PMS.
Market Capitalization in Your Portfolio: The Bottom Line
Market capitalization is simple arithmetic with big consequences. Price times shares gives the market's value of a company's equity. Ranked by SEBI's rule (top 100 large, 101 to 250 mid, 251 onwards small) and refreshed through AMFI's six-monthly list, it becomes India's shared size vocabulary, driving mutual fund rules, listed-company obligations and index weights.
The June 2026 numbers show its power and its limits. The top 100 companies hold close to 60% of combined value, the large cap line sits near ₹1.06 lakh crore, and a few tens of crores can move a company across a border. The old ₹20,000 crore rule of thumb no longer describes anything.
For PMS investors, SEBI's size floors bind mutual funds, not portfolio managers. A strategy's name tells you what it intends; its market-cap mix tells you what it holds. Use the AMFI list to check, match the benchmark to the mix and revisit after every update. PMS Sahi Hai's strategy pages put the label, the market-cap mix and the benchmark on one screen, and Nyra can pull the current portfolio, so the check takes minutes rather than an afternoon.
Compare PMS Strategies by Market-Cap Mix on PMS Sahi Hai
Market capitalization tells you what a strategy holds; the next step is comparing strategies on equal terms. On PMS Sahi Hai you can shortlist PMS strategies by category, open each strategy page to see its market-cap mix next to its benchmark, pin up to four side by side, and ask Nyra for the current portfolio before you sign. Prefer a person? Book a private consultation and bring the questions this guide raises.
PMS Sahi Hai is a distributor of Portfolio Management Services and Alternative Investment Funds, APMI-registered (Registration No. APRN08358). This article is for education only and is not investment advice, a recommendation, or an offer to buy or sell any security. Investments in securities markets are subject to market risks; read all scheme-related documents carefully. Past performance is not indicative of future results. Consult your advisor before investing.
Ishaan founded PMS Sahi Hai to make India's PMS, AIF and GIFT City markets legible to serious investors, comparing every SEBI-registered manager on the same comparative basis, with no shelf products and no commission bias.
Frequently asked
What is market capitalization in simple words?
Market capitalization is the total value the stock market places on a company's equity. Multiply the current share price by the number of shares outstanding: a company with 10 crore shares at ₹500 has a market cap of ₹5,000 crore. It measures size in the market's eyes, not profit, revenue, assets or what a buyer would pay for the whole business.
How is market capitalization calculated for SEBI's size categories?
AMFI takes each company's average full market capitalization over the previous six months, averaging across BSE, NSE and MSEI if the company is listed on more than one. It ranks every listed company and publishes the list within five calendar days after the end of June and December. Mutual funds then have one month to rebalance.
How does SEBI classify large cap, mid cap and small cap companies?
SEBI ranks companies by full market capitalization: the 1st to 100th are large cap, the 101st to 250th mid cap and the 251st onwards small cap. The rule dates from SEBI's circular of 6 October 2017 and is restated in the Master Circular for Mutual Funds of 20 March 2026. Mutual funds must use AMFI's list, which now includes REITs.
What was the large cap cut-off in the June 2026 AMFI list?
In AMFI's list for the six months ended 30 June 2026, the 100th company, GAIL (India), averaged about ₹1,06,346 crore, so the large cap line sat near ₹1.06 lakh crore. The 250th, Godrej Industries, averaged about ₹33,664 crore, the bottom of the mid cap band. These lines move with every six-monthly update, so check the latest file.
Does a stock split or bonus issue change market cap?
Not in principle. A split or bonus issue increases the number of shares but cuts the price per share in the same proportion, so total value stays the same: a 1:2 split of a ₹2,000 share gives two ₹1,000 shares. Market cap changes when the price moves for other reasons or when shares are genuinely issued or bought back.
What is the difference between market cap and enterprise value?
Market cap values only the equity. Enterprise value adds debt, preference capital and minority interest and subtracts cash, giving the value of the whole business to all capital providers. A company with a ₹40,000 crore market cap, ₹10,000 crore of debt and ₹2,000 crore of cash has an enterprise value of ₹48,000 crore, which suits comparisons across different debt levels.
Does SEBI's large cap rule apply to a PMS?
No. The 80% large cap and 65% mid or small cap floors apply to mutual fund schemes. SEBI's Master Circular for Portfolio Managers sets no market-cap limits; a PMS follows its own documented investment approach, so a "mid cap" strategy may hold large caps, small caps or cash. Check its holdings against AMFI's list and compare the mix with the approach.
Keep reading
All articles
What Are Trailing Returns? How the As-of Date Changes the Number
Trailing returns explained: how they are calculated, why the as-of date moves the number, and how to read 1Y, 3Y and 5Y figures in a factsheet.

Free Float Market Capitalisation: How NSE’s IWF Sets Index Weights
How free float market capitalisation is calculated with NSE's investible weight factor, which shares are excluded, and why Nifty and Sensex use it.

Passive Management in PMS: Can a Portfolio Manager Just Track an Index?
Can a PMS be passive? Index replication, direct indexing, rule-based models, SEBI's rules and what a passive PMS costs against a 0.04% ETF.
Read it. Now pressure-test it.
Ask Nyra how this applies to your portfolio, or talk to our team, no pitch, no pressure.