
Rolling Returns vs Trailing Returns: Which Question Each Answers
Rolling returns vs trailing returns compared side by side, with one worked PMS example, SEBI's reporting rules and a guide to which to use when.

A trailing return measures one window that ends on the latest date. A rolling return series measures every window of the same length across the whole record. They are not rival methods: today's trailing return is simply the newest entry in the rolling series. Trailing returns are what Indian factsheets and SEBI's PMS formats show, and they are good for checking recent behaviour on standard dates. Rolling returns are better for judging consistency and setting expectations, but you usually have to build or request them. The most useful habit is to read the two together and ask where today's trailing figure sits in its own rolling history.
Two Return Numbers That Rarely Agree
Open a PMS factsheet and you will see a neat row: 1 year, 3 years, 5 years, since inception. Open a research tool for the same strategy and you may see a 3-year rolling average, a worst 3-year window, or the share of periods in which it beat the benchmark. The figures rarely match. Which one should you believe?
The debate over rolling returns vs trailing returns is usually framed as a contest, and most explainers declare rolling returns the winner. That skips the more useful point: the two measures apply the same arithmetic to different slices of the same history. Each answers a different question, and confusion starts when you use one to answer the other's.
This post keeps the definitions short and focuses on the relationship between the two, a side-by-side comparison, one worked example that computes both on the same eight years of data, and a guide to which measure fits which decision.
The examples use PMS language because the stakes are high: a PMS requires a minimum of Rs 50 lakh per client. The logic applies equally to mutual funds, AIFs and indices.
Rolling and Trailing Returns in One Minute Each
A trailing return is the return over a fixed period that ends on the most recent reporting date. "3-year trailing return as of 31 October 2026" means the annualised return from 31 October 2023 to 31 October 2026. It is a point-to-point return whose end point is pinned to today. When the reporting date moves forward a month, the whole window moves with it: one month drops off the start and one is added at the end.
A rolling return series takes the same calculation and repeats it for every possible window of a chosen length in the record. With monthly data and a 3-year window, you calculate the 3-year return ending in every month for which 36 months of history exist. The result is not one number but a distribution: the worst window, the best, the median, and how often the investment cleared a hurdle such as its benchmark.
Both usually express a multi-year result as an annualised rate using the compound annual growth rate formula: ending value divided by starting value, raised to one over the number of years, minus one. For a PMS, the periodic returns that feed either calculation should be time-weighted returns, which strip out the effect of client deposits and withdrawals.
The difference between rolling and trailing returns is not in the formula. It is in how many windows you look at.
How the Trailing Return Sits Inside the Rolling Series
Picture a strategy with ten years of monthly returns. Its 3-year rolling series has 85 entries, one for each month-end from the end of year three onwards. Line them up in date order. The last entry, the 3-year return ending this month, is exactly the 3-year trailing return printed on this month's factsheet.
| What you look at | Windows used | What it tells you |
|---|---|---|
| 3-year trailing return | The single newest 3-year window | What a holder of the last three years earned |
| 3-year rolling series | Every 3-year window in the record | What holders of any three years earned |
| Trailing return next month | The next entry in the same series | How the newest window shifted |
So trailing vs rolling returns is not a question of two competing methods. It is a question of one observation versus the full set of observations. A trailing return is a sample of size one, chosen for you by the calendar.
Three consequences follow from that relationship:
- A trailing return can never be "wrong" relative to the rolling series. It is one of its values. The only question is whether it is typical or unusual.
- Every month, the trailing figure becomes history. Last month's 3-year trailing return is now the second-newest entry in the rolling series.
- You can always locate the trailing figure inside the distribution. If today's 3-year trailing return is the strategy's best 3-year result ever, that is very different from it being an ordinary one, even though the number on the factsheet looks identical.
That last point is the practical heart of this post.
Rolling Returns vs Trailing Returns Side by Side
Here is the comparison across the dimensions that matter when you are reading a factsheet or choosing a manager.
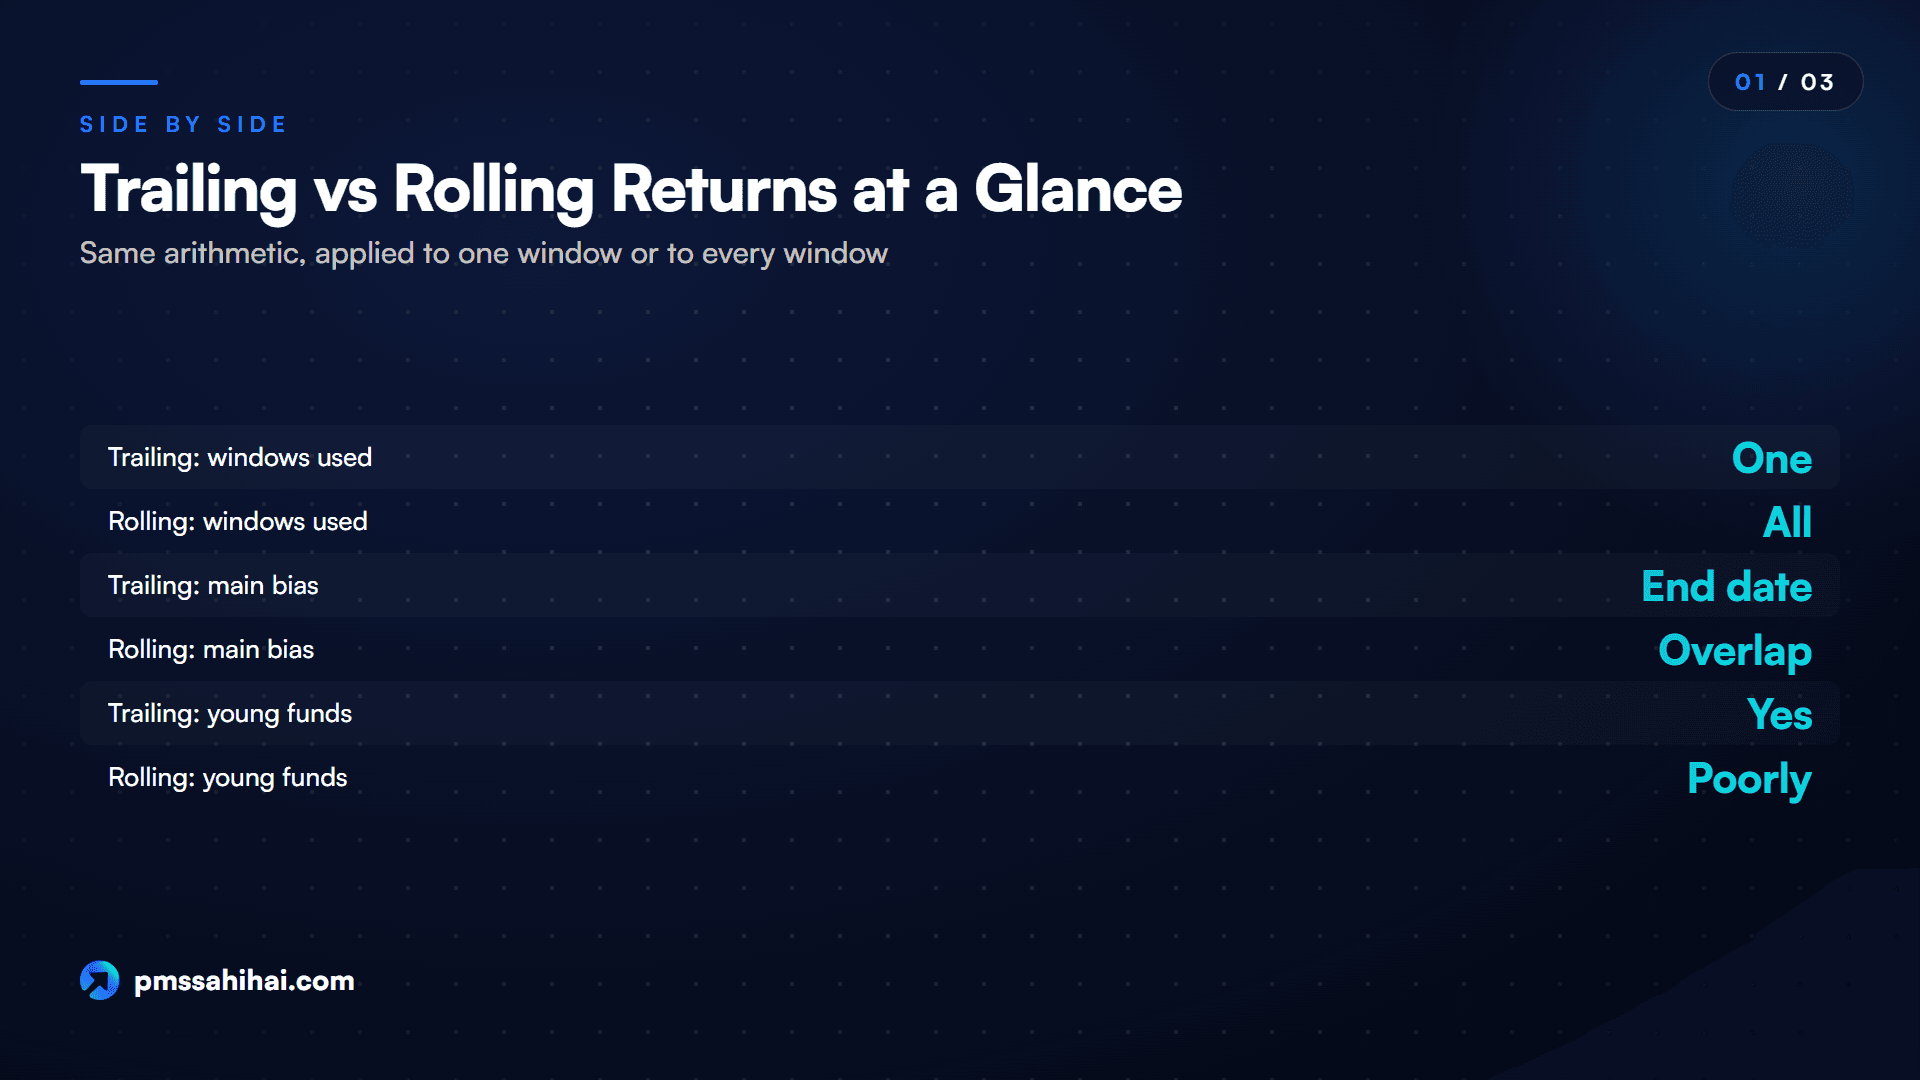
| Dimension | Trailing return | Rolling return |
|---|---|---|
| Windows used | One, ending on the latest date | All windows of a set length |
| Output | A single figure per period | A distribution: worst, median, best, hit rate |
| Data needed | Start and end values | The full periodic history |
| Changes when | The reporting date moves | New data is added (older windows stay fixed) |
| Sensitive to | The start and end dates | Window length and sampling frequency |
| Main bias | End-date bias and recency | Overlap between windows |
| Best question it answers | What happened over the latest period? | What usually happened over a holding period? |
| Where you find it | Every factsheet and regulatory format | Some research tools; often built by hand |
| Typical periods | 1, 3, 5, 10 years and since inception | 1, 3 or 5-year windows, daily to monthly steps |
| Works for young funds | Yes, for the periods that exist | Poorly; few windows |
Two rows deserve a comment.
"Changes when" is the row most investors miss. A trailing return can change sharply even if the newest month was quiet, because a month also drops off the start of the window. In a rolling series, once a window is calculated it stays in the record; adding a month adds one new window.
"Main bias" is the honest way to frame the debate. Trailing returns suffer from end-date bias: the figure depends on where the calendar happens to stop. Rolling returns reduce that bias but bring their own, because consecutive windows share most of their data. Eighty-five monthly 3-year windows from ten years of history are not eighty-five independent tests. Neither measure is bias-free; they are biased in different, knowable ways.
How Fund Reporting Settled on Trailing Periods
Rolling calculations come from statistics, where a moving average slides a fixed window along a data series and recomputes the result at each step. Analysts applied the idea to returns once long price series and spreadsheets made the repeated arithmetic cheap.
Trailing periods became the reporting standard for a simpler reason: they are easy to standardise. If every fund reports 1, 3 and 5 years ending on the same month-end, an investor can lay the numbers side by side and compare like with like. That comparability is a regulatory goal, and Indian rules have moved steadily toward it.
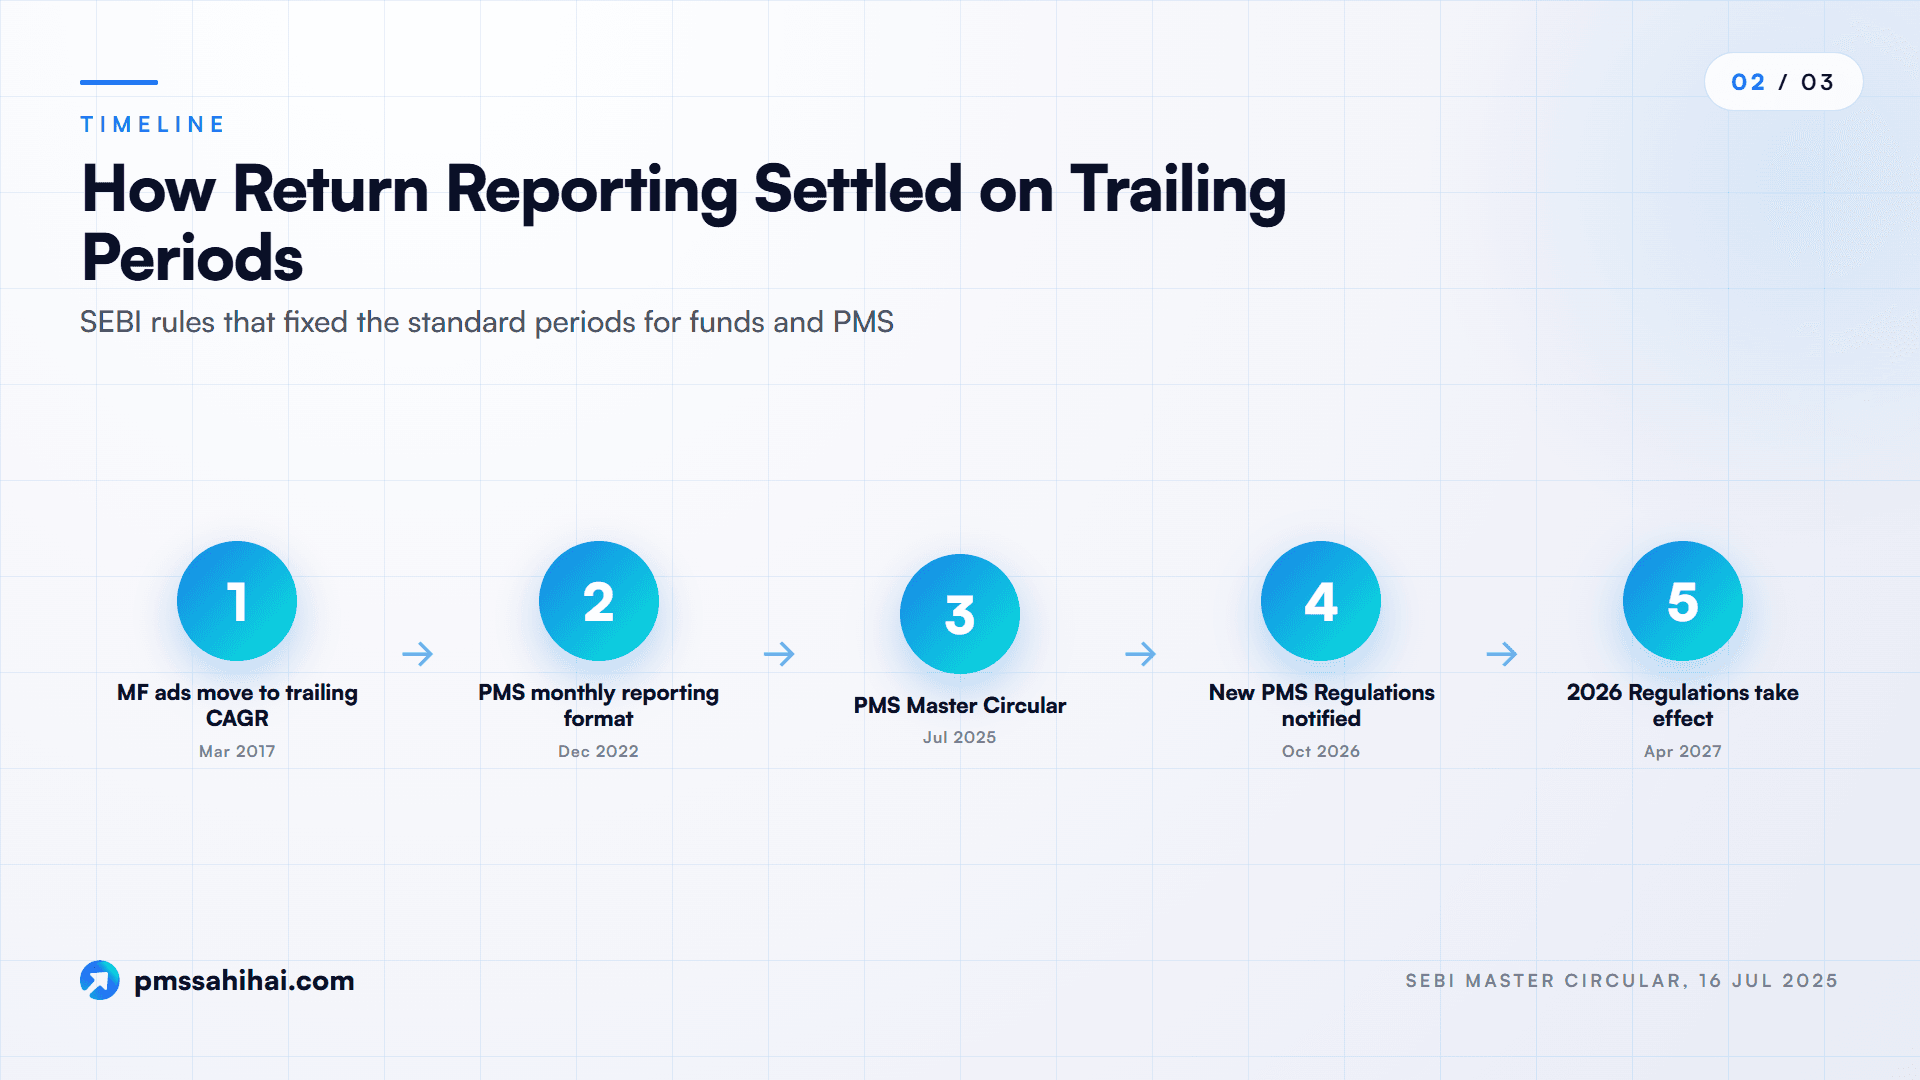
For mutual funds, the turning point was a SEBI circular of 15 March 2017. Before it, fund advertisements had to show returns for as many twelve-month periods as possible over the past three years. The circular replaced that with compound annual growth rates for the past 1, 3 and 5 years and since inception, computed to the last month-end before the advertisement, plus point-to-point returns on a standard Rs 10,000 investment. In effect, a run of discrete annual figures gave way to a standard set of trailing figures.
What SEBI Asks PMS Managers to Show
For portfolio managers, the current reference is SEBI's Master Circular for Portfolio Managers of 16 July 2025, which consolidates circulars including one of 16 December 2022. Its rules are explicit:
- When a manager communicates, advertises or publishes the performance of an investment approach, it must present the approach's time-weighted rate of return (TWRR) along with the trailing return of the selected benchmark.
- When reporting to an individual investor, the manager must show that investor's XIRR, the minimum, maximum and median XIRR across all investors in the approach, and, separately, the approach's TWRR and the benchmark's trailing return.
- The monthly format sent to SEBI and to APMI, the industry association, covers 1, 3 and 6 months, 1 to 5 years, and since inception. Reports reach APMI within 7 working days of month-end.
- The quarterly client report covers 1, 3, 5 and 10 years and since inception, and carries a disclaimer that the performance data is not verified by any regulatory authority.
We searched the Master Circular and the December 2022 circular for any rolling-return requirement in performance reporting and found none. The word "rolling" appears in the Master Circular only in an unrelated context. So the regulated PMS factsheet is, by design, a table of trailing returns. Rolling figures are something you request from the manager, take from a research tool or build yourself.
The new SEBI (Portfolio Managers) Regulations, 2026 were notified on 7 October 2026 and take effect on 1 April 2027. They require a discretionary manager's performance in the disclosure document to be calculated using TWRR for the preceding three years. Until April 2027, the 2020 Regulations and the July 2025 Master Circular apply.
A Worked Example With One PMS Strategy
The numbers below are hypothetical. They describe no real strategy or index and were built to show the mechanics. Treat them as annual net-of-fee TWRR, with annual steps so every figure can be checked on a calculator. Real analysis should use monthly data, which gives many more windows.
Eight Years of Returns
| Year | Strategy | Benchmark |
|---|---|---|
| 1 | 18% | 14% |
| 2 | -22% | -18% |
| 3 | 30% | 26% |
| 4 | 12% | 10% |
| 5 | 6% | 8% |
| 6 | -4% | -2% |
| 7 | 25% | 18% |
| 8 | 9% | 11% |
Over all eight years, the strategy compounds at 8.05% a year against 7.60% for the benchmark. That is a modest lead, built from deeper falls in bad years and stronger gains in good ones.
The Trailing View at the End of Year 8
Stand at the end of Year 8 and read the factsheet columns:
| Trailing return at end of Year 8 | Strategy | Benchmark | Gap |
|---|---|---|---|
| 1 year | 9.00% | 11.00% | -2.00 |
| 3 years (annualised) | 9.36% | 8.68% | +0.68 |
| 5 years (annualised) | 9.20% | 8.81% | +0.39 |
To check the 3-year figure: 1.25 × 0.96 × 1.09 = 1.3080. The cube root of 1.3080 is 1.0936, so the annualised trailing return is 9.36%.
The strategy looks like a steady, slightly-ahead performer with a soft last year. But all three windows end on the same day and share Year 8.
The Rolling View of the Same Data
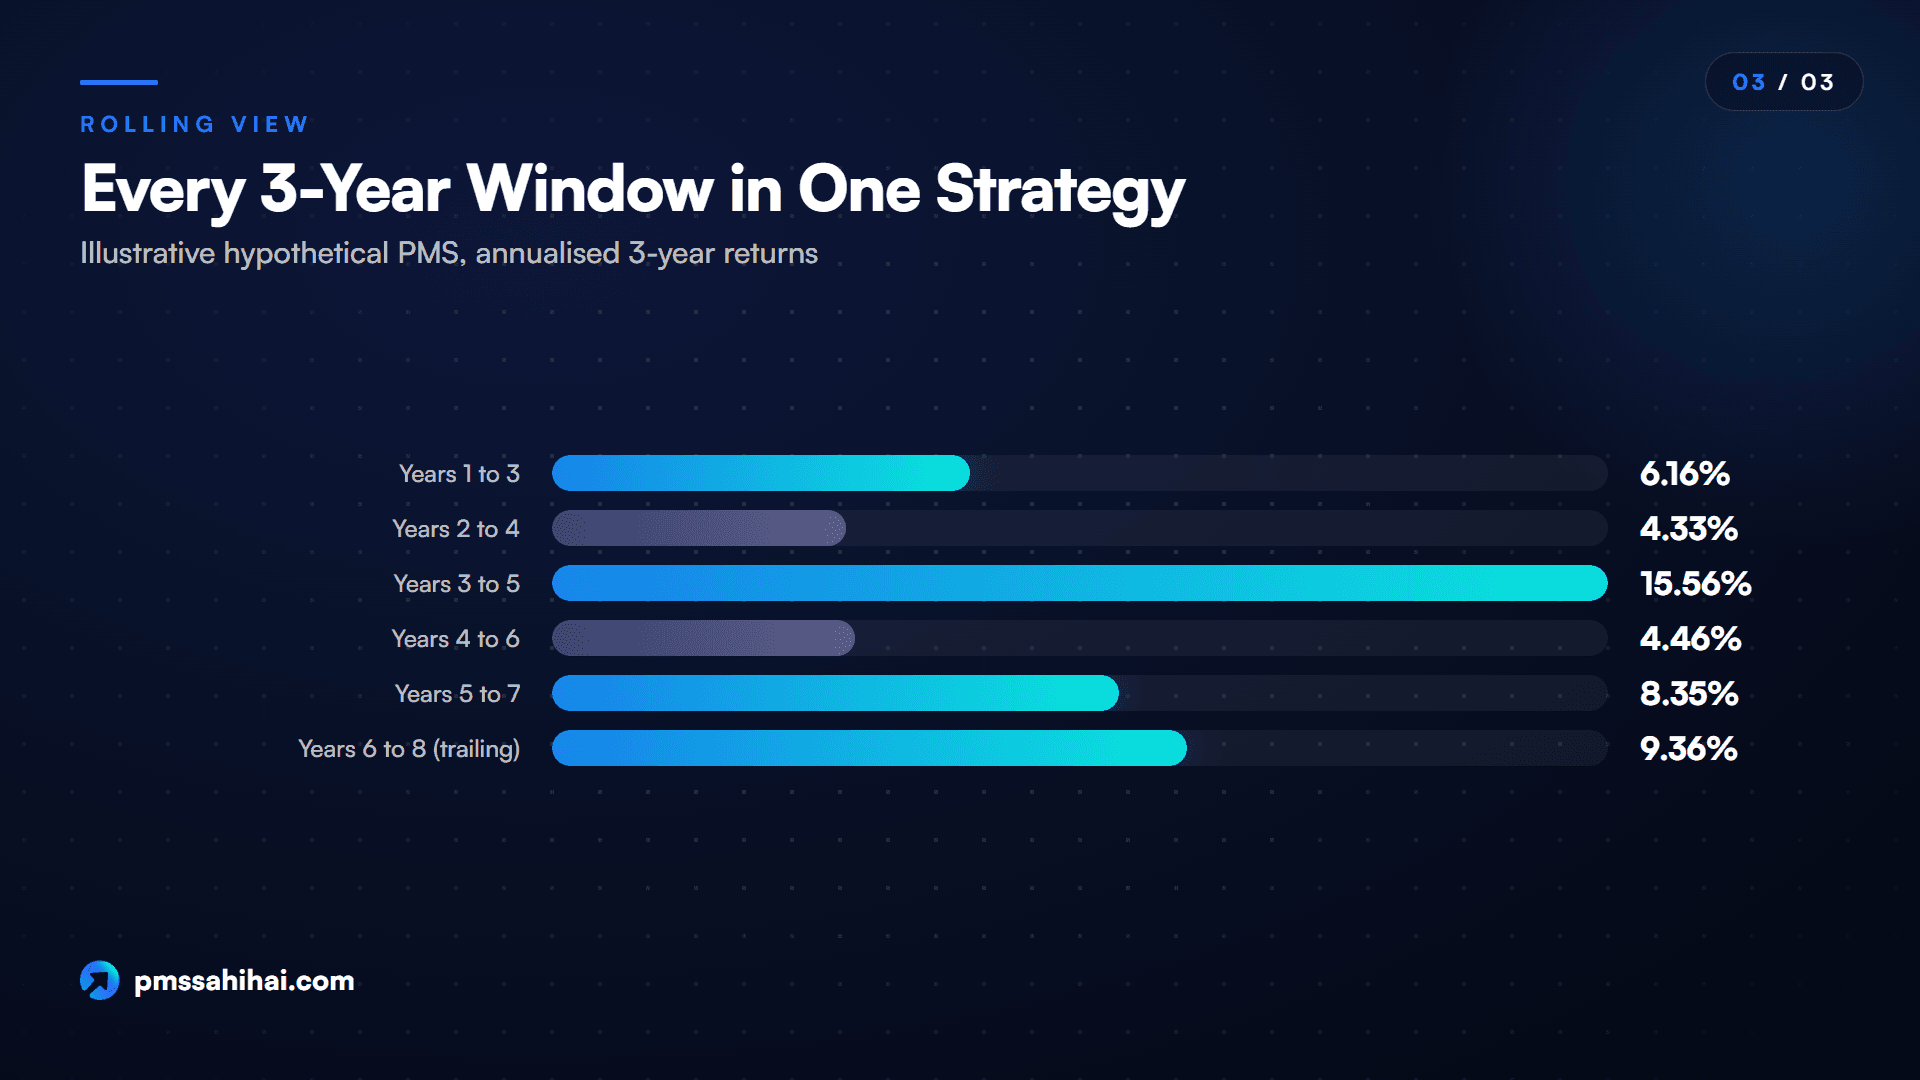
Eight years of annual data give six 3-year windows:
| 3-year window | Strategy | Benchmark | Gap | Rs 50 lakh becomes (strategy) |
|---|---|---|---|---|
| Years 1 to 3 | 6.16% | 5.61% | +0.56 | Rs 59.83 lakh |
| Years 2 to 4 | 4.33% | 4.36% | -0.03 | Rs 56.78 lakh |
| Years 3 to 5 | 15.56% | 14.39% | +1.17 | Rs 77.17 lakh |
| Years 4 to 6 | 4.46% | 5.20% | -0.74 | Rs 56.99 lakh |
| Years 5 to 7 | 8.35% | 7.69% | +0.66 | Rs 63.60 lakh |
| Years 6 to 8 | 9.36% | 8.68% | +0.68 | Rs 65.40 lakh |
Notice the last row. It is the 3-year trailing return from the factsheet, unchanged. The rolling table simply adds the five windows that came before it.
Summarised, the strategy's 3-year record looks like this:
| Rolling 3-year measure | Strategy | Benchmark |
|---|---|---|
| Worst window | 4.33% | 4.36% |
| Median window | 7.26% | 6.65% |
| Best window | 15.56% | 14.39% |
| Windows ahead of benchmark | 4 of 6 | n/a |
| Windows with a loss | 0 of 6 | 0 of 6 |
An investor who held any three years earned between 4.33% and 15.56% a year. The strategy beat its benchmark in four of six windows, and when it lagged, it lagged by less than one point.
Where Today's Trailing Figure Ranks
Now combine the two views. Today's 3-year trailing return is 9.36%. Of the six 3-year windows, four are lower than that. Using the usual definition of a percentile rank, the share of observations below a value, today's trailing figure sits at roughly the 67th percentile of the strategy's own history.
The factsheet's 9.36% is above the strategy's typical 3-year result of 7.26%, but it is not an outlier like the 15.56% window. A new investor who anchors on 9.36% is anchoring slightly high. One who had anchored on 15.56%, when that was the trailing number at the end of Year 5, would have been badly misled.
The 1-year column works the other way. The latest year lagged the benchmark by two points, which might prompt a worried call. But the strategy lagged in four of eight years (Years 2, 5, 6 and 8), so a lagging year is normal for it, not a new development.
How One Year Can Move a Three-Year Number
The rolling table also exposes the most confusing feature of trailing returns: the base effect, where the figure moves because of the year that dropped out, not the year that was added.
- At the end of Year 4, the 3-year trailing return was 4.33%.
- At the end of Year 5, it was 15.56%.
A jump of more than eleven points suggests a spectacular Year 5. In fact, Year 5 was a 6% year that trailed the benchmark by two points. The jump happened because the -22% of Year 2 left the window.
A year later the effect reversed. At the end of Year 6, the 3-year trailing return fell back to 4.46%, though Year 6 lost only 4%. This time the 30% gain of Year 3 dropped out.
The 5-year column shows the same thing between Years 7 and 8: the 5-year trailing return fell from 13.12% to 9.20% while the strategy earned a positive 9% in Year 8, because Year 3's 30% left the window.
This is end-date bias in its plainest form, and it explains a common investor question: "Why did my fund's 3-year return jump when the market barely moved?" Look at what dropped off the start of the window before reading anything into what was added at the end.
Where Each Measure Shows Up Today
Trailing returns are everywhere. Mutual fund advertisements and PMS factsheets use them because the rules specify trailing periods, down to the monthly PMS reporting format of December 2022, and broker and platform screens usually default to them. Several ranking explainers note that fund houses and websites mostly publish trailing figures.
Rolling returns live in research tools and spreadsheets. Some fund research platforms show rolling figures for mutual funds, and some advisers build them as part of due diligence. For PMS strategies, the raw material is the monthly TWRR series. If a manager will share monthly returns, a spreadsheet can produce a rolling series in minutes: chain-link each block of 36 months, annualise, and drag the formula down. SEBI also publishes portfolio managers' monthly reports through a search page on its site, though the page states that SEBI has not approved or certified the data.
Technology has made rolling returns cheap but not standard. The calculation is now one spreadsheet formula, but the regulated document still presents trailing figures.
What Each Measure Does Well
The useful comparison is not "which is better" but "what does each do well". Both have real strengths.
Strengths of trailing returns:
- Standard dates make comparison fair. When every PMS reports 1, 3 and 5 years to the same month-end, you compare managers over identical market conditions. Rolling series from different tools often use different windows and steps.
- They show what is happening now. A sudden change in a strategy's 1-year trailing return relative to its benchmark can signal a style shift, a manager change or a concentrated bet going wrong. Rolling histories react slowly to new information.
- They need very little data. Two values and a calculator are enough, and every regulated factsheet supplies them.
- They match the regulated disclosure. Because SEBI's PMS formats pair TWRR with the benchmark's trailing return, trailing figures are the numbers that are audited and reported every month.
Strengths of rolling returns:
- They test every entry date. You do not know which month your money will go in. A distribution of all historical entry points answers that uncertainty better than a single window.
- They give a worst case drawn from history. "The worst 3-year result was 4.33% a year" is easier to weigh than a volatility number. It is not a floor, but it is concrete.
- They produce a simple consistency measure. "Ahead of the benchmark in 4 of 6 windows" can be compared across managers, provided the benchmark and period match.
- They neutralise the base effect. Because all windows are on the table, a single exceptional year that falls in or out of the trailing window cannot reshape the picture.
Strengths of using both: Asking where the factsheet figure ranks in the strategy's own history captures most of what rolling analysis offers without abandoning the standard factsheet.
How PMS Sahi Hai Helps You Read Both Numbers Together
PMS Sahi Hai is a research platform for PMS, AIF and GIFT City funds, and its starting rule fits this topic well: the homepage says every number comes with its source, and that returns are shown with their period, benchmark and source. That is the minimum you need before comparing any trailing figure.
Here is what the site offers, described only by what its pages say:
- Side-by-side comparison. The PMS Sahi Hai compare page lets you filter strategies by category, fund house, benchmark, AUM and style, and select up to four to compare. It states that returns for periods of one year or more are annualised (CAGR). Use it for the first job in the decision table above: trailing figures on matching dates and matching benchmarks.
- A score that looks across horizons. The Nyra methodology (version 1.1, effective 1 July 2026) scores each strategy from 0 to 10 on five pillars with fixed weights. Return Performance (30%) uses excess return over the stated benchmark across 1, 3 and 5 years, weighted toward the longer horizons. A separate Consistency pillar (15%) looks at how often the strategy beat its benchmark across horizons and how stable that outperformance was. Strategies with less than 12 months of track record are Not Rated, and scores are recalculated monthly. The methodology page does not say whether its windows are rolling or trailing, so treat the score as a cross-horizon summary and still check the rolling record yourself.
- Guides for the next step. The PMS Sahi Hai guide on how to read a PMS factsheet explains the net TWRR columns and why the as-of date decides which periods appear. Its article on evaluating a fund manager beyond the return number recommends checking rolling 1-year and 3-year returns across the manager's full history.
- An example of a trailing snapshot, labelled as one. The site's review of PMS performance to June 2026 found 309 of 429 strategies ahead of their stated benchmark over one trailing year to 30 June 2026, and it says plainly that one year says nothing about repeatability. That is the right way to present a trailing figure.
Nyra, the platform's AI research tool, answers open questions on PMS, AIF and GIFT City, and its page says every answer is source-cited, so it is a natural place to put the questions in this post, such as what period and benchmark a figure uses. Nyra describes itself as an analytical tool, not a SEBI-registered investment adviser, and it does not replace asking the manager for the monthly series behind a rolling analysis.
Matching the Measure to Your Question
The simplest way to settle trailing returns vs rolling returns is to start with your question, not the measure.
| Your question | Use | Why |
|---|---|---|
| How did this strategy do over the latest year or three? | Trailing return | That is exactly what it measures |
| Is this manager consistently better than the benchmark? | Rolling return hit rate | Tests every window, not one |
| What should I realistically expect over a 3 to 5-year hold? | Rolling median and worst window | Shows the range holders actually got |
| Is today's headline figure unusually good? | Both: percentile of trailing within rolling | Tells you if you are buying after a peak |
| Has something changed in the strategy recently? | Trailing 1-year vs benchmark, against its rolling history | Flags a break from normal behaviour |
| How has my own money done? | Your XIRR | Your deposits and withdrawals matter |
| Which of two managers to shortlist? | Trailing on identical dates, then rolling on identical windows | Fair comparison first, consistency second |
A few practical rules make this easier:
- Never compare a trailing figure with a rolling average. A 3-year trailing return of 12% and a 3-year rolling median of 10% are different statistics. Compare like with like.
- Match the window to your holding period. If you expect to stay five years, a 1-year rolling series tells you mainly about volatility, not about your likely outcome.
- Keep the benchmark fixed. A rolling hit rate against a price index will look better than one against a total return index.
- Note the as-of date. A trailing return without a date is not a usable number, and two trailing returns with different dates are not comparable.
A trailing figure tells you where you stand; the rolling distribution tells you whether that is normal.
Blind Spots Shared by Both Measures
Rolling returns fix the biggest weakness of trailing returns, but several limits apply to both, and rolling returns add one of their own.
- Both describe the past. No arrangement of historical windows predicts the next one. Changes in manager, assets, fees or market regime can make a clean record irrelevant.
- Both are only as good as the input series. If the monthly returns are gross of fees, from a model portfolio, or exclude cash, both the trailing and the rolling figures inherit the problem. SEBI's PMS rules require net-of-fee TWRR and bar model portfolio returns, but data from other sources may not follow those rules.
- Both ignore what happened inside a window. A 3-year return of 9% says nothing about a 30% fall in the middle. Drawdown measures are needed for that.
- Rolling windows overlap heavily. In the example, six 3-year windows came from eight years, but you can pick at most two that share no years, such as Years 1 to 3 and Years 4 to 6. With monthly steps, consecutive windows share 35 of 36 months. A large count of windows can look like strong evidence when it is really a few independent periods counted many times.
- Rolling returns need history. A strategy with three years of data has exactly one 3-year window, which is its trailing return. For young PMS strategies, the comparison collapses and you are left with trailing figures plus judgement.
- Neither handles survivors. Through survivorship bias, strategies that closed or merged after poor results disappear from both trailing tables and rolling studies, so peer averages can look better than the experience of all investors.
- Trailing returns invite recency bias. People show recency bias, giving extra weight to recent events, and a trailing return is built from the most recent period by design. Marketing is naturally loudest after strong runs, when trailing figures look their best.
None of these is a reason to discard either measure, only to read both with a date, a benchmark and a question attached.
Reading Rolling and Trailing Returns Together
The comparison of rolling returns vs trailing returns ends in a partnership, not a verdict. Trailing returns are the standard, audited, comparable snapshot that every factsheet supplies. Rolling returns are the context that tells you whether that snapshot is typical. Treat the trailing figure as the newest point in a series, not as a summary of the series.
In practice, that means three habits:
- Read the trailing figures with their as-of date and benchmark, and check what dropped out of the window since the last report.
- Ask for or build the rolling series for the window that matches your holding period, and note the worst, median and hit rate.
- Locate today's trailing return inside that distribution before you let it shape your expectations.
If the headline number is also the best rolling result, be careful. If it sits near the median, the factsheet is telling a fair story. PMS Sahi Hai's comparison tools and Nyra can handle the first step, matched trailing figures with sources; the rolling check is the question to put to every manager on your shortlist.
Check Any Return Figure Against Its Own History
The next time a factsheet or pitch shows you a 3-year number, ask two questions before you react to it. What dropped out of the window since the last report? And where does this figure rank among all the 3-year results this strategy has produced? If the manager cannot or will not share the monthly returns to answer the second question, treat the headline figure with extra caution. Put rolling and trailing returns side by side, on the same benchmark and dates, before you commit Rs 50 lakh or more. To start, compare PMS strategies on PMS Sahi Hai on matching dates and benchmarks, then ask Nyra what period and benchmark sit behind any figure you are shown.
PMS Sahi Hai is a distributor of Portfolio Management Services and Alternative Investment Funds, APMI-registered (Registration No. APRN08358). This article is for education only and is not investment advice, a recommendation, or an offer to buy or sell any security. Investments in securities markets are subject to market risks; read all scheme-related documents carefully. Past performance is not indicative of future results. Consult your advisor before investing.
Ishaan founded PMS Sahi Hai to make India's PMS, AIF and GIFT City markets legible to serious investors, comparing every SEBI-registered manager on the same comparative basis, with no shelf products and no commission bias.
Frequently asked
What is the difference between rolling and trailing returns?
A trailing return measures a single window that ends on the latest date, such as the last three years. Rolling returns measure every window of the same length across the full history, giving a range of results. The difference between rolling and trailing returns is the number of windows: one chosen by the calendar, or all of them. Today's trailing return is the newest value in the rolling series.
Which is better, rolling returns or trailing returns?
Neither is better for every purpose. Trailing returns are better for checking recent performance on standard dates and comparing funds over identical periods. Rolling returns are better for judging consistency and setting realistic expectations for a holding period. The most informative approach uses both: read the trailing figure, then see where it ranks within the rolling distribution for the same window length.
Is the trailing return part of the rolling return series?
Yes. If you calculate 3-year rolling returns for every month in a fund's history, the final entry, the window ending on the latest month, is exactly the 3-year trailing return. That is why a trailing return can be described as a sample of one from the rolling series. Next month, it becomes the second-newest observation and a new trailing figure takes its place.
Why did my fund's 3-year return jump when the market was flat?
Usually because a weak period dropped out of the start of the window. A trailing return loses its oldest month or year each time it updates, so removing a large loss can lift the figure sharply even if the newest period was ordinary. This base effect works in reverse too: when a strong period drops out, the trailing return can fall despite a positive recent result.
Can a fund have good trailing returns but poor rolling returns?
Yes. If one exceptional recent period sits inside the trailing window, the 1, 3 and 5-year figures can all look strong while most earlier rolling windows were weak. The reverse also happens: a consistent fund can show a soft trailing number after one poor year. Checking the rolling worst window, median and benchmark hit rate reveals which case you are looking at.
Do PMS factsheets show rolling or trailing returns?
PMS factsheets show trailing returns. SEBI's Master Circular for Portfolio Managers of 16 July 2025 requires managers to present the time-weighted return of an investment approach with the trailing return of its benchmark, over standard periods such as 1, 3 and 5 years and since inception. We found no rolling-return requirement in the PMS performance rules, so rolling figures usually have to be requested or built.
How many years of data do rolling returns need?
You need more history than the window length, and preferably much more. A 3-year window needs at least three years for a single result, which is just the trailing return. With monthly data, five years gives 25 three-year windows and ten years gives 85, though overlapping windows share most of their months, so young strategies offer limited rolling evidence.
Do rolling returns predict future returns?
No. Rolling returns summarise how an investment behaved across past periods, which helps set expectations and judge consistency. They cannot account for future changes in markets, the manager, the asset base or fees. A strong rolling record raises confidence that results were not a matter of one lucky date, but it is still a description of history, not a forecast.
Keep reading
All articles
Free Float vs Market Cap: What the Gap Reveals About a Stock
Free float vs market cap compared with worked examples: what the gap reveals about promoter holding, index weights and PMS benchmarks.
Passive vs Active Management: Mutual Funds, ETFs and PMS Compared
Passive vs active management in India: 2026 cost caps, SPIVA evidence, tracking error, and when index funds, active funds or PMS fit.
Information Ratio vs Sharpe Ratio: Which One to Trust, and When
Information ratio vs Sharpe ratio: benchmark-relative vs risk-free-relative, when each misleads, and how PMS investors should read both together.
Read it. Now pressure-test it.
Ask Nyra how this applies to your portfolio, or talk to our team, no pitch, no pressure.