
Free Float vs Market Cap: What the Gap Reveals About a Stock
Free float vs market cap compared with worked examples: what the gap reveals about promoter holding, index weights and PMS benchmarks.


Full market capitalisation values every share a company has issued; free float market cap values only the shares that can realistically trade. The gap between the two is mostly promoter holding, government and strategic stakes, and locked-in shares. Indian indices weight stocks by free float, so a company that looks bigger on full market cap can carry a smaller index weight. Read both numbers together and you learn who controls a company, how much of it you can actually buy, and why a PMS's holdings may look nothing like its benchmark.
Why Free Float vs Market Cap Matters Before You Buy
Open any stock page and the first size number you see is market capitalisation. It is a useful headline, but it answers only one question: what would every share of this company be worth at today's price? It does not tell you how many of those shares are ever likely to change hands.
That second question is what free float answers. In many Indian companies a promoter family, a parent company or the government holds a large block that is not for sale in the normal course. Those shares count in full market cap, but they are not part of the market that you, a mutual fund or a portfolio manager can trade in.
The free float vs market cap comparison therefore is not an academic footnote. It shapes three things that matter to an investor:
- How big a company really is in an index. Nifty and Sensex weights follow free float, not total size.
- How much of a stock is available to buy and sell. A large company with a thin float can trade like a much smaller one.
- What the ownership structure looks like. The size of the gap is a quick read on promoter holding and strategic control.
This guide is about the comparison itself. The definition and calculation of free float market capitalisation, and the definition of market capitalisation with SEBI's size categories, are covered in our companion explainers; here they get a short recap so the side-by-side makes sense. The focus is the gap: how it is measured, a worked example, what it reveals, and how a PMS investor can use it.
Full Market Cap and Free Float Market Cap in Brief
Full market capitalisation is the share price multiplied by the total number of shares outstanding. It includes every share, whoever holds it: promoters, the government, a foreign parent, employee trusts, retail investors and institutions.
Free-float market cap is the share price multiplied by only those shares that are considered available for trading. In practice, index providers start with full market cap and multiply it by a free float factor, a number between 0 and 1. NSE calls this factor the investible weight factor (IWF).
So the two numbers are linked by one multiplication:
- Full market cap = share price × total shares outstanding
- Free-float market cap = full market capitalisation × float factor
If a company's free float factor is 0.40, its free float market cap is 40% of its full market cap, and the other 60% is the gap. If the factor is 1.00, the two numbers are identical. A free-float market cap can never be larger than full market cap, because the factor cannot exceed 1.
That is all the definition you need for the comparison. What makes it interesting is which shares get excluded, and why.
How Indian Indices Moved From Full Cap to Free Float
Indian benchmarks did not always work this way. For years both main indices were weighted by full market cap, which meant a company's index weight followed its total size regardless of how many shares actually traded.
The switch came in two steps:
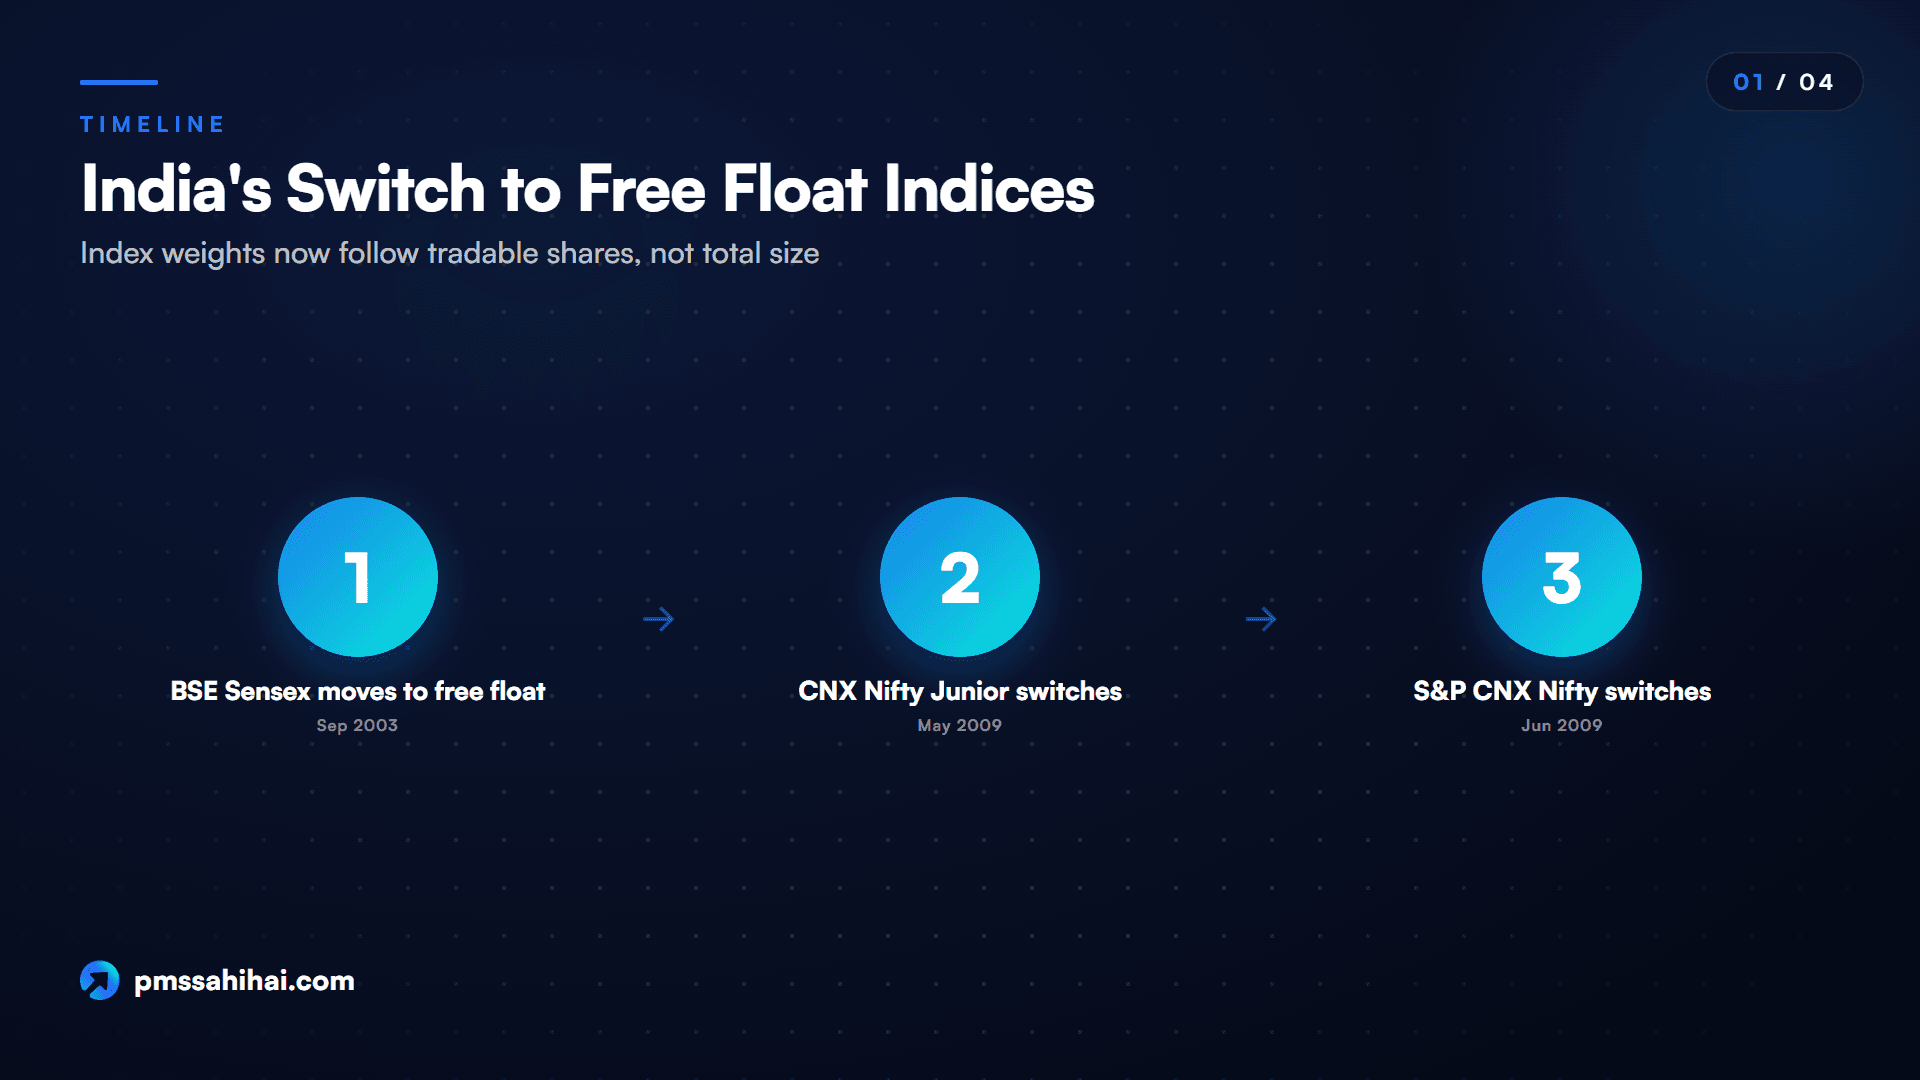
- BSE Sensex, 1 September 2003. BSE rebuilt the Sensex on a float-weighting basis, using an investable weight factor to strip out closely held and cross-held shares. It was described at the time as the first broad Indian index to adopt the method.
- NSE indices, 2009. India Index Services & Products Ltd (IISL), NSE's index arm, moved the CNX Nifty Junior to free float with effect from 4 May 2009, and the S&P CNX Nifty (today's Nifty 50) with effect from 26 June 2009. A few smaller indices, such as CNX Realty and CNX PSU Bank, were already float-based by then.
Two design choices from the 2009 Nifty transition still explain how the system works today. First, IISL adjusted the index divisor so that the index value did not jump on the changeover day; the Nifty after 26 June 2009 is the same index, not a new one. Second, the float factor was to be based on the public shareholding each company discloses to the exchanges, with further exclusions for government strategic holdings, promoter shares held through ADRs and GDRs, strategic corporate stakes, FDI holdings and cross-holdings, and it was to be updated every quarter.
India was following a global pattern. The S&P 500, the MSCI World Index and the FTSE 100 also use float-adjusted weights. The logic is the same everywhere: an index that is meant to be tracked by funds should reflect the shares those funds can actually buy.
Free Float vs Market Cap Side by Side
Here is the comparison in one table.
| Basis | Full market capitalisation | Free-float market cap |
|---|---|---|
| What it measures | Total value of all shares outstanding | Value of shares considered available for trading |
| Formula | Price × total shares | Full market cap × free float factor (IWF) |
| Shares counted | All, including promoter, government and strategic stakes | Public shares that are not locked in or strategically held |
| Size relative to the other | Always the larger (or equal) number | Always the smaller (or equal) number |
| Changes when | Price moves or share count changes | Price moves, share count changes, or ownership mix changes |
| Main use in India | Ranking companies by size; SEBI/AMFI large, mid and small cap buckets | Index weights for Nifty and Sensex; index eligibility screens |
| What it signals | Overall corporate value | Investable value and depth of the tradable market |
| Data source | Exchange price and share capital | Quarterly shareholding pattern plus the index provider's rules |
The Formula Difference in One Line
The only mathematical difference is the float factor. Everything else (price, share count) is common to both. That is why the ratio of the two numbers, free float market cap divided by full market cap, is simply the factor itself. When people talk about the "free float gap", they mean one minus that factor.
What Each Number Counts and Leaves Out
Full market capitalisation leaves nothing out. Free-float market cap leaves out shares held by people or entities with a strategic interest in the company. NSE's guideline note on the investible weight factor lists 22 categories that are excluded "where identifiable separately". The main ones are:
- Shares reported under the promoter category, promoter family members, and persons acting in concert with promoters
- Depository receipts held by promoters
- Associate and group company cross-holdings
- Trusts managed by promoters, and employee benefit or welfare trusts
- Holdings of directors and key managerial personnel
- Shareholders that nominate, or are entitled to nominate, a board member
- Strategic investment by corporate bodies
- Central and State Government holdings, and those of government-backed corporations (insurance companies are carved out)
- Foreign direct investment, private equity investors and funds, foreign venture capital investors and sovereign wealth funds
- Shares under lock-in reported in the public category
- Shares transferred to the Investor Education and Protection Fund
The list is longer than most explainers suggest. Many articles, and the textbook definition of public float, describe free float as the shares in public hands as opposed to promoters, officers and governments. Under NSE's rules it is narrower than "the public shareholding", as the next sections show.
Worked Example: One Company, Two Market Caps
Take an illustrative company, ABC Industries. The numbers are invented to show the mechanics; they do not describe any real stock.
Step 1: Full Market Capitalisation
ABC Industries has 50 crore shares outstanding and the share price is ₹800.
Full market cap = 50 crore × ₹800 = ₹40,000 crore
Step 2: The Free Float Factor From the Shareholding Pattern
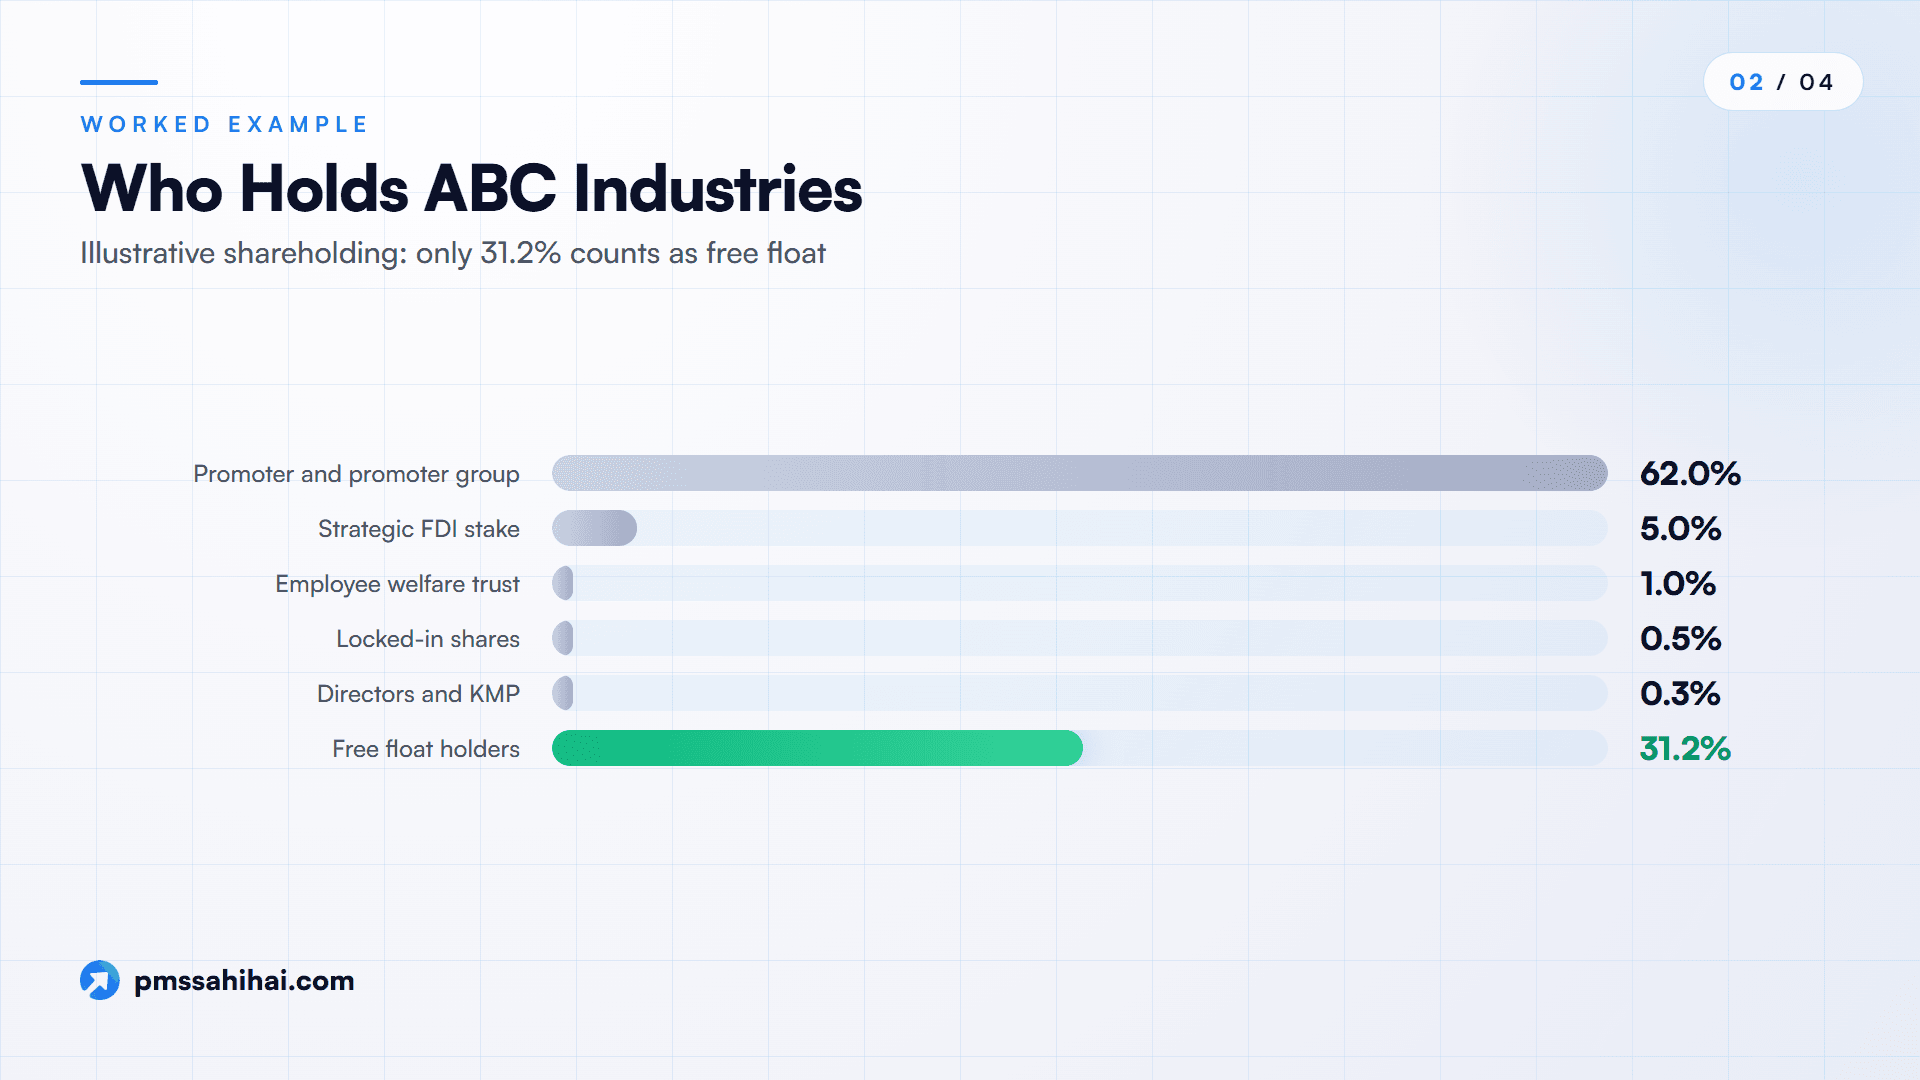
ABC's latest quarterly shareholding pattern shows:
| Holder | Share of equity | In free float? |
|---|---|---|
| Promoter and promoter group | 62.0% | No |
| Foreign parent's strategic stake held under the FDI route (shown under public) | 5.0% | No |
| Employee welfare trust | 1.0% | No |
| Shares from a recent preferential issue under lock-in | 0.5% | No |
| Directors and key managerial personnel | 0.3% | No |
| Mutual funds, insurers, foreign portfolio investors, retail and others | 31.2% | Yes |
| Total | 100.0% |
The company reports public shareholding of 38% (everything outside the promoter group). But under NSE-style rules, the strategic FDI stake, the employee trust, the locked-in shares and the director holdings come out as well.
Non-free-float shares = 62.0% + 5.0% + 1.0% + 0.5% + 0.3% = 68.8%
Free float factor = 1 − 0.688 = 0.312
Step 3: Free Float Market Cap and the Gap
Free-float market cap = ₹40,000 crore × 0.312 = ₹12,480 crore
The gap = ₹40,000 crore − ₹12,480 crore = ₹27,520 crore, or 68.8% of the company's value.
Three things stand out:
- On full market cap, ABC is a ₹40,000 crore company. In a free float index, it behaves like a ₹12,480 crore company.
- Its public shareholding (38%) overstates its free float (31.2%) by almost seven percentage points.
- If the promoter sold 10% of the company through an offer for sale tomorrow, full market capitalisation would not change at all, but the float factor would rise to about 0.412 once the index provider reset it, lifting free float market cap by roughly ₹4,000 crore at the same share price.
That last point matters. Full market cap changes with price and share count. Free-float market cap also changes with who owns the shares.
Worked Example: Why a Bigger Company Can Weigh Less in an Index
Now add a second illustrative company, XYZ Services, and build a two-stock index.
| ABC Industries | XYZ Services | |
|---|---|---|
| Full market capitalisation | ₹40,000 crore | ₹30,000 crore |
| Free float factor | 0.312 | 0.85 |
| Free-float market cap | ₹12,480 crore | ₹25,500 crore |
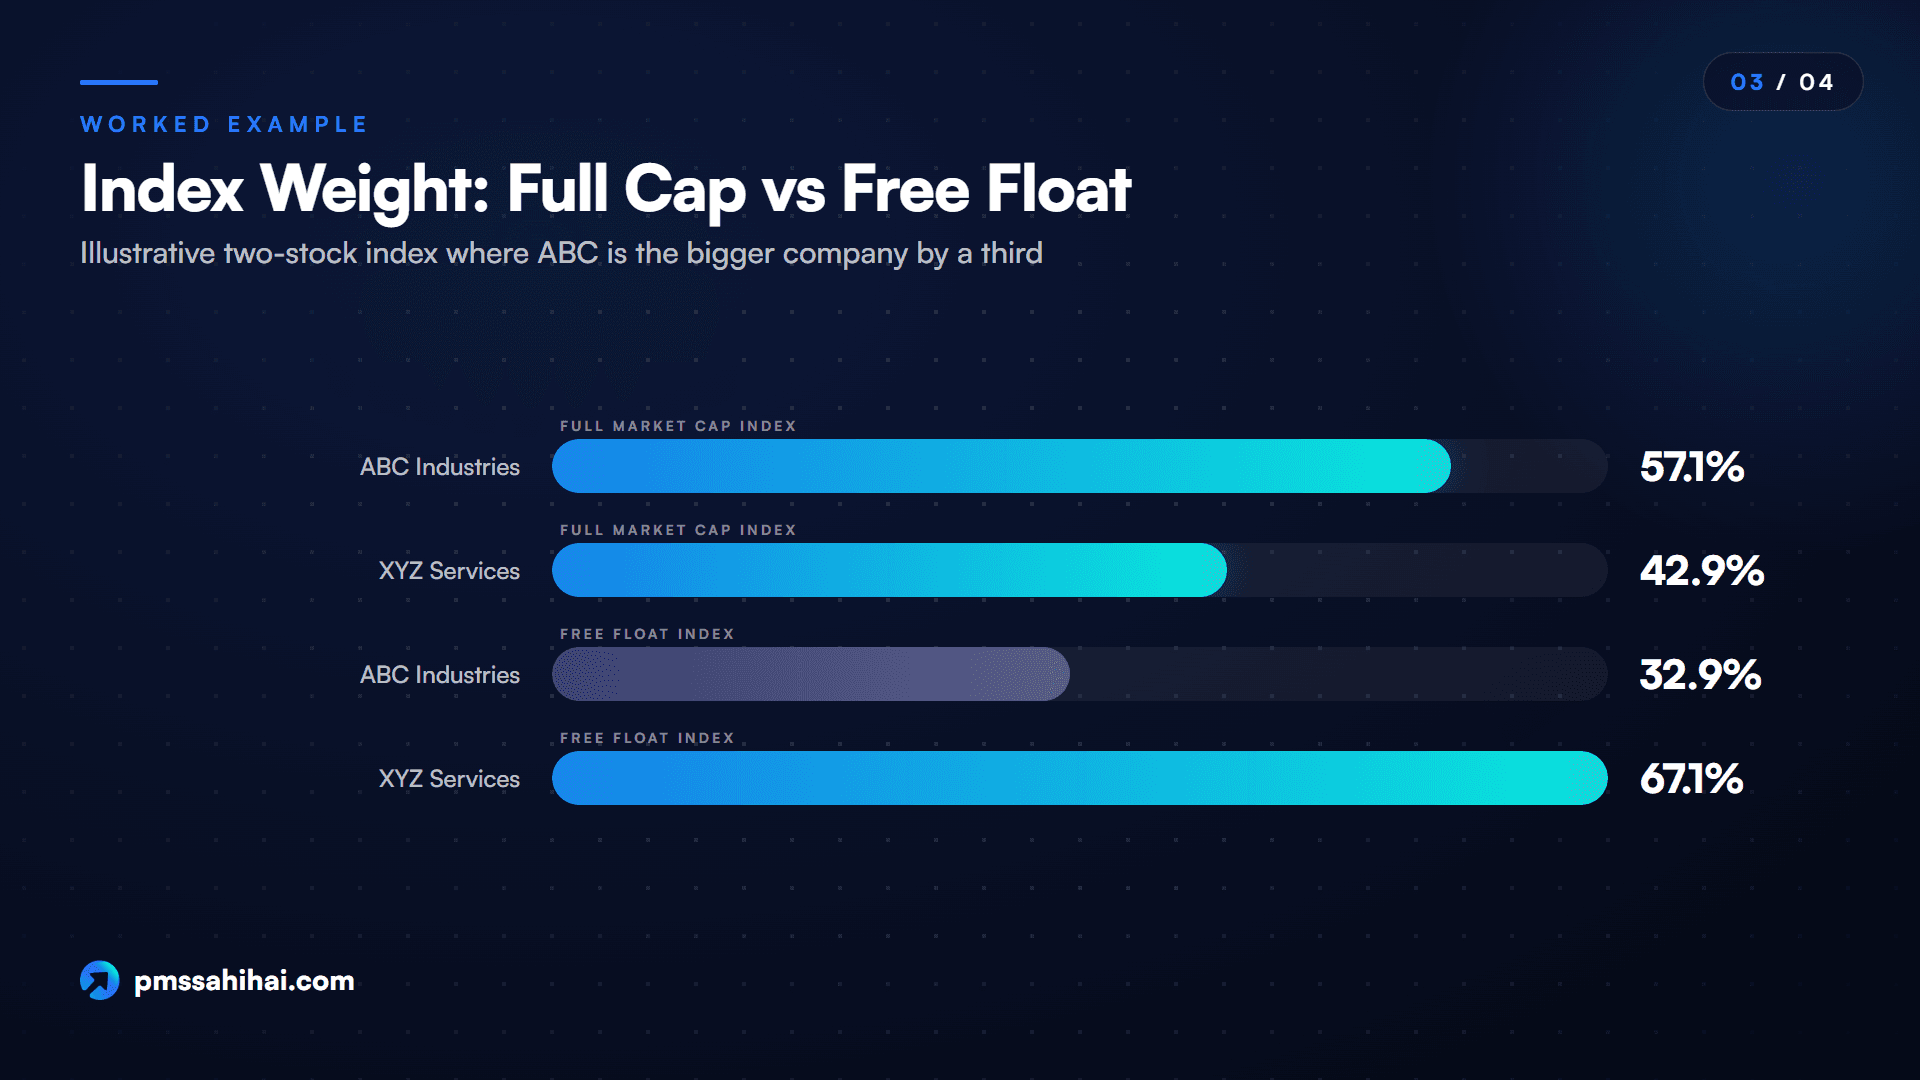
| Weight if the index used full market cap | 57.1% | 42.9% |
| Weight in a free float index | 32.9% | 67.1% |
ABC is the bigger company by a third. Yet in a free float index, XYZ carries about twice ABC's index weight, because far more of XYZ is available to trade.
Now suppose ABC's share price rises 10% and XYZ's stays flat.
- In a full market cap index, the index rises by 57.1% × 10% = 5.7%.
- In a free float index, the index rises by 32.9% × 10% = 3.3%.
The same day, the same prices, two very different index moves. This is exactly what the 2003 and 2009 changes were meant to fix: before them, closely held giants could move the benchmark far more than their tradable shares justified. NSE describes the aim as limiting the influence of a company "to the extent of its actual free float".
For an investor, the lesson is that index weight is not a ranking of corporate size. A stock that sits near the top of a full market cap league table can sit well down the Nifty weight table, and vice versa.
What the Free Float Gap Tells You About a Company
The gap is a compact summary of ownership. Different causes produce the same number, so it is worth reading which bucket the gap comes from.
High Promoter Holding
In most Indian companies, promoter holding is the largest single part of the gap. A promoter group holding 70% produces a float factor of 0.30 or lower before any other exclusion.
High promoter holding is neither good nor bad by itself. Supporters see alignment: the people running the business have most of their wealth in it. Critics see concentration: minority shareholders have less say, and a promoter's decisions on related-party deals, pledging or succession carry more weight. The free float vs market cap gap does not settle that debate. It just tells you how large the controlling block is relative to the tradable market.
Government and Strategic Stakes
For public sector companies, the gap is mostly the government's holding. NSE excludes Central and State Government stakes, whether or not the government is the promoter, while carving out insurance companies.
The extreme case shows how far apart the two numbers can drift. Business Standard reported in May 2024 that public shareholding in LIC stood at 3.5% as of 31 March 2024, and that SEBI had given LIC until 16 May 2027 to reach 10% public shareholding. At that level, LIC's full market cap described a very large company while the tradable part was a small fraction of it. Those figures are dated; check the latest shareholding pattern before relying on them.
Strategic stakes work the same way. A foreign parent holding shares through the FDI route, a private equity investor, or a sovereign wealth fund with a long-term position is treated by NSE as non-free-float even though it may appear in the public category of the shareholding pattern.
Why Public Shareholding Is Not the Same as Free Float
This is the single most common mix-up. The rules on minimum public shareholding require most listed companies to keep at least 25% of shares with the public over time; for very large listings, Business Standard reported that companies with a market capitalisation above ₹1 trillion get five years from listing to reach that level. But "public" in a shareholding pattern simply means "not promoter". It can include:
- A strategic foreign investor
- A private equity fund in a long-term lock-up
- An employee welfare trust
- Directors and senior managers
All of these are public for disclosure purposes and non-free-float for index purposes. So public shareholding is a ceiling on free float, not a measure of it. In the ABC example, public shareholding was 38% but the free float factor was 0.312.
Lock-ins, IPOs and Changing Gaps
The gap is not fixed. It moves when:
- Lock-ins expire. After an IPO or preferential issue, shares under a lock-up period cannot be sold; they join the float when the lock-in ends.
- Promoters sell. An offer for sale or block deal by a promoter widens the float and narrows the gap.
- Promoters buy or a company buys back shares. A creeping acquisition or a buyback tilted toward public holders can narrow the float.
- Strategic investors exit. When a private equity fund sells to institutions, those shares move from non-free-float to free float.
Index providers reset their factors from quarterly shareholding patterns, so the published float factor can lag a large transaction by weeks.
Where Indian Markets Use Each Number Today
Both numbers are in active use. Which one applies depends on the question being asked.
Index Selection Versus Index Weights
NSE Indices' methodology document (September 2026 edition) uses both numbers at different stages:
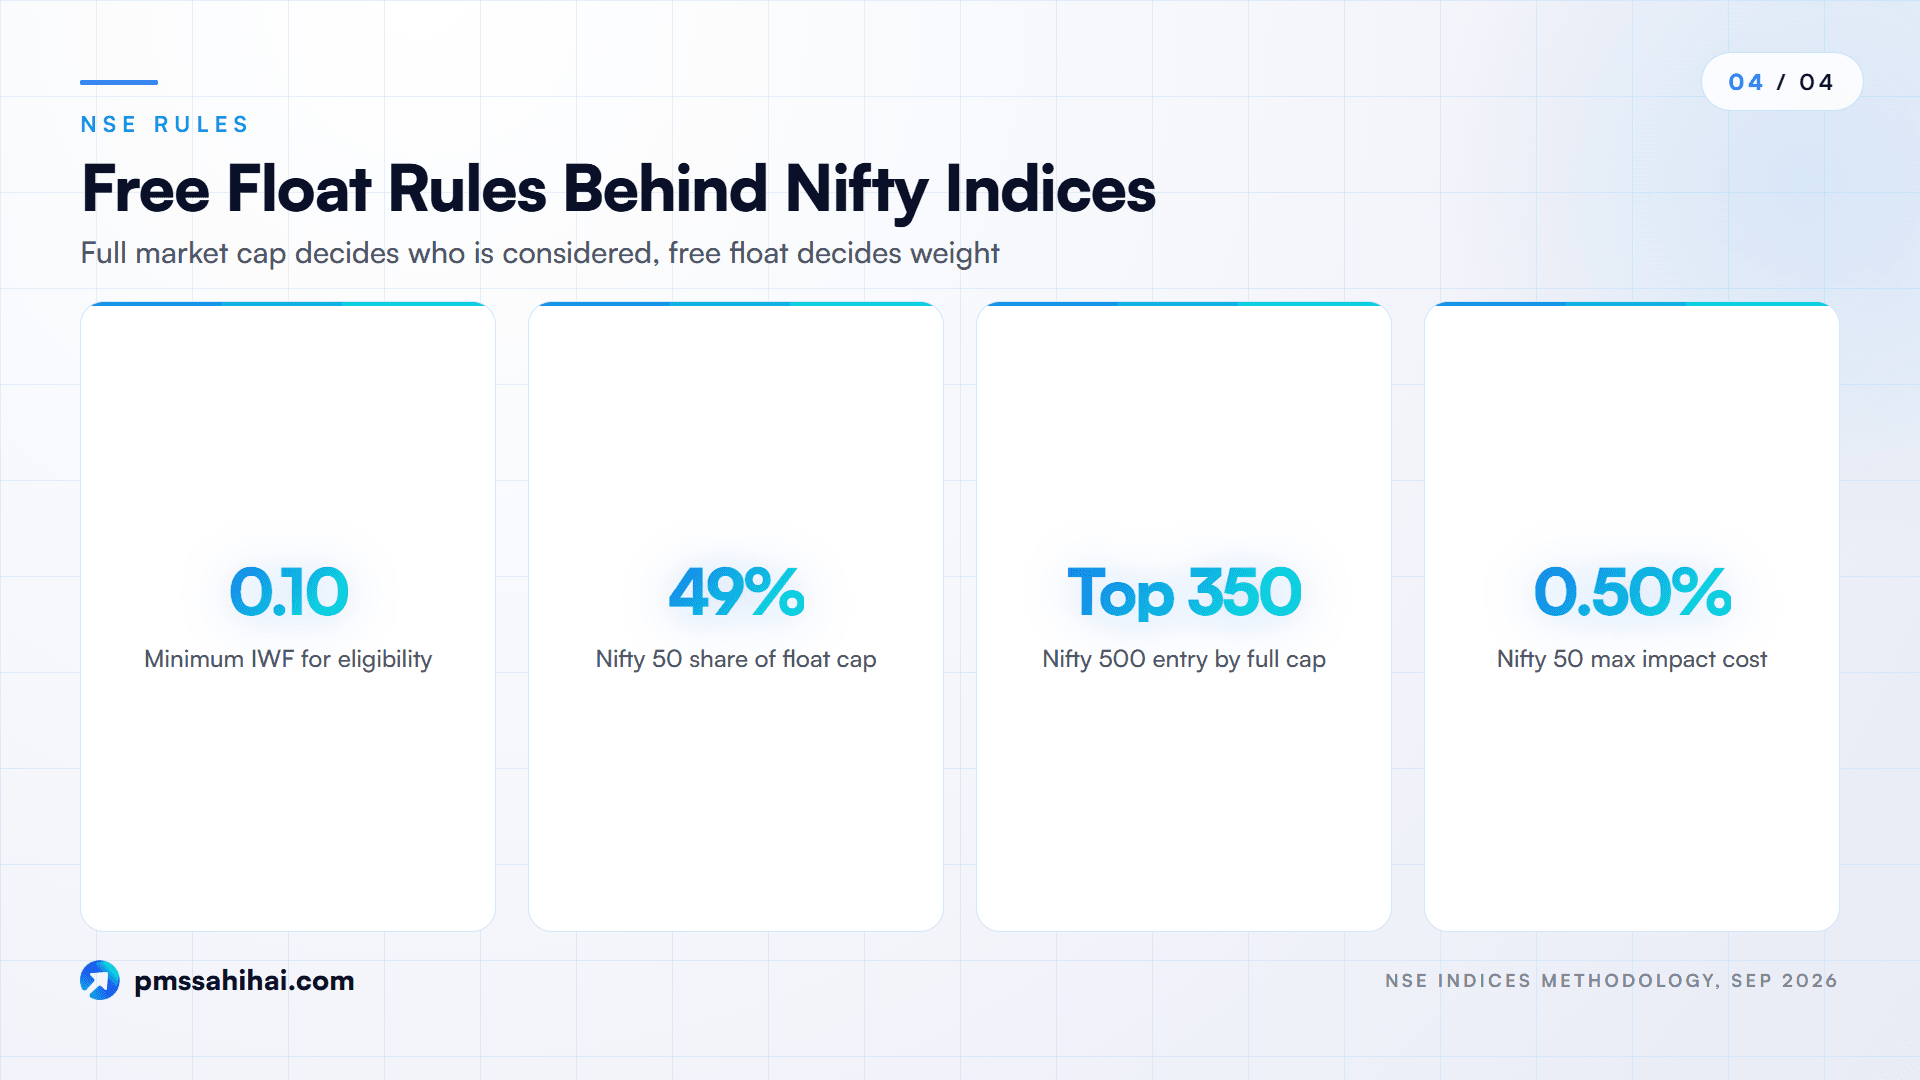
- Selection of the broad universe. Inclusion in the Nifty 500 ranks companies on full market cap (a company ranked in the top 350 is included). Inclusion in the Nifty 100 ranks on average full market capitalisation (top 90).
- Eligibility. A stock generally needs an IWF of at least 0.10, meaning at least 10% free float, or a six-month average free float market cap of at least 25% of the full market cap of the smallest existing constituent.
- Nifty 50. The 50 stocks are chosen from the Nifty 100 on free float market capitalisation, must have F&O contracts, and must have traded at an average impact cost of 0.50% or less for 90% of observations for a ₹10 crore basket. A new entrant needs an average free-float market cap at least 1.5 times that of the smallest current constituent.
- Weights. Once in, each stock's index weight is based on its free-float market cap, subject to any caps a specific index applies.
So full market cap helps decide who is big enough to be considered; free float decides how much each member counts. The scale is large: NSE says the Nifty 50 represented about 49% of the free float market capitalisation of stocks listed on NSE as on 30 September 2026.
SEBI and AMFI Size Buckets Use Full Market Cap
Here the rule flips. SEBI's mutual fund categorisation circular of 6 October 2017 defines large cap as the 1st to 100th company, mid cap as the 101st to 250th, and small cap as the 251st onwards, all in terms of full market cap. Mutual funds use the list AMFI prepares on that basis, and PMS strategies commonly describe themselves with the same labels.
This creates a quiet mismatch:
- A company with a thin float can rank as large cap on full market capitalisation while carrying a modest weight in a large cap index.
- A "large cap" fund or PMS may therefore hold stocks that matter less to its free float benchmark than their size label suggests.
Neither approach is wrong. One answers "how big is this company?" and the other answers "how much of it can the market own?".
How to Check the Gap for Any Listed Stock
You do not need an index provider's data feed to estimate the gap. A five-minute check:
- Find full market cap. Multiply the current price by shares outstanding, or read it from the exchange's stock page.
- Open the latest shareholding pattern. Every listed company files it with the exchanges each quarter, and NSE publishes the filings on its shareholding pattern page.
- Subtract promoter and promoter group holding. This gives public shareholding, your ceiling.
- Look inside the public category. Strip out strategic FDI stakes, private equity and sovereign funds where identifiable, employee trusts, director and KMP holdings, and locked-in shares.
- Compute the factor. One minus the non-free-float share is your rough free float factor.
- Compare with the index provider's figure. NSE publishes investible weight factors for index constituents; if your estimate differs, the provider may have information on holdings you could not separate.
- Note the date. Your answer is as fresh as the last shareholding pattern.
For a quick screen, two ratios are enough: float factor (how much is tradable) and promoter holding (who controls the rest).
Advantages of Comparing Free Float and Market Cap
Reading the two numbers side by side, rather than either one alone, gives an investor several practical benefits:
- It shows investable size, not just headline size. Free float market cap tells you how much of a company the market can actually own, which is what index funds and large investors care about.
- It explains index weights. When a smaller company carries a larger Nifty weight than a bigger one, the factor is almost always the reason.
- It is a fast ownership check. A big gap flags heavy promoter, government or strategic ownership before you read a single annual report.
- It helps judge tradability. A thin float means fewer shares changing hands, which matters for a portfolio manager building or exiting a sizeable position, especially in small and mid caps. NSE itself screens Nifty 50 candidates on impact cost for this reason.
- It sharpens benchmark comparisons. If a PMS holds a 10% position in a stock whose free float index weight is 1%, that is a large active bet, even if the company is a household name by full market cap.
- It uses public data. Shareholding patterns are mandatory quarterly disclosures, so anyone can run the check.
- It flags upcoming changes. A large locked-in block or a promoter required to reach the minimum public shareholding level hints that the float, and possibly index weight, could change.
How PMS Sahi Hai Helps You Read the Float Gap Inside a PMS
First, what PMS Sahi Hai does not do. The platform does not publish free float factors, and its strategy pages do not show holdings tables, so you cannot read a PMS's exposure to low-float stocks off the site. That part of the check still happens with the manager's factsheet and the shareholding patterns described above.
What the platform does cover is the other half of the comparison: the size label and the benchmark. Those are exactly the two places where full market cap and free float meet in a PMS.
Size labels on one shelf. The PMS Sahi Hai comparison page lets you filter strategies by category (Large Cap, Large & Mid, Mid Cap, Small Cap, Flexi Cap, Multi Cap, Thematic), by fund house and by benchmark, then shortlist up to four side by side. The categories follow the full market cap ranks discussed above; our guide to mid cap PMS in India explains the 101–250 band in detail.
The benchmark beside every return. Each strategy page names its benchmark next to its returns, AUM and maximum drawdown. That benchmark is almost always a free float index. When a mid cap-labelled strategy is measured against a broad 500-stock index, you are looking at the size-label versus index-weight mismatch from this article in a real factsheet. Our insight on benchmark selection in PMS covers why that choice can flatter or hide performance, and the how to choose a PMS checklist puts it bluntly: the index must match the mandate.
Nyra for the follow-up questions. Nyra, the platform's AI research assistant, can help you compare strategies and review an existing portfolio for overlap, drift and fee drag. Its 0–10 score, described on the Nyra methodology page, rates strategies on five pillars at fixed weights against published standards, and performance is judged against each strategy's benchmark. Nyra is an analytical tool, not a SEBI-registered investment adviser, so treat its output as research input rather than advice.
A practical way to combine the two: shortlist strategies on PMS Sahi Hai by category and benchmark, then ask each manager for the top holdings and check the float gap of the biggest positions yourself. If a "large cap" strategy's largest bets are thin-float companies, you now know what questions to ask about liquidity and active risk.
Limits of the Free Float vs Market Cap Comparison
The comparison is useful, but it has blind spots.
- Free float is an estimate. NSE applies its exclusions only "where identifiable separately". If a strategic holder sits inside a generic category, the factor may be higher than the true tradable share.
- Providers differ. NSE's list is broad, excluding FDI, private equity and sovereign wealth funds. Another index provider can draw the line differently, so the same company can carry different free float factors in different indices.
- The data lags. Factors reset from quarterly shareholding patterns. After a block deal, an offer for sale or a lock-in expiry, the published gap can be out of date for weeks.
- A big gap is not a verdict. High promoter holding can signal commitment or concentration risk. The number alone does not say which.
- Size labels and index weights do not line up. Because SEBI and AMFI rank on full market cap while indices weight on free float, the two systems can describe the same stock differently. That is a feature of the design, not an error, but it confuses comparisons.
- It says nothing about value. Neither number tells you whether a stock is cheap or expensive. Free float measures availability, not quality.
- Low float does not automatically mean high volatility. Many explainers claim a thin float makes a stock more volatile. Thin floats can amplify the price impact of large orders, but volatility depends on many factors, and the float factor alone is not a reliable predictor.
Key Lessons From the Free Float and Market Cap Gap
The free float vs market cap distinction comes down to one multiplication and one question. The multiplication is full market capitalisation times the free float factor. The question is: how much of this company can the market actually own?
The key lessons:
- Full market cap measures total corporate value. Free-float market cap measures investable value. The second is never larger than the first.
- The gap is mostly promoter holding, government and strategic stakes, employee trusts and locked-in shares. Public shareholding is only a ceiling on free float.
- Indian indices have weighted by free float since 2003 (Sensex) and 2009 (Nifty), so index weight is not a size ranking.
- SEBI's large, mid and small cap buckets still rank on full market cap, so labels and index weights can disagree.
- For a PMS investor, the gap explains why a portfolio looks different from its benchmark and where liquidity can be thin.
Use both numbers. Either one alone tells half the story. When you move from single stocks to choosing a portfolio manager, PMS Sahi Hai and Nyra can help you line up each strategy's size label against its benchmark, so the float gap becomes a question you ask rather than a surprise you discover.
Compare PMS Strategies With the Float Gap in Mind
Before you choose a portfolio manager, look past the size label on the factsheet. Ask how much of the portfolio sits in stocks with heavy promoter or strategic ownership, how that compares with the benchmark's free float weights, and whether the manager can exit those positions without moving the price.
Then compare strategies on the same basis. On PMS Sahi Hai you can line up PMS strategies by category, benchmark, track record and fees, side by side, and ask Nyra to shortlist the ones that fit your goals. Bring your float-gap questions to the managers on that shortlist, and invest only once the answers make sense to you.
PMS Sahi Hai is a distributor of Portfolio Management Services and Alternative Investment Funds, APMI-registered (Registration No. APRN08358). This article is for education only and is not investment advice, a recommendation, or an offer to buy or sell any security. Investments in securities markets are subject to market risks; read all scheme-related documents carefully. Past performance is not indicative of future results. Consult your advisor before investing.
Ishaan founded PMS Sahi Hai to make India's PMS, AIF and GIFT City markets legible to serious investors, comparing every SEBI-registered manager on the same comparative basis, with no shelf products and no commission bias.
Frequently asked
What is the difference between free float and market capitalisation?
Market capitalisation, or full market capitalisation, is the share price multiplied by all shares outstanding. Free-float market cap multiplies the same price by only the shares considered available for trading, which excludes promoter, government, strategic and locked-in holdings. The ratio between the two is the IWF. Free float market cap is always equal to or smaller than full market cap.
Is free float market cap always lower than market cap?
It is always lower or equal, never higher. The float factor runs from 0 to 1, so multiplying full market cap by it can only shrink the number or leave it unchanged. The two are equal only when no shareholder falls into an excluded category, which is rare in India because most listed companies have an identifiable promoter group.
Why do Nifty and Sensex use free float instead of full market cap?
Index funds and ETFs need to buy the shares an index holds. Weighting by free float means each stock counts only as much as its tradable shares, so closely held companies do not dominate the index. BSE moved the Sensex to free float on 1 September 2003 and NSE moved the Nifty on 26 June 2009.
Is public shareholding the same as free float?
No. Public shareholding means everything outside the promoter group. Free float goes further and also excludes strategic holdings that sit inside the public category, such as FDI stakes, private equity and sovereign funds, employee trusts, director holdings and locked-in shares. Public shareholding is therefore the ceiling for free float, and the actual factor is usually lower.
Does SEBI use free float or full market cap for large cap classification?
SEBI's categorisation circular of 6 October 2017 uses full market cap. Large cap covers the 1st to 100th company, mid cap the 101st to 250th, and small cap the 251st onwards, based on AMFI's list. Index weights, by contrast, use free float, so a stock's size label and its index weight can tell different stories.
Why can a bigger company have a smaller index weight?
Because index weight follows free-float market cap, not full market capitalisation. A ₹40,000 crore company with a free float factor of 0.31 counts as about ₹12,500 crore in the index, while a ₹30,000 crore company with a factor of 0.85 counts as ₹25,500 crore. The smaller company ends up with roughly twice the weight.
Can free float change without the share price changing?
Yes. Free float changes whenever ownership shifts between excluded and tradable holders. A promoter offer for sale, a lock-in expiry or a private equity exit widens the float; a promoter buying more shares narrows it. Full market cap does not move in any of these cases unless the price or share count changes.
What does a large free float gap mean for a PMS investor?
It means much of the company is held by insiders or strategic owners. For a PMS, that can mean thinner trading, slower entry and exit for large positions, and a smaller benchmark weight than the company's size suggests. A big position in such a stock is a strong active bet relative to a free float benchmark.
Keep reading
All articles
Rolling Returns vs Trailing Returns: Which Question Each Answers
Rolling returns vs trailing returns compared side by side, with one worked PMS example, SEBI's reporting rules and a guide to which to use when.
Passive vs Active Management: Mutual Funds, ETFs and PMS Compared
Passive vs active management in India: 2026 cost caps, SPIVA evidence, tracking error, and when index funds, active funds or PMS fit.
Information Ratio vs Sharpe Ratio: Which One to Trust, and When
Information ratio vs Sharpe ratio: benchmark-relative vs risk-free-relative, when each misleads, and how PMS investors should read both together.
Read it. Now pressure-test it.
Ask Nyra how this applies to your portfolio, or talk to our team, no pitch, no pressure.