
Why Point-to-Point Returns Mislead PMS Investors: The Rolling Returns Test
One great year can lift a PMS's 1, 3 and 5-year returns at once. A worked example shows how rolling returns expose it, and what SEBI requires.

A PMS return quoted between two dates tells you what happened on that route, not what an investor would typically have earned. One exceptional year can lift the 1-year, 3-year and 5-year figures together, so a manager can look strong on all three columns while having trailed the benchmark for most of its history. Rolling returns test every available entry date and show the range of outcomes. SEBI's rules standardise how PMS returns are calculated, but the rules we read do not require rolling figures, so you usually have to ask for them or build them. This post shows the problem in a worked example and gives you a method.
Why a Single PMS Return Number Can Fool You
Picture two portfolio managers pitching you in the same week, each with a clean PMS track record. One shows a 3-year return of 24% a year. The other shows 14%, roughly level with the index. With at least Rs 50 lakh to commit, the choice looks easy.
It may be the wrong choice. Later in this post, we build those two records year by year, and the 14% manager turns out to have beaten the benchmark in every 3-year period on record while the 24% manager did so only once. Nothing in the headline numbers is false. Both are correctly calculated. They are simply answers to a narrow question: what did this portfolio earn between this date and that date?
That is what point-to-point returns are. You take a start value and an end value and annualise the change. This post will not linger on the definition, because the problem is more interesting than the formula. Rolling vs point-to-point returns is not a debate about arithmetic. It is about how much weight one pair of dates can carry when you are about to hand over a large sum.
The distinction matters more in a PMS than in many other products, for three reasons:
- The ticket is large. The minimum investment in a PMS is Rs 50 lakh per client, so a misjudged choice is expensive.
- Many portfolios are concentrated. A strategy with few stocks can have one outsized year, and that year will sit inside every recent return figure.
- Costs make switching painful. Exit fees and capital gains tax on a directly held portfolio both discourage you from correcting a mistake quickly.
Point-to-point figures are not useless. They are the right tool for answering what happened to your own money between your own dates. The trouble starts when the same number is used as evidence of what a manager is likely to deliver for someone arriving now, on a date nobody chose in advance.
How Trailing Returns Became the PMS Reporting Standard
Trailing returns are the point-to-point returns you see in almost every factsheet: all the windows end on the same recent date and reach back 1, 3 or 5 years. Their dominance in PMS performance reporting is a by-product of a real reform, and it helps to see why.
From No Standard to a Mandatory Method
A few years ago, you could not reliably compare two PMS figures at all. A SEBI working group, reporting in 2019, recorded that returns were being shown on IRR, TWRR and simple average bases, and concluded there was no standardised method for calculating them. It listed other concerns too: gross returns reported without fees, and model portfolio returns reported in place of actual ones. The same report cited a 2018 CFA Institute survey of Indian portfolio managers in which 46% did not use time-weighted returns of all client accounts, and only 39% displayed the portfolio's standard deviation.
The fixes came in stages:
- 13 February 2020: A SEBI circular told managers to report performance net of all fees and expenses and to include cash and liquid fund holdings in the calculation.
- 16 December 2022: A second circular created the Equity, Debt, Hybrid and Multi Asset strategy tags, a shortlist of benchmarks, and detailed reporting formats. It applied from 1 April 2023.
- 16 July 2025: The Master Circular for Portfolio Managers consolidated these rules, and it remains the operating reference.
- 7 October 2026: The SEBI (Portfolio Managers) Regulations, 2026 were notified, taking effect on 1 April 2027. They keep time-weighted disclosure for discretionary managers over the preceding three years, require performance to be reported uniformly across regulatory disclosures, marketing and client reports, and require managers to follow SEBI's benchmarking framework.
This was a major gain for investors. A common method and a common set of periods make comparison possible. But PMS performance reporting that standardises how a return is calculated does not address which dates it is calculated between. All the windows still end on one reporting date.
Rolling returns have a separate lineage. The idea comes from statistics, where a rolling average slides a fixed window along a data series, and several mutual fund platforms in India now show rolling figures as a routine feature. PMS reporting has simply not been built around them.
What SEBI Requires PMS Managers to Report Today
Under the Master Circular of July 2025, when a manager mentions the performance of an investment approach, it must present the time-weighted rate of return (TWRR) alongside the trailing return of the selected benchmark. This also covers any entity publishing that performance, so it binds comparison sites as well as managers.
Client reporting goes further. Managers must show:
- Your XIRR in each investment approach, with the minimum, maximum and median XIRR across all investors in it.
- The TWRR of the investment approach and the benchmark's trailing return, shown separately.
- A disclaimer that your result may differ because of the timing of flows and portfolio restrictions.
Marketing material must show performance relative to the selected benchmark and relative to other managers in the same strategy. Model portfolio returns and the returns of cherry-picked investors are barred from performance reporting. The figures are checked in the annual audit, and monthly reports go to SEBI and to APMI, the industry association, within 7 working days of month-end.
The periods are fixed too. The monthly format set in December 2022 runs 1, 3 and 6 months, then 1, 2, 3, 4 and 5 years, and since inception. The quarterly client report uses 1, 3, 5 and 10 years and since inception. All of those are point-to-point returns ending on the same date.
What the Rules Do Not Ask For
We read the December 2022 circular, the July 2025 Master Circular and the notified 2026 Regulations for this post. None of them contains a rolling-return requirement for PMS performance. The only use of the word "rolling" in the Master Circular concerns corporate bond trading volumes. So a PMS investor should not expect a rolling table as a matter of right, though a manager can be asked to supply one. We did not review every circular issued by APMI, so treat this as what the SEBI texts say, not a statement on every industry document.
Two other details of PMS performance reporting are worth knowing:
- The audit checks accuracy, not representativeness. A correctly audited 3-year return can still be flattered by its dates.
- The numbers are not regulator-certified. The client report format itself carries the line that performance data is "not verified by any regulatory authority", and SEBI's monthly report page says it has not approved or certified the data.
SEBI's own format hints at the issue. The illustrative performance report card in the Master Circular shows one investment approach in the bottom quartile over 1 year and the top quartile over 10 years. Those figures are placeholders, but they show that a manager's standing can change a lot with the window.
The One-Month Swap That Turns 15% Into 23.7%
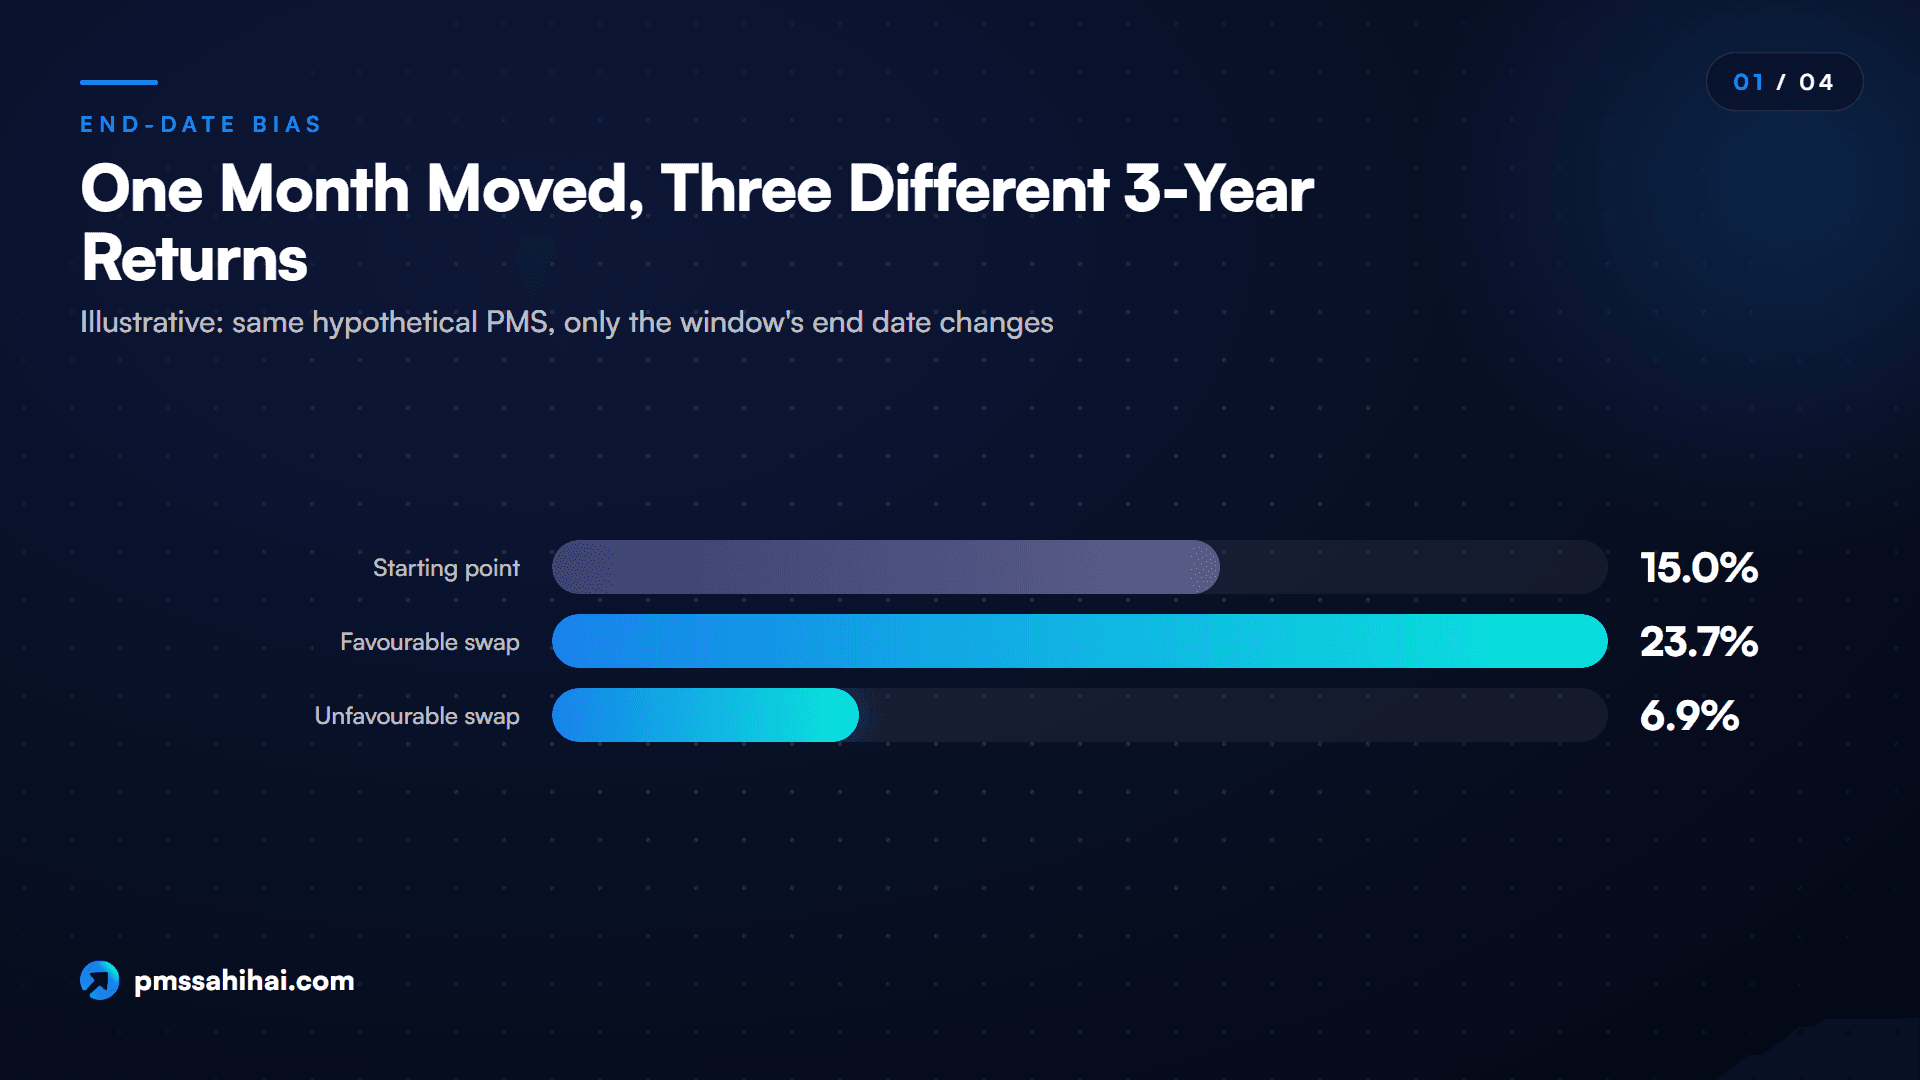
Here is the mechanism in its smallest form. Take a hypothetical PMS with a 3-year return of exactly 15% a year. That means Rs 100 became Rs 152.09 over 36 months.
Now move forward one month. The window drops its oldest month and adds the newest one. Suppose the month falling out was a 10% loss and the month coming in was a 12% gain. The other 35 months are identical. The new multiple is 1.5209 × 1.12 ÷ 0.90 = 1.8926, which works out to 23.7% a year.
Reverse it, with a 12% gain falling out and a 10% loss coming in, and the same strategy shows 6.9% a year.
| Scenario | Month dropped | Month added | 3-year return (annualised) |
|---|---|---|---|
| Starting point | n/a | n/a | 15.0% |
| Favourable swap | -10% | +12% | 23.7% |
| Unfavourable swap | +12% | -10% | 6.9% |
No stock changed and the manager's skill did not change. This is end-date bias, along with its twin, start-date bias: a return measured from a market trough to a peak looks better than the same manager's work measured the other way round. Move the end date and you often move the start date's luck with it.
For a manager, the reporting calendar is fixed, so end-date bias is not usually manipulation. A PMS track record is simply at the mercy of when you read it. The danger is that marketing naturally gets louder after a strong run, which is exactly when trailing returns look their best.
A Worked Example of Two PMS Strategies Over Ten Years
The following numbers are entirely hypothetical and were built to show the mechanism. They are not any real strategy or index. Treat them as net-of-fee annual TWRR, with an annual step so you can check every figure by hand.
| Year | Benchmark | Strategy A | Strategy B |
|---|---|---|---|
| 1 | 12% | 10% | 15% |
| 2 | -8% | -16% | -3% |
| 3 | 25% | 22% | 25% |
| 4 | 4% | -3% | 8% |
| 5 | 18% | 14% | 21% |
| 6 | -15% | -24% | -9% |
| 7 | 30% | 24% | 29% |
| 8 | 9% | 2% | 13% |
| 9 | 14% | 16% | 13% |
| 10 | 20% | 62% | 17% |
Strategy A lags in most years and then has one extraordinary year: 42 percentage points ahead of the benchmark. That is rare but not fantasy. In PMS Sahi Hai's data for the year to 30 June 2026, the best one-year excess return among 429 strategies was 46.9 points.
What the Trailing Returns Table Says
Stand at the end of Year 10 and read the columns a factsheet would show:
| Trailing return at end of Year 10 | Benchmark | Strategy A | Strategy B |
|---|---|---|---|
| 1 year | 20.00% | 62.00% | 17.00% |
| 3 years (annualised) | 14.25% | 24.22% | 14.32% |
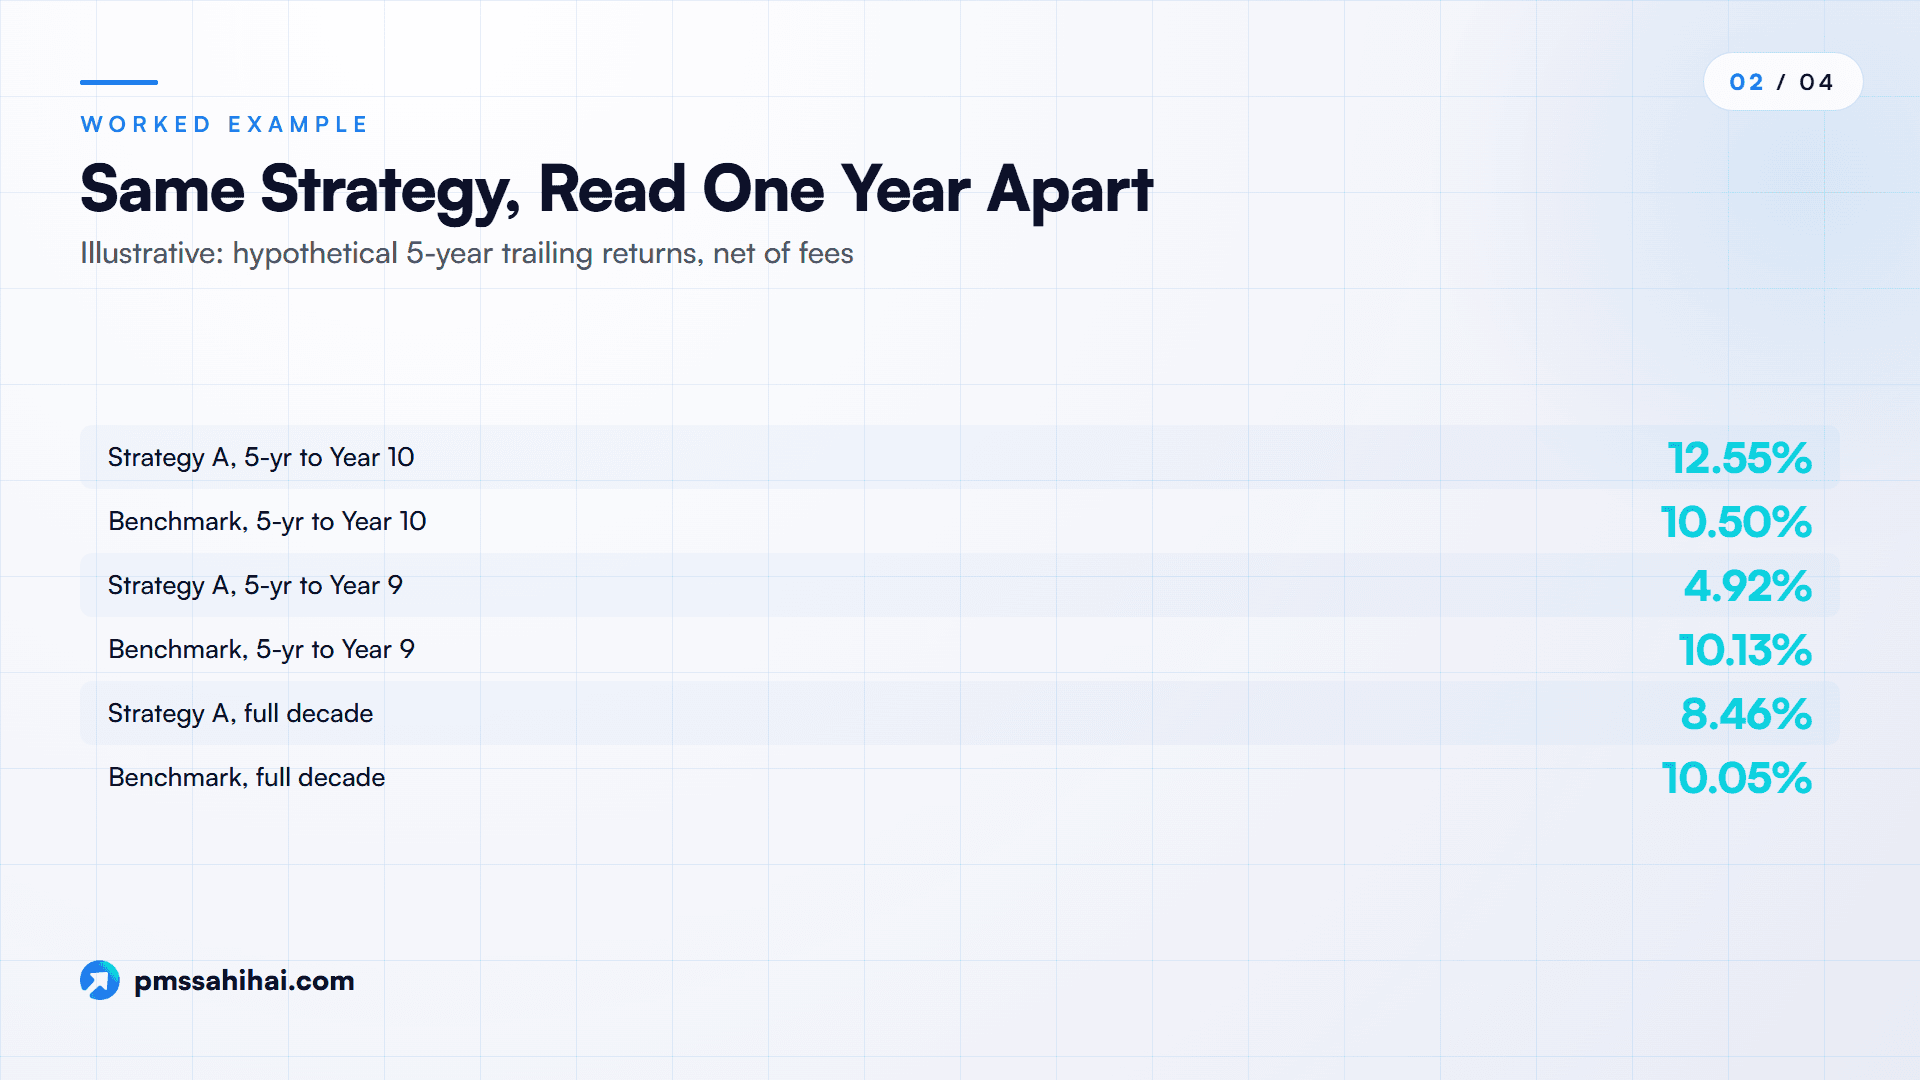
| 5 years (annualised) | 10.50% | 12.55% | 11.89% |
To check the 3-year figure for Strategy A: 1.02 × 1.16 × 1.62 = 1.9168, and the cube root of that, less 1, is 24.22%. This is standard compound annual growth.
Strategy A wins every column. Strategy B lags the benchmark over one year and is barely ahead over three. On this table, most people would pick A, and many would think they were being careful by checking three horizons.
They would really have checked one thing three times. Trailing returns are not independent evidence. Year 10 sits inside the 1-year, 3-year and 5-year windows alike, so a single year is counted in every column.
Move the End Date Back One Year
Now read the same table one year earlier, before the big year:
| Trailing return at end of Year 9 | Benchmark | Strategy A | Strategy B |
|---|---|---|---|
| 1 year | 14.00% | 16.00% | 13.00% |
| 3 years (annualised) | 17.33% | 13.63% | 18.10% |
| 5 years (annualised) | 10.13% | 4.92% | 12.65% |
The ranking flips for the longer horizons. Strategy A now trails the benchmark by more than 5 points a year over five years. Same managers, same process, one year apart. Over the full decade, Strategy A compounds at 8.46% against 10.05% for the benchmark and 12.32% for Strategy B, and excluding Year 10 its nine-year figure is just 3.73%.
So the point-to-point returns at Year 10 were accurate and still gave a misleading impression. That is why rolling vs point-to-point returns is a practical question and not a theoretical one.
What Rolling Windows Reveal That Trailing Returns Hide
Like a rolling average in statistics, rolling returns keep the window length constant and shift the start date along the record. With ten annual returns, there are eight 3-year windows. Each one answers a simple question: what did an investor who entered then and stayed three years earn?
| 3-year window | Benchmark | Strategy A | Strategy B |
|---|---|---|---|
| Years 1 to 3 | 8.80% | 4.07% | 11.72% |
| Years 2 to 4 | 6.15% | -0.20% | 9.40% |
| Years 3 to 5 | 15.33% | 10.50% | 17.77% |
| Years 4 to 6 | 1.42% | -5.63% | 5.95% |
| Years 5 to 7 | 9.25% | 2.42% | 12.41% |
| Years 6 to 8 | 6.40% | -1.31% | 9.88% |
| Years 7 to 9 | 17.33% | 13.63% | 18.10% |
| Years 8 to 10 | 14.25% | 24.22% | 14.32% |
Reading the Rolling Comparison
Summarise those windows and the picture reverses:
| Rolling measure | Benchmark | Strategy A | Strategy B |
|---|---|---|---|
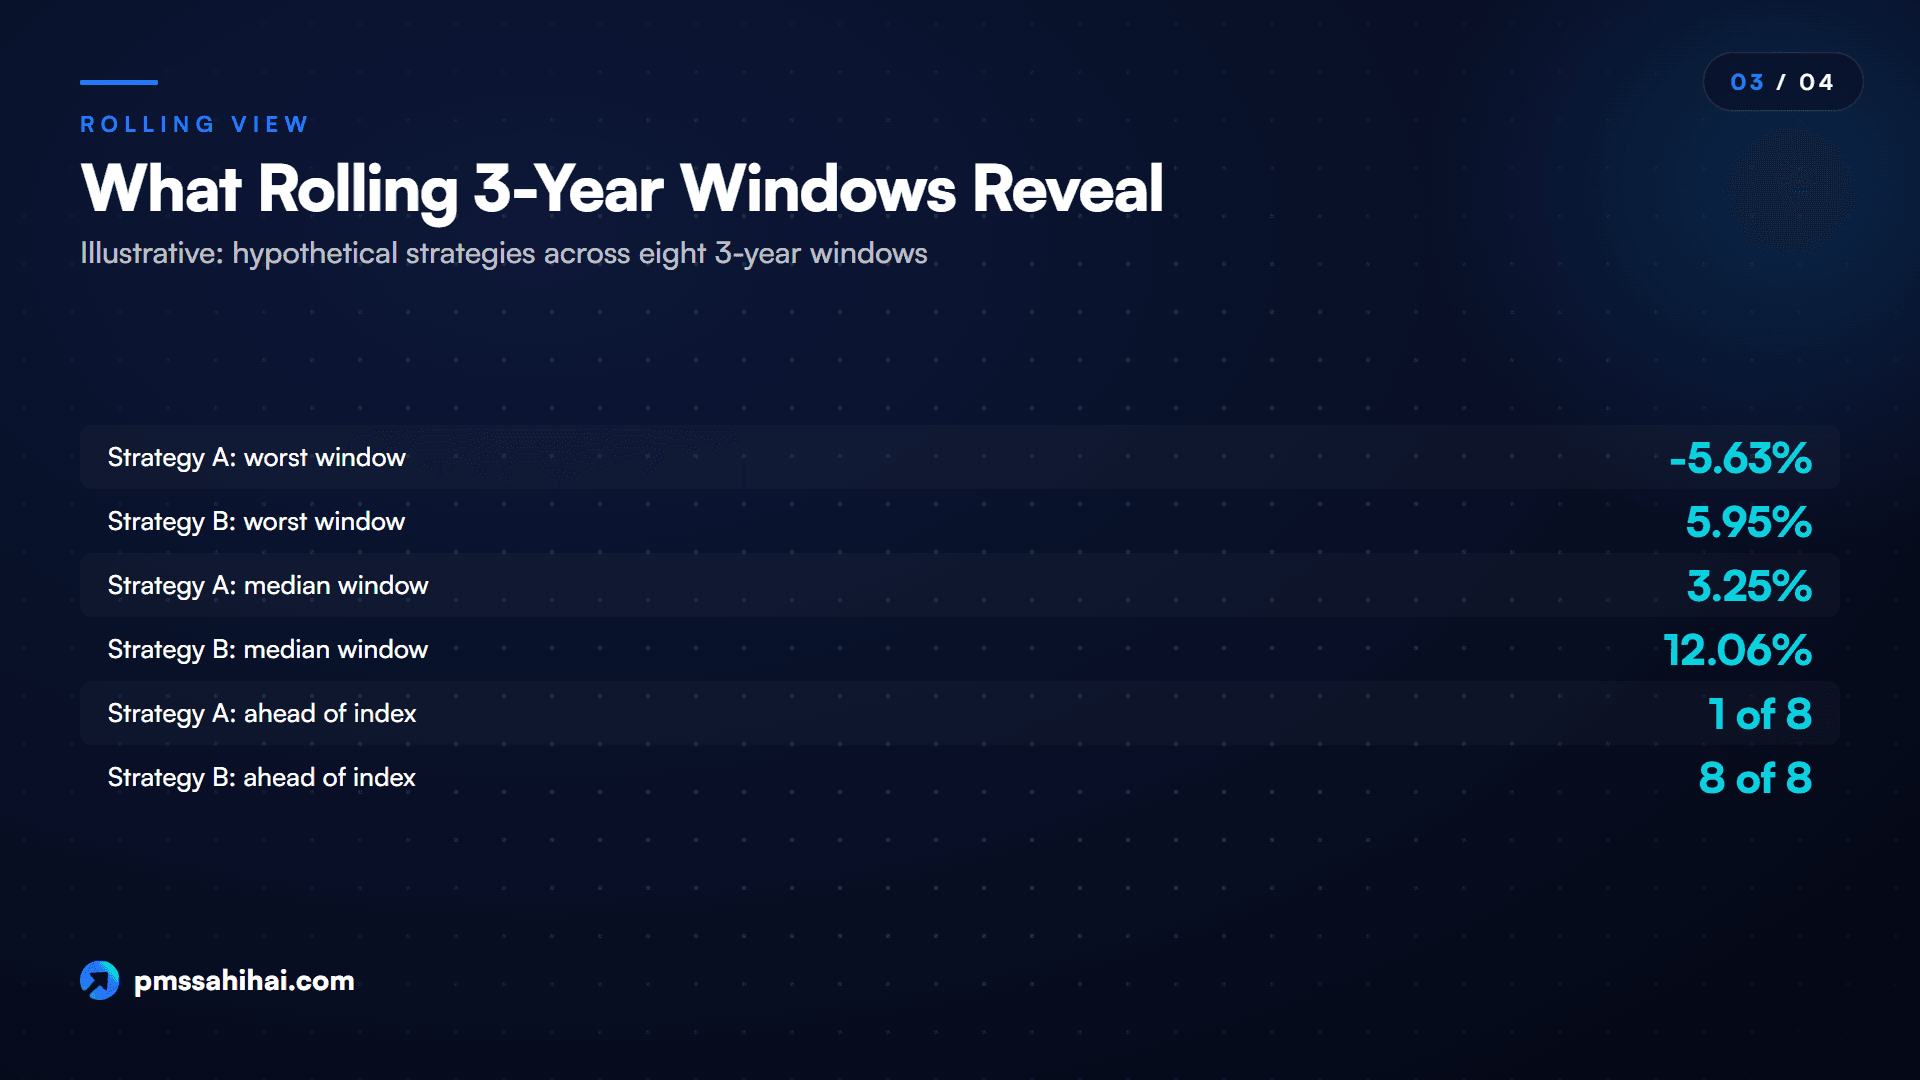
| Worst 3-year window | 1.42% | -5.63% | 5.95% |
| Median 3-year window | 9.03% | 3.25% | 12.06% |
| Best 3-year window | 17.33% | 24.22% | 18.10% |
| 3-year windows ahead of benchmark | n/a | 1 of 8 | 8 of 8 |
| 3-year windows with a loss | 3 | ||
| 5-year windows ahead of benchmark | n/a | 1 of 6 | 6 of 6 |
| 1-year windows ahead of benchmark | n/a | 2 of 10 | 6 of 10 |
Strategy A's headline number was its best window, and the only one in which it beat the benchmark. Strategy B's unremarkable-looking trailing 3-year figure was close to its typical result. Notice that B lagged the benchmark in Years 7, 9 and 10, including the last two years outright. A 1-year screen would have marked it down, while the 3-year windows show a manager who never fell behind over a full holding period.
The rupee version makes this concrete for a Rs 50 lakh investor:
| Rs 50 lakh invested for 3 years | Benchmark | Strategy A | Strategy B |
|---|---|---|---|
| Years 8 to 10 (the headline period) | Rs 74.56 lakh | Rs 95.84 lakh | Rs 74.70 lakh |
| Years 6 to 8 | Rs 60.22 lakh | Rs 48.06 lakh | Rs 66.33 lakh |
| Years 4 to 6 | Rs 52.16 lakh | Rs 42.02 lakh | Rs 59.46 lakh |
Rolling windows do not say Strategy A cannot repeat its best year. They say that its record, read fairly, depends on being in the right three years, and that you are unlikely to know in advance which three those are.
For a sense of what a real series looks like, Kuvera reports that the Nifty 50 had 2,465 overlapping five-year periods from October 2015 to October 2025, averaging 13.28%, with a high of 26.26% and a low of -1.03%. Even the broad market gives very different results depending on the dates.
How Rolling Returns Make Manager Selection Easier
Once you have them, the rolling vs point-to-point returns choice gets easier: rolling returns simplify the decision more than they complicate it. Here is what they do for you:
- They answer the question you actually have. You do not know which month your money will go in. A distribution of entry dates fits that situation better than one fixed pair.
- They separate a strong record from a strong recent year. If the best window and the trailing window are the same window, you have learned something important.
- They give you a worst case drawn from history. The lowest 3-year result is easier to weigh against your own tolerance than a volatility figure. It is not a floor, but it is concrete.
- They produce a simple beat rate. A result such as "ahead of the benchmark in 40 of 49 windows" is easy to compare across managers, provided the benchmark and the period match.
- They reduce the pull of marketing timing. A manager's strongest moment to raise money is after a good run. A rolling view is less affected by that timing.
- They help frame conversations. Asking a manager what went wrong in their worst rolling window tends to produce a more useful discussion than asking about their best year.
Rolling returns also pair well with SEBI's required disclosures. The TWRR tells you the manager's return, neutral to client flows. The min, max and median XIRR tell you how far investors' experience varied. The rolling view adds the piece those miss: how far results varied across time.
How to Build Rolling Returns for a PMS Yourself
Mutual fund platforms hand you rolling charts automatically. For a PMS, you typically have to do a little more work. This section keeps to what a PMS investor needs; how to read a full rolling distribution deserves its own treatment.
What to Request From the Portfolio Manager
Ask for the following, in writing, for the exact investment approach you are considering:
- Monthly TWRR since inception, net of fees, with cash included, calculated by SEBI's chain-linking method.
- The monthly return of the selected benchmark for the same months, on a total return basis if that is what the manager reports against.
- Any date on which the benchmark or strategy tag changed. Under SEBI's rules, a re-tagged approach cannot use its earlier track record for reporting, so a break in the series matters.
- Any changes in lead manager or investment approach, so you can judge whether old windows describe today's process.
- Their own rolling analysis, if they keep one, along with the window and step used.
If a manager declines to share monthly data, ask why. You can also look at public sources. SEBI's portfolio manager monthly report page lets you select a manager, year and month, and APMI is required to make monthly reports available on its website. We did not test how far back either goes, or how complete they are for a given approach, so check before relying on them.
How to Chain-Link Monthly TWRR
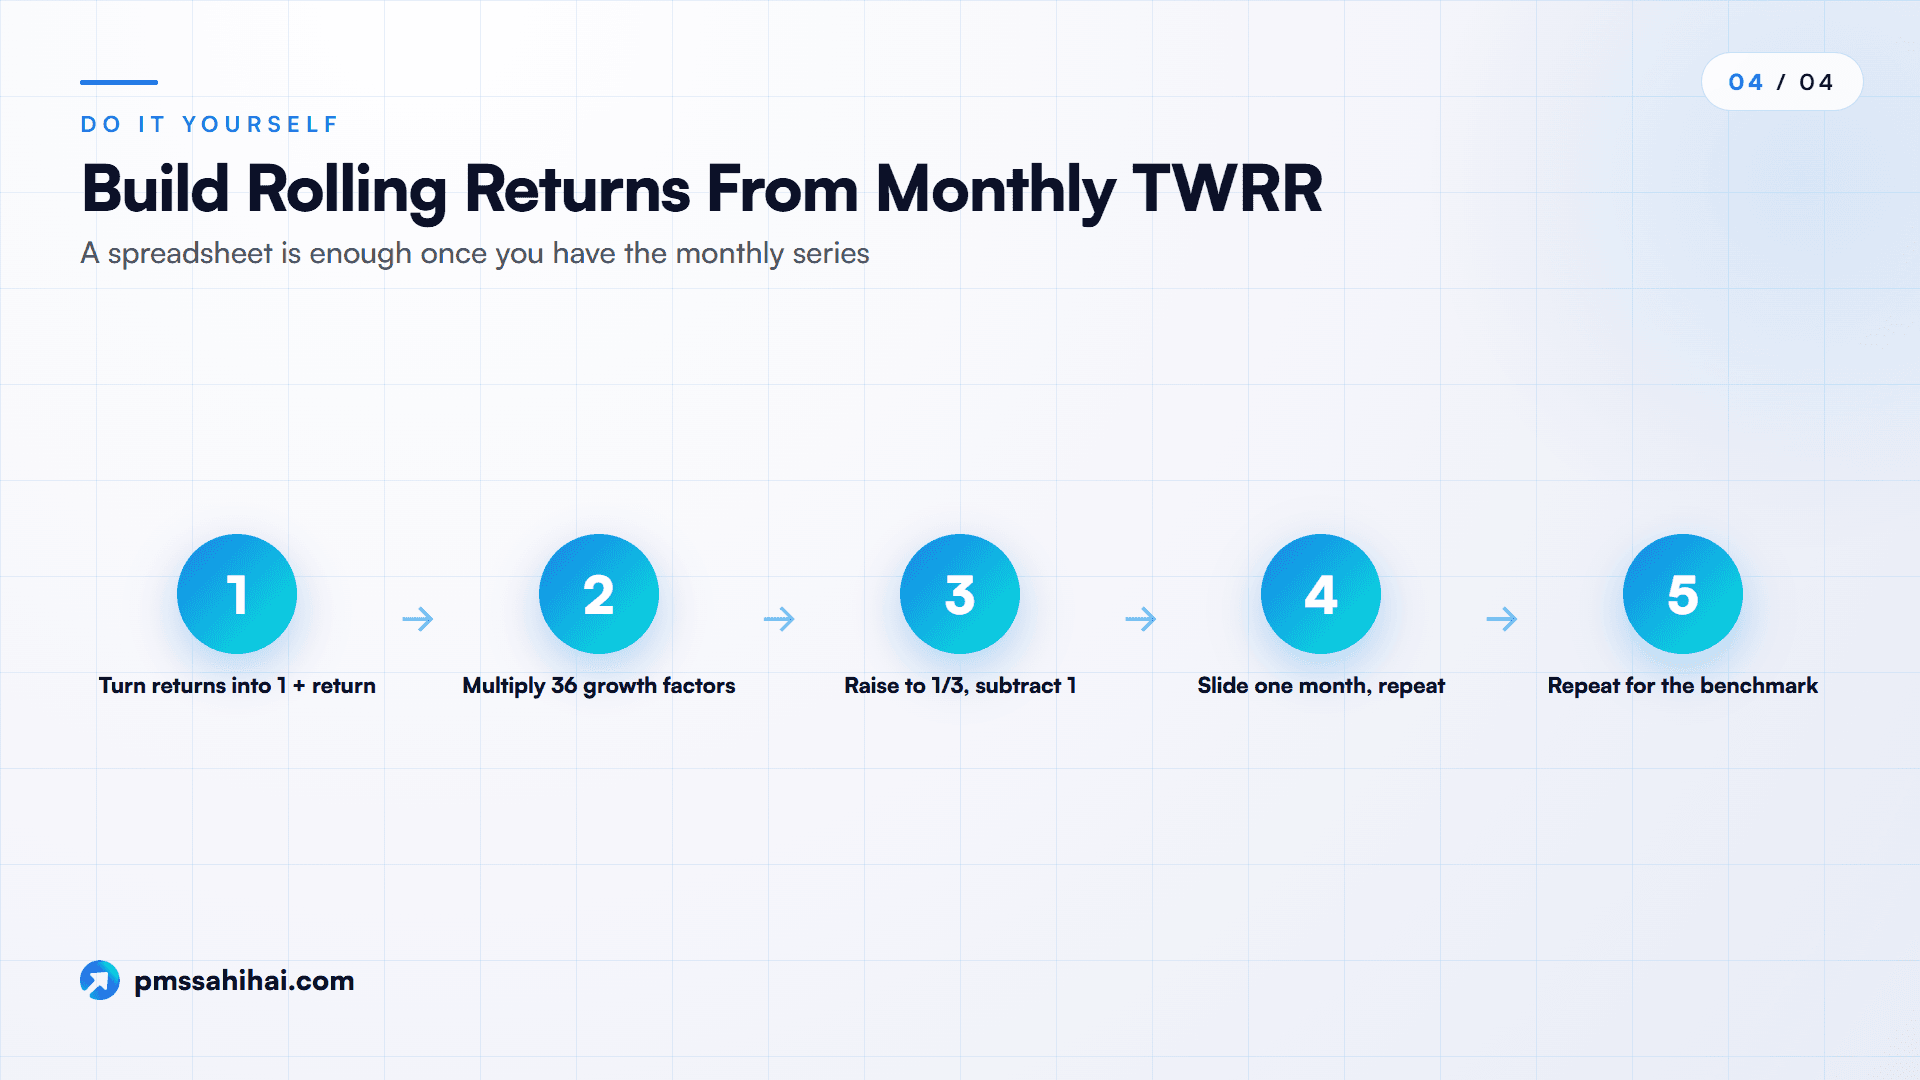
Once you have the monthly series, a spreadsheet will do:
- Put each month's return in a column and convert it into a growth factor: 1 + return.
- For a 36-month window, multiply 36 consecutive growth factors together.
- Raise the result to the power of 1/3 and subtract 1 to annualise.
- Slide down one month and repeat until the data runs out.
- Do the same for the benchmark, and count how many windows the strategy won.
The number of windows equals months of data minus window length plus one:
| Track record | 36-month windows | 60-month windows |
|---|---|---|
| 5 years (60 months) | 25 | 1 |
| 7 years (84 months) | 49 | 25 |
| 10 years (120 months) | 85 | 61 |
Choose a window at least as long as your planned holding period. For an equity PMS, three years is a sensible minimum and five is better where the data allows. Whichever you choose, use the same window, step and benchmark for every manager, or the comparison means little.
How PMS Sahi Hai Helps You Test a PMS Track Record
Everything above works with a spreadsheet and a willing manager. PMS Sahi Hai's job is to make the surrounding comparison quicker, and to be straight about where a single figure stops being useful.
Start with a shortlist. The compare page lists PMS, AIF and GIFT City strategies with filters for product class, category, fund house and benchmark, and lets you line up to four strategies side by side. Filtering by benchmark helps here, since a beat rate only means something when two strategies face the same yardstick.
Check consistency separately from return. Nyra, the platform's AI-powered research tool, gives each strategy a Nyra Score from 0 to 10. Its published methodology uses five pillars with fixed weights: return performance (30%), risk-adjusted return (25%), downside protection (20%), consistency (15%), and structure and stewardship (10%). Our factsheet guide describes consistency as rolling-period behaviour across cycles, which is the idea of this post built into a score. A strategy with under 12 months of record is shown as "Not Rated" rather than guessed at.
Read the score with its limits. The methodology calls the score "not a prediction" and "not a recommendation". It compresses many inputs, so it cannot replace looking at a strategy's worst window yourself, and its benchmark-based pillars lean on the stated benchmark being a fair one. Our guide to benchmark selection in PMS explains how to test that.
Use single-window data for what it is. Our own review of 429 PMS strategies found that 309 beat their stated benchmark over the year to 30 June 2026. The same article says plainly that one year is a single measurement window and says nothing about repeatability. That number describes a market year. It does not identify the 309 managers you should hire.
Know what still needs asking. The published pages we reviewed describe scores and comparison filters, not a downloadable rolling-return table for each strategy. So the request list in the previous section still applies. Once you have the monthly series, Nyra can help you frame the questions to put to a manager, such as what changed in its weakest periods. Nyra is described on the site as an analytical tool and not a SEBI-registered investment adviser, so the decision and its suitability check remain with you and your adviser.
If you want to go deeper on the underlying measures, our guides to how TWRR works and why your own PMS return differs from the published one cover the ground this post skips.
Where Rolling Returns Fall Short for PMS Investors
Rolling returns are a better lens, not a perfect one. These limits are real, and a few are sharper for PMS than for mutual funds.
- Windows overlap heavily. Two adjacent 36-month windows share 35 months, or 97.2% of their data. Eighty-five windows from ten years are not 85 independent tests. In truth, a decade holds only about three separate 3-year periods.
- Short records produce thin results. Some strategies are young. Five years of data gives only one 60-month window, and a beat rate from a handful of windows can look more precise than it is.
- Rolling figures do not fix survivorship bias. Strategies that did badly may have closed or merged, and they disappear from comparison tables. Research on US mutual funds estimated this bias at about 0.9% a year; we have not seen a comparable figure for Indian PMS.
- They describe the past. A long winning streak can end, especially if assets have grown or the manager has changed. Rolling returns are not a forecast.
- The strategy's return is not yours. TWRR ignores when you added or withdrew money, and your portfolio may hold different stocks. Your own XIRR can differ from any figure here.
- Averages can hide the sequence. A high beat rate earned in the distant past and a poor last three years are different stories, so look at the order of the windows, not just the summary.
- A wrong benchmark corrupts the whole exercise. Beating an easy index in all 85 windows proves little. Check the benchmark before you count.
- Risk is not captured fully. A rolling table says little about intra-window drawdowns or concentration. It works best beside the risk ratios, not in place of them.
Reading PMS Returns Without Being Fooled by the Calendar
The point-to-point returns on a factsheet are correct and regulated, and they are still only one path through the data. Trailing returns all finish on the same day and share the same recent months, so three strong columns can be one strong year seen three times. Rolling returns ask the fairer question: across all the dates you might have entered, what actually happened?
Use a short routine before you commit:
- Read the mandated TWRR and benchmark figures first; they are your comparable base.
- Ask how much of the result comes from the latest year by recalculating the trailing figures one year earlier.
- Ask for monthly TWRR, or build the rolling windows yourself.
- Look at the worst window, the median window and the beat rate, in that order.
- Sense-check against manager changes, the benchmark and your own holding period.
Tools can speed up the routine: PMS Sahi Hai's comparison pages and Nyra's consistency pillar are useful places to start, as long as you read them with their stated limits. None of this picks a winner for you, and past performance never guarantees future results. It does make it much harder for one good year to choose your manager for you. This article is general information, not investment advice; consider speaking to a SEBI-registered adviser about what fits your situation.
Compare PMS Track Records Across More Than One Date
The next time a return number impresses you, ask what it looks like one year earlier, and in every other window on record. Request the monthly TWRR, chain-link it, and compare the worst and median windows before you look at the best one.
To build the shortlist, compare PMS strategies side by side on PMS Sahi Hai, ask Nyra how a strategy's consistency score is made up, or book a consultation with the team to talk through the questions for your manager. Then judge the record across every date it covers, not only the one on the brochure.
PMS Sahi Hai is a distributor of Portfolio Management Services and Alternative Investment Funds, APMI-registered (Registration No. APRN08358). This article is for education only and is not investment advice, a recommendation, or an offer to buy or sell any security. Investments in securities markets are subject to market risks; read all scheme-related documents carefully. Past performance is not indicative of future results. Consult your advisor before investing.
Ishaan founded PMS Sahi Hai to make India's PMS, AIF and GIFT City markets legible to serious investors, comparing every SEBI-registered manager on the same comparative basis, with no shelf products and no commission bias.
Frequently asked
Why are point-to-point returns misleading for PMS investors?
Point-to-point returns depend on two dates that may have nothing to do with the manager's typical result. A single exceptional year can lift the 1-year, 3-year and 5-year figures together, because all of them contain it. In a concentrated PMS, where one year can be far from the average, the headline can look strong even when most entry dates would have trailed the benchmark.
Are rolling returns better than trailing returns?
For judging consistency, generally yes. Trailing returns show one window per horizon, all ending on the same date. Rolling returns show every window of that length, so you see the worst, median and best outcomes and a beat rate. Trailing figures remain useful for standard comparison and for regulatory reporting. Use the trailing number as the starting point and the rolling view as the test of it.
Does SEBI require PMS managers to show rolling returns?
We found no such requirement in SEBI's December 2022 circular, the July 2025 Master Circular or the 2026 Regulations. Those texts require TWRR with the benchmark's trailing return when performance is mentioned, and XIRR with minimum, maximum and median figures in client reporting. The standard periods all produce point-to-point returns. You can ask a manager for monthly data and build a rolling view yourself.
What rolling window should I use for a PMS?
Match the window to your intended holding period, and use at least three years for an equity PMS, since shorter windows capture much market noise. Five-year windows are more demanding but need a longer record: a 7-year history gives only 25 monthly 60-month windows. Whatever you pick, apply the same window, monthly step and benchmark to every strategy you are comparing.
Can I calculate rolling returns for a PMS with a short track record?
You can, but the output deserves caution. A strategy with four years of history yields just 13 monthly 36-month windows, and they overlap heavily, so they may all reflect a single market phase. Treat such results as a preliminary reading and not a verdict. A short record is not disqualifying, but you should not take much comfort from a high beat rate built on so little data.
Can one good year really distort 3-year and 5-year returns?
Yes. In our hypothetical example, a strategy with one 62% year showed a 3-year return of 24.22%. One year earlier, the same strategy's 3-year figure was 13.63%, behind the benchmark's 17.33%. Its 5-year return moved from 4.92% to 12.55%. The fix for this end-date bias is to recalculate the trailing figures one year back and see how much of the result survives.
Do rolling returns predict future PMS performance?
No. They describe how a strategy behaved across past entry dates and do not promise a repeat. Managers change, assets grow, and market conditions shift, so a strong rolling record can still be followed by weak years. A SEBI-registered portfolio manager also cannot offer indicative or guaranteed returns. Use rolling returns to judge the quality of past evidence, then weigh that alongside process, costs and risk.
Should I judge my own PMS using rolling returns or XIRR?
Use XIRR for your own experience, since it reflects the exact dates and amounts of your money. SEBI's client reporting provides it, along with minimum, maximum and median XIRR across investors in the same approach. Rolling returns serve a different job: judging the strategy's consistency before you invest or when reviewing whether to stay. Together they separate the manager's record from your own timing.
Keep reading
All articles
Special Power of Attorney (SPA): The One-Task Authority Explained
What a special power of attorney can and cannot do in India: scope, GPA contrast, stamp duty, NRI execution, revocation and risks, explained.

What Is a Durable Power of Attorney? The Position in India
India has no durable power of attorney. See what Section 201 does, why a POA ends on incapacity, and how guardianship and trusts fill the gap.

Springing Power of Attorney: Does It Work Under Indian Law?
A springing power of attorney is a foreign concept in India. See what section 201 does to it, what you can draft here and what works after incapacity.
Read it. Now pressure-test it.
Ask Nyra how this applies to your portfolio, or talk to our team, no pitch, no pressure.