
How to Read Upside and Downside Capture Ratios in a PMS Factsheet
Read upside and downside capture ratios in a PMS factsheet: the formula, real examples, beta checks, fee effects and five questions for your manager.

The upside and downside capture ratio shows how much of a benchmark's gains and losses a strategy took in rising and falling months. Read the two numbers as a pair, never alone, and compare them with beta before crediting the manager. SEBI's PMS reporting text does not define these ratios, so the formula, benchmark and window are the manager's choice and worth checking. A higher ratio of up to down does not guarantee a higher return, as our 36-month table shows. Use the pair to form questions for your manager, not to pick a winner.
Why This One Factsheet Row Deserves a Second Look
Open a PMS factsheet and, below the returns table, you may find a row of risk statistics. Volatility, beta, Sharpe, Sortino, maximum drawdown. Sometimes two more sit beside them: up capture and down capture.
They are easy to skim past, and easy to misread. A figure of 1.32 looks like a strong result. A figure of 1.12 next to it looks like a small blemish. Together they say something more specific: in the months the market rose, this portfolio rose about a third more than its benchmark, and in the months the market fell, it fell about an eighth more. That is a description of a portfolio's behaviour. Whether it is good depends on what you wanted, what the manager was paid to do, and how much of it was simply market exposure.
This guide stays with that one row. Our section-by-section factsheet guide covers the rest of the document. Here you will learn what the upside and downside capture ratio measures, how PMS factsheets print it, how to recompute it, how to read the two numbers together, and when to distrust them.
Most Indian explainers on the subject are written for mutual funds. PMS investors face a different set of problems: concentrated books, shorter records, fees charged differently, and no standard format for this particular statistic. Those differences change how the numbers should be read.
What Upside and Downside Capture Ratios Measure
Start with a simple split. Take the monthly returns of a strategy and its benchmark over a chosen window. Sort the months into two groups: those when the benchmark rose and those when it fell. Then compare the strategy with the benchmark inside each group.
- Upside capture answers: when the benchmark went up, how much of that rise did the strategy deliver?
- Downside capture answers: when the benchmark went down, how much of that fall did the strategy suffer?
The basic formula is the same on both sides. Divide the manager's return by the index return in those months, then multiply by 100. On the up side, above 100 means the manager beat the index. On the down side, below 100 means the manager lost less than the index, so a reading of 80 means the portfolio declined only 80% as much.
Notice that the direction of "good" flips. High is better on the up side, and low is better on the down side. A plain index fund, before costs, should sit near 100 on both, and passive funds generally do.
Two more readings are worth knowing:
- A negative downside capture means the strategy made money, on average, while the index fell.
- The overall capture ratio divides upside by downside. A 110 up and 85 down gives 1.29. Above 1.00 is usually described as favourable, though we will test that claim below.
One language trap: "capture ratio" gets used for three things. It can mean the upside figure, the downside figure, or the ratio between them. When someone quotes "a capture ratio of 1.3", ask which one they mean.
Where Capture Ratios Came From and Where SEBI Stands
We could not verify who first devised these measures, and the sources we read do not name an inventor. What can be dated is how they reached Indian investors.
September 2012. Morningstar India published an explainer that described the month-by-month split and said it used geometric averages of fund and index returns, over one, three, five, ten and fifteen years. It placed the figures on the Ratings and Risk tab of its site for Indian funds.
December 2012. Matt Schreiber of WBI Investments argued in Financial Advisor magazine for dividing upside by downside into one figure and using it to build portfolios.
2017 onward. Indian do-it-yourself analysts such as Freefincal built calculators, including rolling versions that recompute the ratios one month at a time.
December 2022. SEBI issued its circular on performance benchmarking and reporting by portfolio managers. It now sits in the Master Circular for Portfolio Managers dated 16 July 2025. This matters here for what it does and does not contain.
Under the master circular, a portfolio manager must present the time-weighted rate of return of the investment approach, along with the trailing return of the selected benchmark, whenever it communicates performance. When reporting to an individual client, it must also give the client's XIRR, along with the minimum, maximum and median XIRR across investors in that approach. Marketing material must show performance relative to the benchmark and to other managers in the same strategy. Model portfolio returns and cherry-picked client returns are barred.
Capture ratios appear nowhere in that framework. We searched the 207-page circular and SEBI's September 2024 FAQ for portfolio managers: the word "capture" turns up only in unrelated contexts such as data fields, and neither document mentions the Sharpe ratio either. So when a factsheet prints up and down capture, it is a voluntary extra. SEBI's text sets no formula, window or display rule for it.
The SEBI (Portfolio Managers) Regulations, 2026 were notified in October 2026 and take effect on 1 April 2027. Until then, the 2020 Regulations and the July 2025 master circular apply. Check for any updated circular if you are reading this after that date.
How a PMS Factsheet Actually Shows Capture Numbers
Few published PMS factsheets we found print these figures at all, so a real example is useful. PL Asset Management's AQUA, a flexicap PMS benchmarked to the BSE 500 TRI with an inception date of 12 June 2023, shows a row titled "AQUA Risk Profile (Since Inception)". We use it only because its monthly factsheets are public and it illustrates the format. This is not a recommendation, and we are not assessing the strategy.
Here is how the row read across five factsheets.
| Factsheet date | Up capture | Down capture | Beta | Up divided by down |
|---|---|---|---|---|
| 30 June 2025 | 1.29 | 1.21 | 1.18 | 1.07 |
| 31 August 2025 | 1.28 | 1.21 | 1.18 | 1.06 |
| 30 September 2025 | 1.31 | 1.21 | 1.18 | 1.08 |
| 28 February 2026 | 1.32 | 1.12 | 1.18 | 1.18 |
| 31 March 2026 | 1.33 | 1.05 | 1.17 | 1.27 |
Source: PL AQUA factsheets, values matched to labels by their position in the document's text. The last column is our arithmetic.
Four lessons come straight out of that table.
The format is not the textbook format. The figures are printed as decimals, not percentages. A 1.32 reads as roughly 132 on the 100 scale. That is our inference, because the factsheet text does not define the term. Another manager may print 132% or 132, so normalise before comparing.
The method is not stated. We found no formula in the factsheet's text, nor a note on whether the monthly split or some other frequency was used. The factsheet does state that its returns are net of expenses, fees and associated costs, though it does not say in terms whether that note covers the capture row.
Since-inception figures can move fast. Down capture dropped from 1.21 to 1.05 in nine months. A figure built on under three years of data has few down months in it, so each new month carries real weight. A reader in June 2025 and one in March 2026 would have described the same strategy differently.
Both numbers sat above 1.00 at all five dates. That is a clue about market exposure, which brings us to the beta column. We return to it in the checks below.
A Twelve-Month Capture Calculation You Can Check
You do not need special software. Here is a hypothetical strategy against a hypothetical benchmark over twelve months. Every figure below was recomputed in Python, and you can reproduce them in a spreadsheet.
| Month | Benchmark % | Strategy % | Group |
|---|---|---|---|
| 1 | 4.0 | 4.6 | Up |
| 2 | -3.0 | -2.4 | Down |
| 3 | 2.5 | 2.9 | Up |
| 4 | 3.0 | 3.6 | Up |
| 5 | -5.0 | -4.0 | Down |
| 6 | 1.5 | 1.2 | Up |
| 7 | 6.0 | 7.2 | Up |
| 8 | -2.0 | -1.4 | Down |
| 9 | 3.5 | 3.9 | Up |
| 10 | 2.0 | 2.6 | Up |
| 11 | -4.0 | -3.8 | Down |
| 12 | 3.0 | 3.1 | Up |
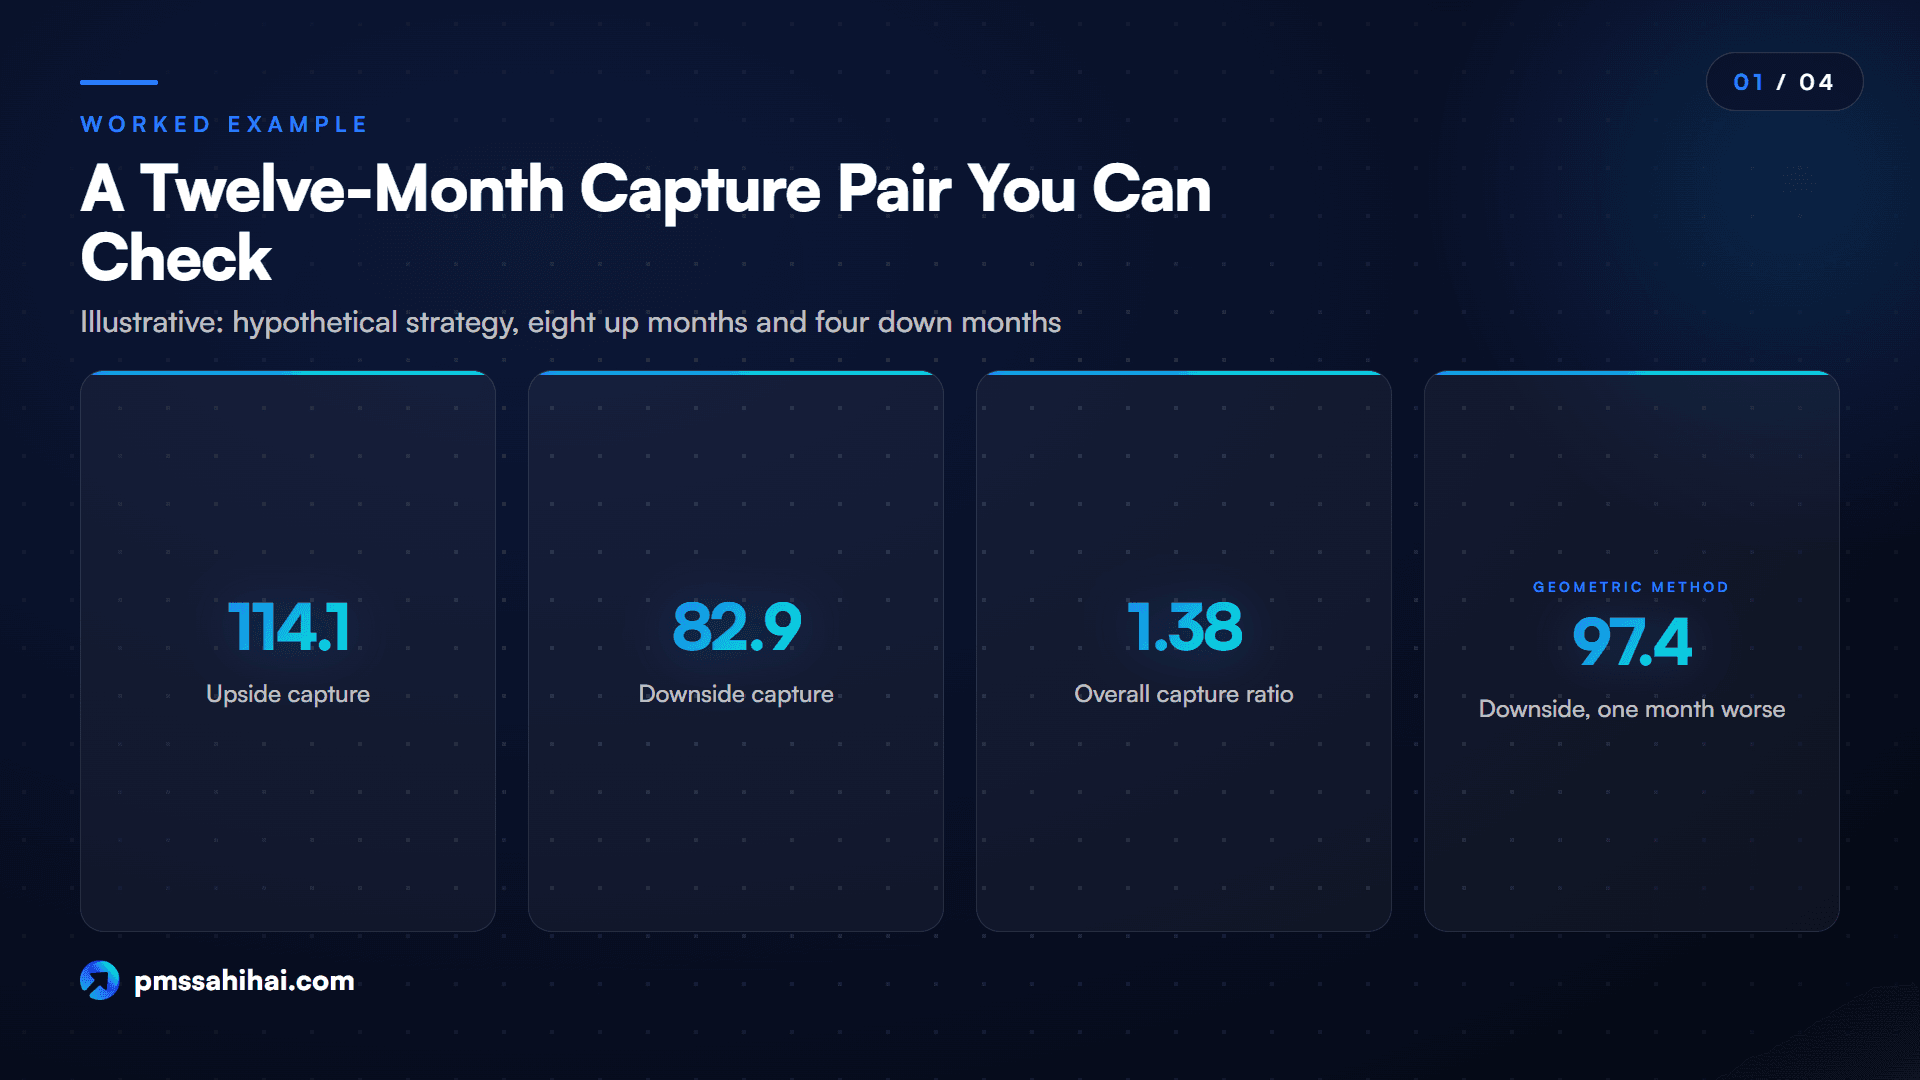
There are eight up months and four down months. In the up months, the strategy averaged 3.64% a month and the benchmark 3.19%. In the down months, the strategy averaged -2.90% and the benchmark -3.50%.
Simple arithmetic gives upside capture of 3.64 divided by 3.19, or 114.1, and downside capture of 2.90 divided by 3.50, or 82.9. The overall ratio is 1.38. Over the full year, the strategy returned 18.16% against the benchmark's 11.36%.
Now run the same data through other methods that are in common use.
| Method | Upside capture | Downside capture |
|---|---|---|
| Arithmetic mean of monthly returns | 114.1 | 82.9 |
| Geometric mean of monthly returns | 114.0 | 82.9 |
| Compounded return over those months | 115.8 | 83.6 |
| Compounded, then annualised | 116.9 | 85.5 |
The first method is the one PhonePe Invest describes. The second follows Morningstar India's description of geometric averages. The third and fourth reflect compounding approaches such as the one Freefincal uses, and his formula, he says, differs from Morningstar's while conveying the same meaning.
The gap here is under three points on each side, on mild data. It can be wider with volatile portfolios and longer windows. Treat a difference of a few points between two managers as noise unless you know they used the same method.
Here is the sensitivity test. Change only month 11, so that the strategy fell 5.8% rather than 3.8%. Upside capture does not move at all. Downside capture jumps from 82.9 to 97.4 on the geometric method. One bad month out of twelve erased most of the apparent protection. With four down months in the sample, that is what you should expect.
Reading Upside and Downside Capture Together
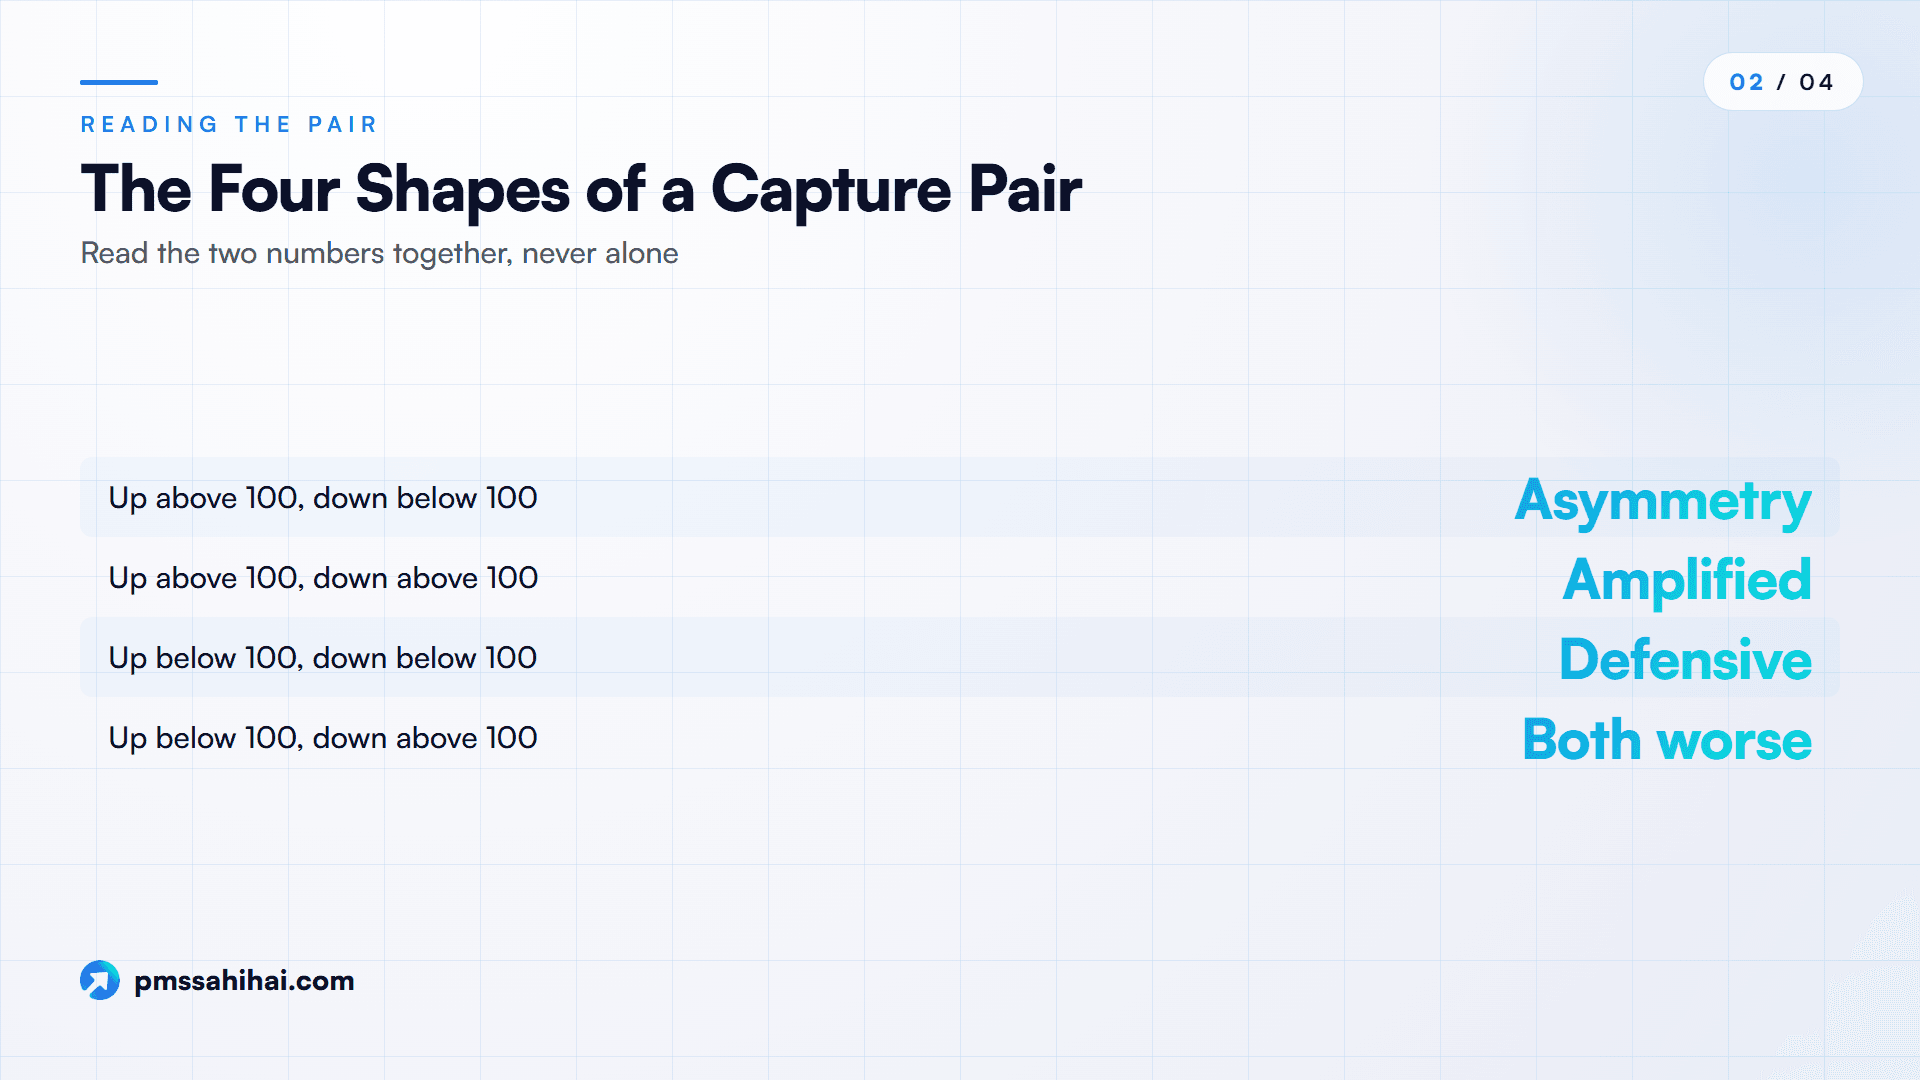
Neither number means much alone. The first step is to see which of four shapes you are looking at.
| Shape | What it often describes | Question to ask the manager |
|---|---|---|
| Up above 100, down below 100 | Favourable asymmetry over this window | Is it stock selection, cash timing or the benchmark? |
| Up above 100, down above 100 | Amplified market exposure | Does the excess above beta justify the fee? |
| Up below 100, down below 100 | Defensive profile, or a lot of cash | How much cash, and what did the mandate promise? |
| Up below 100, down above 100 | Worst of both over this window | What changed, and what has the manager done about it? |
Morningstar India noted that most active funds show a trade-off, where strong upside tends to come with weaker downside protection, and the reverse. So the top-left shape is not the usual one, and a claim of it should prompt curiosity about the method and benchmark before it prompts excitement.
Why the Overall Ratio Can Rank the Wrong Fund
The combined figure is tempting because it fits in one number. It does not tell you the return. Here are hypothetical strategies, each holding its capture multiple constant over 36 months, with benchmark months of +3.5% and -3.5%. We ran two market regimes: 24 up and 12 down, then 18 up and 18 down.
| Strategy | Up | Down | Up divided by down | 3-year return, 24 up and 12 down | 3-year return, 18 up and 18 down |
|---|---|---|---|---|---|
| Benchmark | 100 | 100 | 1.00 | 48.9% | -2.2% |
| High exposure | 130 | 130 | 1.00 | 66.4% | -3.7% |
| Amplified, some asymmetry | 132 | 112 | 1.18 | 83.0% | 9.8% |
| Balanced asymmetry | 110 | 85 | 1.29 | 72.3% | 14.6% |
| Defensive | 90 | 70 | 1.29 | 56.3% | 11.8% |
| Very defensive | 85 | 60 | 1.42 | 56.7% | 15.7% |
Read across the rows and three things stand out.
The highest ratio did not earn the highest return. The 85 and 60 strategy led on the ratio at 1.42, yet in the rising market it returned 56.7% against 83.0% for the 132 and 112 strategy, which scored only 1.18.
The ranking flipped with the regime. In the choppy market, that same 85 and 60 strategy came first. Your own view on what comes next, and your tolerance for lagging, decide which profile suits you. No ratio can settle that.
Equal ratios did not mean equal outcomes. The 110 and 85 strategy and the 90 and 70 strategy share a ratio of 1.29, yet they differed by about 16 percentage points in the rising market.
The Very defensive line also shows something uncomfortable. A strategy that took less than the benchmark on both sides still beat the benchmark in both regimes because its down figure was much smaller. The relationship depends on the mix of months, as the next table makes plain.
The Break-Even Line for Any Upside Figure
For any upside figure, there is a downside figure at which the strategy merely matches the benchmark. Using the same +3.5% and -3.5% months:
| Upside capture | Break-even downside, 24 up and 12 down | Break-even downside, 18 up and 18 down |
|---|---|---|
| 80 | 62.3 | 81.2 |
| 90 | 81.3 | 90.6 |
| 100 | 100.0 | 100.0 |
| 110 | 118.6 | 109.3 |
| 120 | 136.9 | 118.5 |
| 130 | 155.1 | 127.7 |
This table is more honest than the "above 1.00" rule. In a market with twice as many up months as down months, a strategy with 90 upside must keep its downside near 81 just to match the index. In a flat, choppy market, 90.6 would do. A low-upside manager needs real protection to earn a place, and how much depends on the market you get.
These examples use equal-sized months and fixed multiples, and they ignore tax. Real portfolios do not behave that neatly. Their purpose is to show the shape of the arithmetic, not to forecast anything.
Five Checks Before You Trust the Capture Pair
Check One: Compare the Pair With Beta
This is the check most explainers skip. Beta measures a portfolio's sensitivity to its benchmark, and a portfolio with a beta of 1.18 would be expected to show readings near 118 on both sides even with no skill at all. So compare against beta rather than against 100.
Take the February 2026 AQUA row: up 1.32, down 1.12, beta 1.18. As a rough reading, the up figure sits 14 points above beta and the down figure 6 points below it. So the portfolio's asymmetry is smaller than a comparison with 100 suggests on the up side, and more favourable than that comparison suggests on the down side. This is a rule of thumb rather than a formal test, since beta and capture are estimated differently. Our guide to alpha and beta in PMS explains the underlying idea.
Check Two: Confirm the Benchmark
Run the same twelve months above against a second, gentler hypothetical benchmark, one that returned 9.70% for the year. The strategy's numbers do not change at all, yet the readings move from 114.1 and 82.9 to 145.5 and 112.6. Downside capture crossed from "protective" to "worse than the index" purely through the choice of yardstick.
The rules here give you some protection. APMI prescribes up to three benchmarks for each strategy, the manager selects one, and changing it carries an exit option without load for clients and drops the earlier track record from performance reporting. Check that the capture row uses that same selected benchmark, and that it is a total return index. Our piece on benchmark selection goes deeper.
Check Three: Ask Whether the Figures Are Net of Fees
Fees sit on the wrong side of both numbers. Suppose a gross 110 and 85 strategy in the +3.5% and -3.5% market above bears a hypothetical 2.5% annual cost, or about 0.21% a month. Net of that, the pair becomes about 104.1 and 90.9. The cost took roughly six points off each side, and a good-looking pair became a modest one.
SEBI's reporting rules address return figures, and they do not address this row specifically, so ask. Our note on gross versus net TWRR covers the wider issue.
Check Four: Count the Down Months
Ask how many down months sit in the window. As Freefincal's own example shows, a window can contain only two non-positive index months. Any downside figure built on so few points is an anecdote. Morningstar India's warning about relying on one data point or one market cycle applies with extra force to a PMS with a short record.
Also check how flat months are treated. Morningstar's description uses months when the benchmark is up or down, while Freefincal puts non-positive months in the down group. This rarely matters, but it is one more way two calculations can differ.
Our rule of thumb, not an industry standard, is to be wary of a downside figure built on fewer than a dozen down months, and to ask for one-, three- and five-year readings wherever they exist.
Check Five: Look for Cash and Concentration Effects
Cash mechanically shrinks both figures. A portfolio that holds 20% in cash and otherwise mirrors the index shows about 80 up and 80 down, ignoring the return on cash. The pair looks defensive. There is no selection skill in it at all.
Concentration works differently. A PMS holding a small number of stocks can post a strong reading because of one or two positions in one or two months. Ask which months and holdings drove the figure. A factsheet may also show a client something different from their own experience, because the factsheet reports the approach's time-weighted return and not your account. SEBI requires the disclaimer that your performance may differ because of the timing of inflows and outflows, and that is why your statement carries XIRR. See our XIRR versus TWRR explainer for the difference.

What Capture Ratios Do Well for PMS Investors
With those checks in hand, the pair earns its place. These are its real strengths:
- It separates two behaviours a single return blends. Two strategies with the same five-year return may have reached it in opposite ways, and the pair shows you which.
- It is easy to read. The 100 line gives you a natural reference on each side, with no need for a statistics background.
- It can be reproduced. Unlike many proprietary scores, the calculation needs only monthly returns, so you can test what you are given.
- It shows behaviour relative to your yardstick. A Sharpe ratio compares with a risk-free rate, while capture figures stay anchored to the benchmark your manager chose.
- It generates good questions. Each shape in the table above leads to a specific question, which is more useful in a meeting with a manager than a general "how is performance?"
It also makes a practical task easier. Monitoring a PMS through quarterly reports tends to centre on whether the portfolio beat the index. A rolling view of the pair, which spreadsheets and tools such as Freefincal's calculators already offer for mutual funds, can show whether behaviour is drifting. If a manager marketed as defensive shows downside capture climbing year after year, you can raise that with facts rather than a feeling.
For a PMS, the data question has a partial answer. Monthly reports go to SEBI and APMI within seven working days of month-end, and APMI must make them available on its website. That helps with returns. For a proper capture calculation, you may still need the month-by-month series, so ask your manager for it. If the factsheet prints a capture figure, it is reasonable to ask for the data behind it.
How PMS Sahi Hai and Nyra Fit Into a Capture Ratio Review
PMS Sahi Hai is built around comparing strategies side by side, which is where a capture reading becomes useful, so it is fair to say plainly what the platform does and does not do on this subject.
What we could confirm. Nyra, the AI research tool on PMS Sahi Hai, gives strategies a Nyra Score from 0 to 10. Its published methodology uses five pillars: return performance (30%), risk-adjusted return (25%), downside protection (20%), consistency (15%), and structure and stewardship (10%). Strategies with under 12 months of track record are shown as "Not Rated". That last rule fits the sample-size concern above.
What we could not confirm. The Downside Protection pillar is described as covering maximum drawdown, volatility and beta. The descriptions available to us do not list capture ratios as an input, so do not read a Nyra Score as a capture reading. The two can sit side by side, and that is a sensible way to use them.
A practical way to combine them:
- Start with the comparison. Use Compare to shortlist PMS, AIF and GIFT City strategies, then look for those benchmarked alike.
- Read the factsheet. Pull the capture row, where one is printed, using our factsheet guide.
- Ask Nyra to explain. Plain-English questions about a score, a benchmark or a term are what the tool is for. The manager's own data remains the source for any capture figure.
- Take the checks to the manager. The formula, window and down-month count are questions only the manager can answer, and the team can help you frame them.
PMS Sahi Hai is an APMI-registered distributor, and its pages state that Nyra is an analytical tool, not a SEBI-registered investment adviser. Treat what you find as research rather than a recommendation.
Where Capture Ratios Mislead Careful Readers
The honest limits are substantial.
- There is no standard formula. Arithmetic, geometric and compounded versions all circulate, as our twelve-month table shows. Comparing across sources can mean comparing different statistics.
- They are backward-looking and window-dependent. Morningstar India's own examples show defensive funds holding up in downturns while lagging in rallies. A window dominated by one regime will flatter one style.
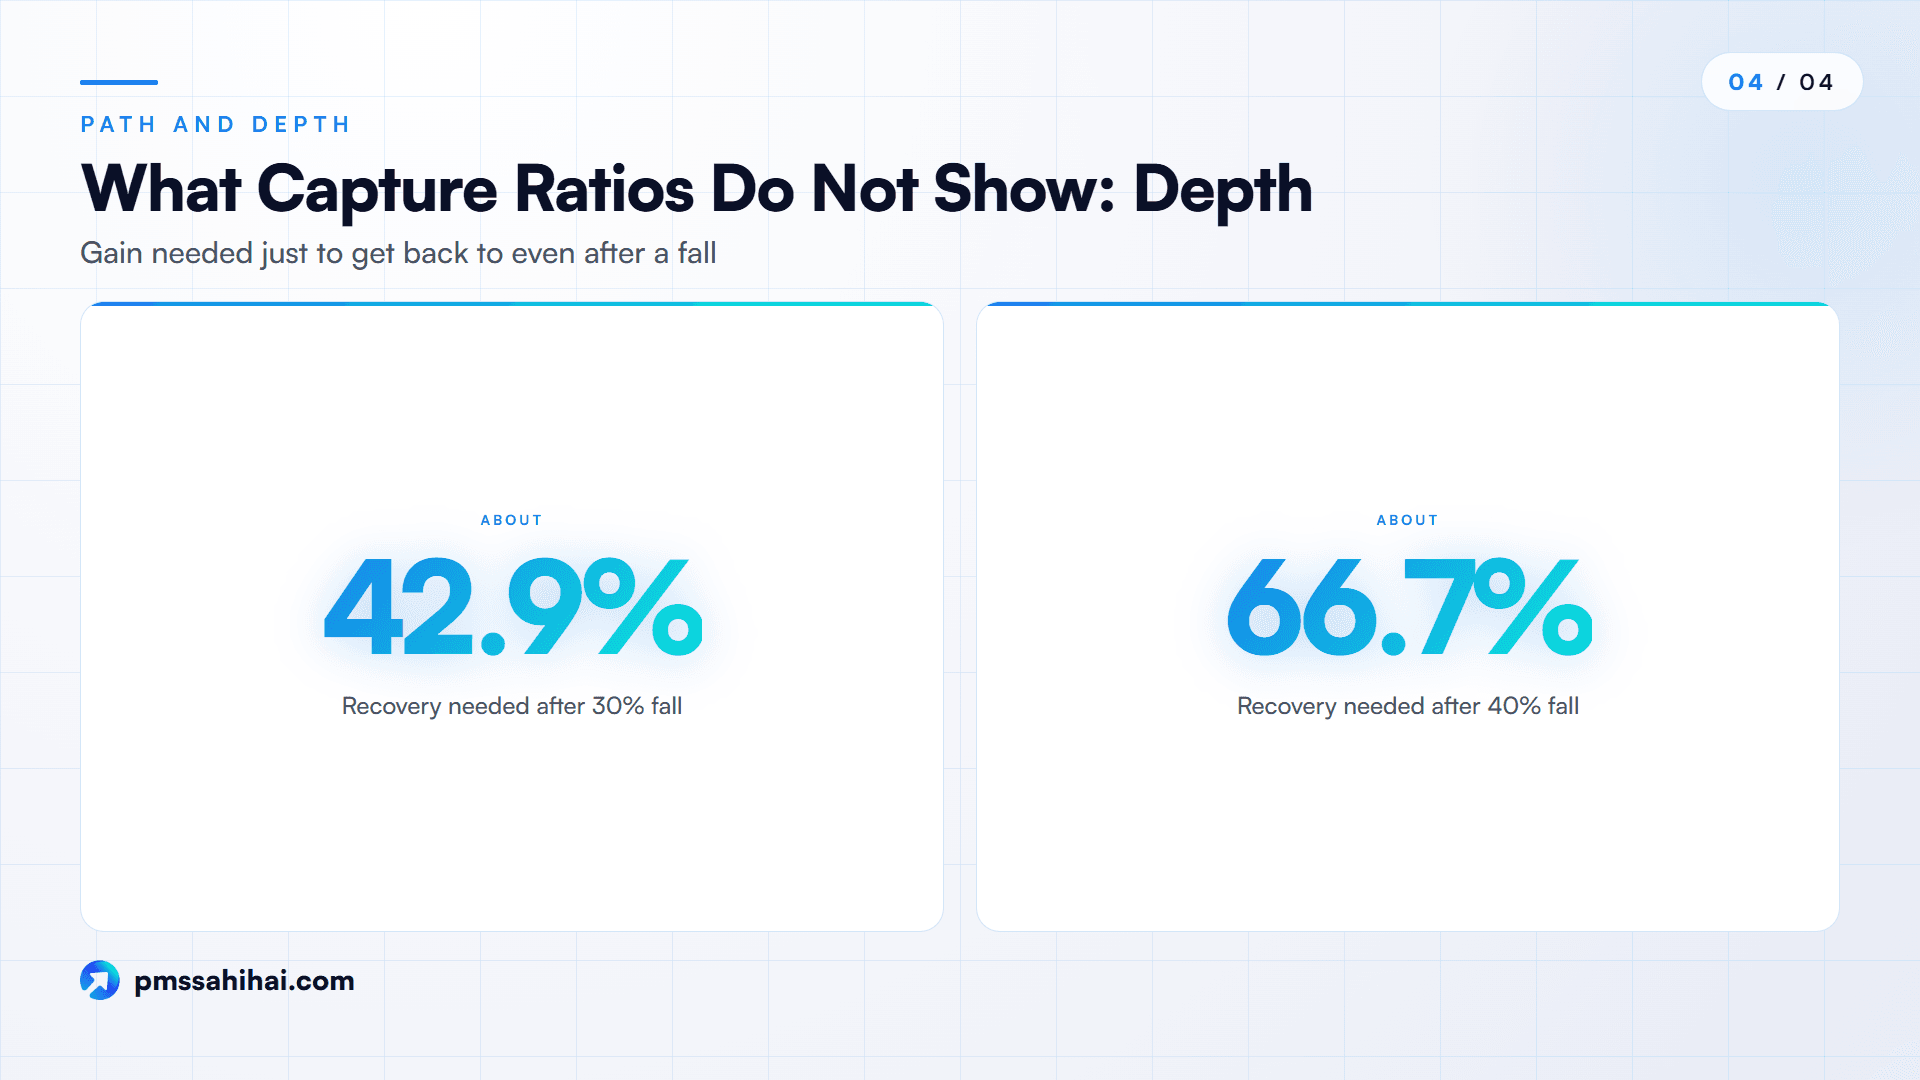
- They ignore path and depth. Monthly averages do not tell you how far a portfolio fell peak to trough or how long recovery took. A fall of 30% needs a gain of about 42.9% to get back to even, and a fall of 40% needs about 66.7%. Pair this row with maximum drawdown and our guide to how far a PMS portfolio can fall.
- Monthly data hides inside-month moves. A sharp fall and rebound within one month may leave no mark.
- Frequency matters for small samples. A short-history PMS may simply not have enough observations for a meaningful downside figure.
- They do not measure consistency. A capture ratio is one average over a window. Batting average, the share of periods in which a manager beats the index, answers a different question, and so does a rolling view.
- They say nothing about tax or your account. A pre-tax strategy figure is not your post-tax outcome, and in a PMS you hold the securities directly, so your own transactions are taxed. Consult a tax adviser on your position.
- No authority defines "good". We found no regulator or industry standard setting a target for PMS capture figures. Be cautious with any article, or sales pitch, quoting a single ideal range.
Reading the Pair Before You Sign a Mandate
Capture figures describe how a strategy has behaved relative to one benchmark, over one window, by one method. Good reading comes down to a short sequence: normalise the format, confirm the benchmark, check whether the figures are net, count the down months, compare with beta, then look at the shape.
After that, ask what you actually want. If you need to stay invested through falls without selling in panic, a lower downside figure may be worth lagging in rallies. If you have a long horizon and strong nerves, amplified exposure may be acceptable, provided the excess over beta justifies the fee. Our 36-month table shows no shape wins in every market.
The pair is a starting point for a conversation. Bring it to the meeting, with the checks above, and see how clearly the manager can explain it. That answer may tell you as much as the numbers do, and Nyra on PMS Sahi Hai can help you prepare the questions. This article is general information, and past performance does not guarantee future results.
Take Your Capture Questions to the Next Step
Take the checks above, and the shape table, into your next review of a strategy. Ask for the formula, the benchmark, the window, the number of down months and whether the figures are net of fees. A manager who answers those clearly has given you something useful, whatever the numbers say.
You can compare strategies on PMS Sahi Hai, ask Nyra to explain a score or term, or talk to the team about what to put to a manager. Past performance does not guarantee future results, and this article is general information, not personal investment advice.
PMS Sahi Hai is a distributor of Portfolio Management Services and Alternative Investment Funds, APMI-registered (Registration No. APRN08358). This article is for education only and is not investment advice, a recommendation, or an offer to buy or sell any security. Investments in securities markets are subject to market risks; read all scheme-related documents carefully. Past performance is not indicative of future results. Consult your advisor before investing.
Ishaan founded PMS Sahi Hai to make India's PMS, AIF and GIFT City markets legible to serious investors, comparing every SEBI-registered manager on the same comparative basis, with no shelf products and no commission bias.
Frequently asked
What does an upside capture of 110 mean in a PMS factsheet?
It means that, in the months the benchmark rose during the stated window, the strategy delivered about 110% of the benchmark's return, so 3.3% in a month the index rose 3%. It describes the average across those months rather than each month. Check the method, the benchmark and whether fees are included before relying on it.
What is a good capture ratio for a PMS?
No regulator or industry body sets a target, and we found no credible universal threshold. Above 100 on the up side with below 100 on the down side looks favourable, but compare with beta and with strategies on the same benchmark. Our break-even table shows the acceptable pair also depends on how many months rise and fall.
Can a PMS have both upside and downside capture above 100?
Yes, and it is common for portfolios with a beta above 1, including concentrated or smaller-company strategies. It means the portfolio amplified both rises and falls. The useful question is whether the up figure exceeds beta by more than the down figure does, which suggests something beyond simple market exposure over that window. It does not prove skill.
Does SEBI require capture ratios in a PMS factsheet?
We found no such requirement in SEBI's Master Circular for Portfolio Managers of 16 July 2025 or its September 2024 FAQ. Those documents require TWRR with the benchmark's trailing return, client-level XIRR and relative performance disclosures. Capture figures are therefore a voluntary addition, so the manager chooses the method and window. Ask for those details.
How many months of data does a capture ratio need?
No formal minimum exists. The practical constraint is the number of down months, since rising markets may leave few of them. Our twelve-month example shows one month changing downside capture from 82.9 to 97.4. As our own rule of thumb, be wary below a dozen down months, and prefer readings across several windows.
Why do capture ratios differ across sources?
Sources use different formulas, including arithmetic means, geometric means and compounded returns. They may also use different benchmarks, windows, data frequencies and treatment of flat months, and some report gross of fees. On our sample data, four methods produced upside readings from 114.0 to 116.9. Compare numbers only when you know they were computed the same way.
Is capture ratio the same as beta?
No. Beta estimates a portfolio's overall sensitivity to the benchmark across all months, while capture figures are calculated separately for rising and falling months. Used together, they are more useful than either alone. A beta of 1.18 suggests readings near 118 on both sides, so any gap from that level is what deserves your attention.
Can downside capture be negative?
Yes. A negative downside capture means the strategy had a positive average return in months when the benchmark fell. It is unusual for a long-only equity PMS and may reflect cash, hedges, a very short window or a mismatched benchmark. Treat it as a reason to examine the months involved, rather than as proof of protection.
Keep reading
All articles
Highest Capture Ratio Mutual Funds as of 30 Sep 2026: A Data Screen
A computed screen of 27 large cap funds by capture ratio as of 30 Sep 2026: method, limits and rank shifts. Not advice. Market risks apply.

What Is Estate Planning? Why Nomination Alone Doesn’t Transfer Wealth
Estate planning in India explained: why a nominee only receives assets, and how a will, trust and joint holding decide who finally owns your wealth.
POA in a Demat Account: What You Signed and What DDPI Changed
What a POA in a demat account lets a broker do, how SEBI's DDPI limits it, why old POAs stay valid until revoked, and how to check and cancel yours.
Read it. Now pressure-test it.
Ask Nyra how this applies to your portfolio, or talk to our team, no pitch, no pressure.