
Highest Capture Ratio Mutual Funds as of 30 Sep 2026: A Data Screen
A computed screen of 27 large cap funds by capture ratio as of 30 Sep 2026: method, limits and rank shifts. Not advice. Market risks apply.


This is a computed data screen, not a recommendation: we ranked 27 large cap funds, direct growth plans with at least 60 months of NAV history, by capture ratio (upside capture divided by downside capture) over the five years to 30 September 2026. The benchmark is a proxy, a Nifty 100 index fund's NAV, because we could not obtain the index series itself. The top ten shares only four names with the same five-year test run a year earlier, so treat the order as a description of one window. Mutual fund investments are subject to market risks, read all scheme-related documents carefully. Past performance doesn't indicate future returns, and capture ratios change with the period and benchmark.
Why Capture Ratio Mutual Funds Need a Stated Method
People search for the "top 10 best capture ratio mutual funds" and expect a clean list. A clean list is possible. A claim of "best" is not, and this article does not make one.
A capture ratio describes what a fund did relative to a chosen benchmark in a chosen window. Change the window and the list changes. Change the benchmark and the numbers change. Change the formula and they change again. A ranking with no stated method cannot be checked, which is why most of this page is about the method.
Here is what you get:
- One screen with one rule, one category and one as-of date, computed by us from public NAV data.
- The formula, plus a worked example you can follow on a calculator.
- A table showing how the same funds rank over other windows.
- A plain list of what the screen cannot tell you.
Three statements apply to every number below. Mutual fund investments are subject to market risks, read all scheme-related documents carefully. Past performance doesn't indicate future returns. Capture ratios change with the period and benchmark.
Nothing here says any scheme suits you, and nothing here suggests buying, selling or holding one. The fund names appear because a data table of this kind has no meaning without them.
How Capture Ratios Reached Indian Fund Analysis
The idea behind the measure is simple. Average return hides the path. Two funds with the same return can get there in very different ways, one by keeping pace in rallies and another by losing less in falls. Upside capture and downside capture separate those two parts.
In India, Morningstar has been one of the visible publishers. Its explainer describes upside capture as the fund's return in months when the benchmark rose, divided by the benchmark's return in those months, and downside capture as the same comparison for months when the benchmark fell. It reports the ratios over 1, 3, 5, 10 and 15 years using a geometric average of returns, and says large cap funds are measured against the BSE 100.
Fund screens built on the measure are not new either. On 6 June 2012, Morningstar India published a screen requiring five-year capture ratios better than the category average. Its stated reason for picking five years is still instructive: three years seemed too short, and ten years left too few funds. That is a judgement call, and we make a similar one below.
The category itself has also been defined more tightly over time. SEBI's categorisation framework dates to its circular of 6 October 2017. Its revised circular of 26 February 2026 keeps the Large Cap Fund minimum at 80% of total assets in large cap equity and equity-related instruments, which gives a same-category screen a shared mandate to start from.
More recently, personal finance publishers have run their own versions. On 28 December 2025, Outlook Money published a down-capture screen using Ace MF data, with an asset-size filter and a requirement that both three-year and five-year down-capture be below 80. Freefincal, an independent personal finance site, describes a CAGR-based version and defines the capture ratio as upside divided by downside, the definition used here.
Today the measure is mostly a software output. AMFI publishes daily NAVs, so a short script can produce these ratios for a whole category in minutes. The harder part is no longer arithmetic. It is choosing a defensible method and being honest about what it leaves out.
How This Large Cap Screen Was Built
Every number in the tables was computed by us, unless marked otherwise. Here is the full method.
| Setting | Choice |
|---|---|
| As-of date | 30 September 2026, the last complete month before writing |
| Category | AMFI "Equity Scheme - Large Cap Fund" |
| Plan | Direct Plan, Growth Option |
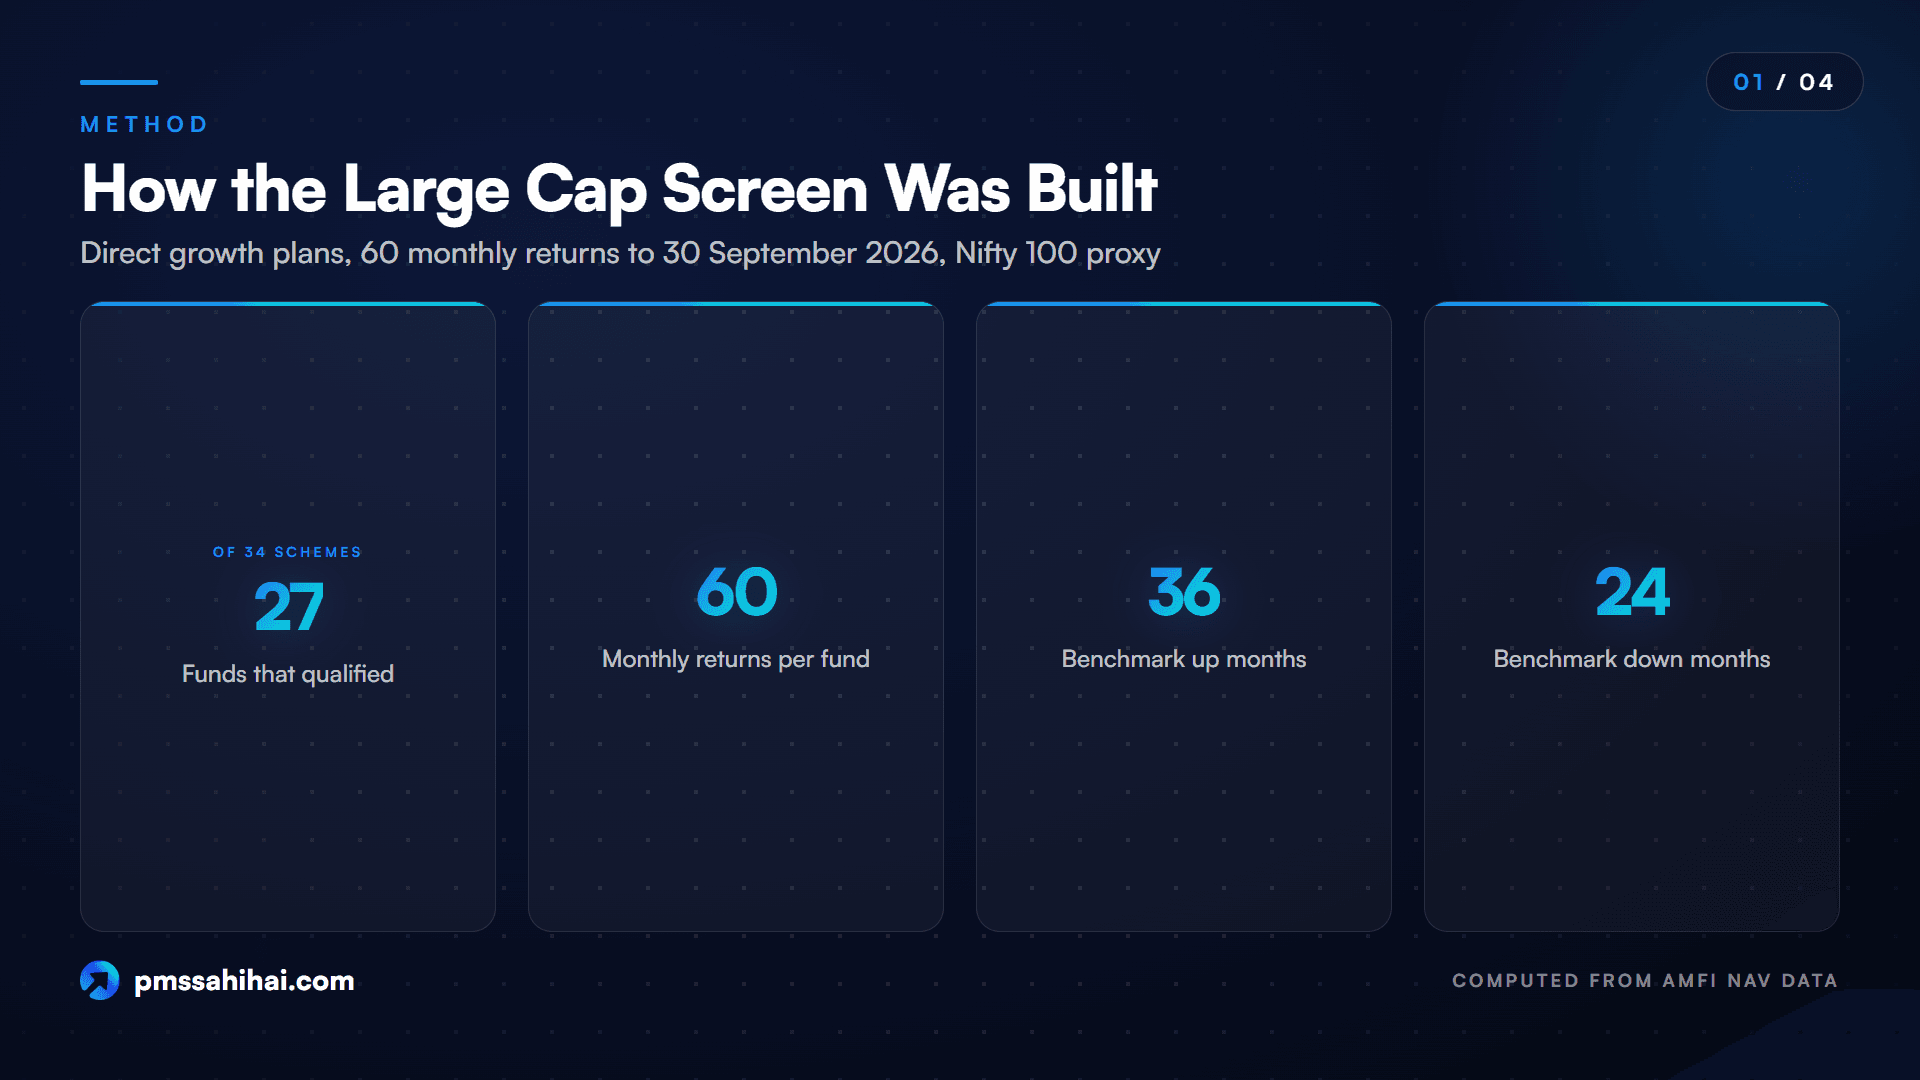
| Period | 60 monthly returns, from 30 Sep 2021 to 30 Sep 2026 |
| Minimum history | NAV available on the start date, 60 full months |
| Benchmark | Axis Nifty 100 Index Fund Direct Growth NAV, used as a proxy |
| Up and down months | 36 benchmark up months, 24 down months |
| Ranking rule | Capture ratio, highest first |
| Filters not applied | Fund size, manager tenure, costs, rating |
AMFI's NAV file dated 29 October 2026 lists 34 large cap direct growth schemes. Seven lacked 60 months of history and were excluded: Bajaj Finserv, Baroda BNP Paribas, Parag Parikh, quant, JioBlackRock, Samco and WhiteOak Capital. That leaves 27 funds.
NAV history came through MFAPI, a third-party mirror of AMFI data, because it offers each scheme's full series in one file. We checked it against AMFI's own file for 29 October 2026, and all 34 values matched. Month-end values use the last NAV on or before the month-end.
The Capture Ratio Formula Used Here
The steps are:
- Compute monthly returns for the fund and the benchmark.
- Mark each month as up or down according to the benchmark.
- Compound the fund's up-month returns and annualise them: multiply (1 + r) across those months, raise the product to the power (12 / number of up months), and subtract 1.
- Do the same for the benchmark's up months, and for both in the down months.
Then:
- Upside capture = fund's annualised up-month return / benchmark's annualised up-month return x 100
- Downside capture = fund's annualised down-month return / benchmark's annualised down-month return x 100
- Capture ratio = upside capture / downside capture
A capture ratio above 1 means the fund's upside capture was larger than its downside capture over that window. It says nothing about the next window. Other publishers may use different formulas, so their figures need not match ours.
The Benchmark Proxy and Why It Was Used
Our plan was to use published Nifty 100 TRI values. A SEBI-hosted scheme document cites clause 6.14.2.2 of the SEBI Master Circular, under which performance is benchmarked to the Total Return variant of an index, so TRI is the natural yardstick. We could not obtain a monthly TRI series during this work, so we used the NAV of an index fund that tracks the Nifty 100.
That is a real compromise and you should weigh it. A fund's NAV carries expenses and tracking difference, so the proxy runs slightly below the index. Multibagg, a third-party site, shows Nifty 100 TRI returns to 28 October 2026 of -9.52% over one year, 8.97% over three years and 7.16% over five years. Our proxy shows -10.16%, 8.45% and 6.50% to the same date, a gap of about 0.5 to 0.7 percentage points a year.
To test the effect, we raised the proxy's monthly returns by 0.05% and reran the screen. This is a sensitivity test, not an estimate of the index. The same ten funds came out in the same order, while upside capture fell about 2 points and downside capture rose about 1 point. So read the levels below as slightly flattering, and treat the order as the more robust output.
Ten Highest Capture Ratio Large Cap Funds in This Screen
Figures are computed, for direct growth plans, for the 60 months to 30 September 2026, against the Nifty 100 proxy. This table is a data illustration, not a recommendation or a shortlist.
| Rank | Scheme (Direct Growth) | Upside capture | Downside capture | Capture ratio |
|---|---|---|---|---|
| 1 | Nippon India Large Cap Fund | 109.07 | 84.12 | 1.30 |
| 2 | Invesco India Large Cap Fund | 115.00 | 96.45 | 1.19 |
| 3 | ICICI Prudential Large Cap Fund | 101.08 | 84.82 | 1.19 |
| 4 | Taurus Large Cap Fund | 116.33 | 100.16 | 1.16 |
| 5 | Bandhan Large Cap Fund | 106.73 | 92.44 | 1.15 |
| 6 | HDFC Large Cap Fund | 102.65 | 89.00 | 1.15 |
| 7 | JM Large Cap Fund | 108.08 | 94.22 | 1.15 |
| 8 | Edelweiss Large Cap Fund | 102.11 | 90.11 | 1.13 |
| 9 | Bank of India Large Cap Fund | 110.31 | 98.59 | 1.12 |
| 10 | DSP Large Cap Fund | 95.78 | 87.72 | 1.09 |
Several things stand out once you read past the rank column.
The same ratio can come from very different profiles. Invesco and ICICI Prudential sit together at 1.19, yet one has a much higher upside capture and the other a much lower downside capture. A single ranking number cannot tell you which profile you are looking at.
A fund can rank high with a downside capture above 100. Taurus ranks fourth with downside capture of 100.16, meaning it fell about as much as the proxy in down months.
A fund can rank high with an upside capture below 100. DSP ranks tenth with upside capture of 95.78, meaning it rose less than the proxy in up months.
Gaps near the top are thin. Ranks 5, 6 and 7 are 1.1545, 1.1534 and 1.1471. Differences that small should not carry weight, especially with the proxy issue above.
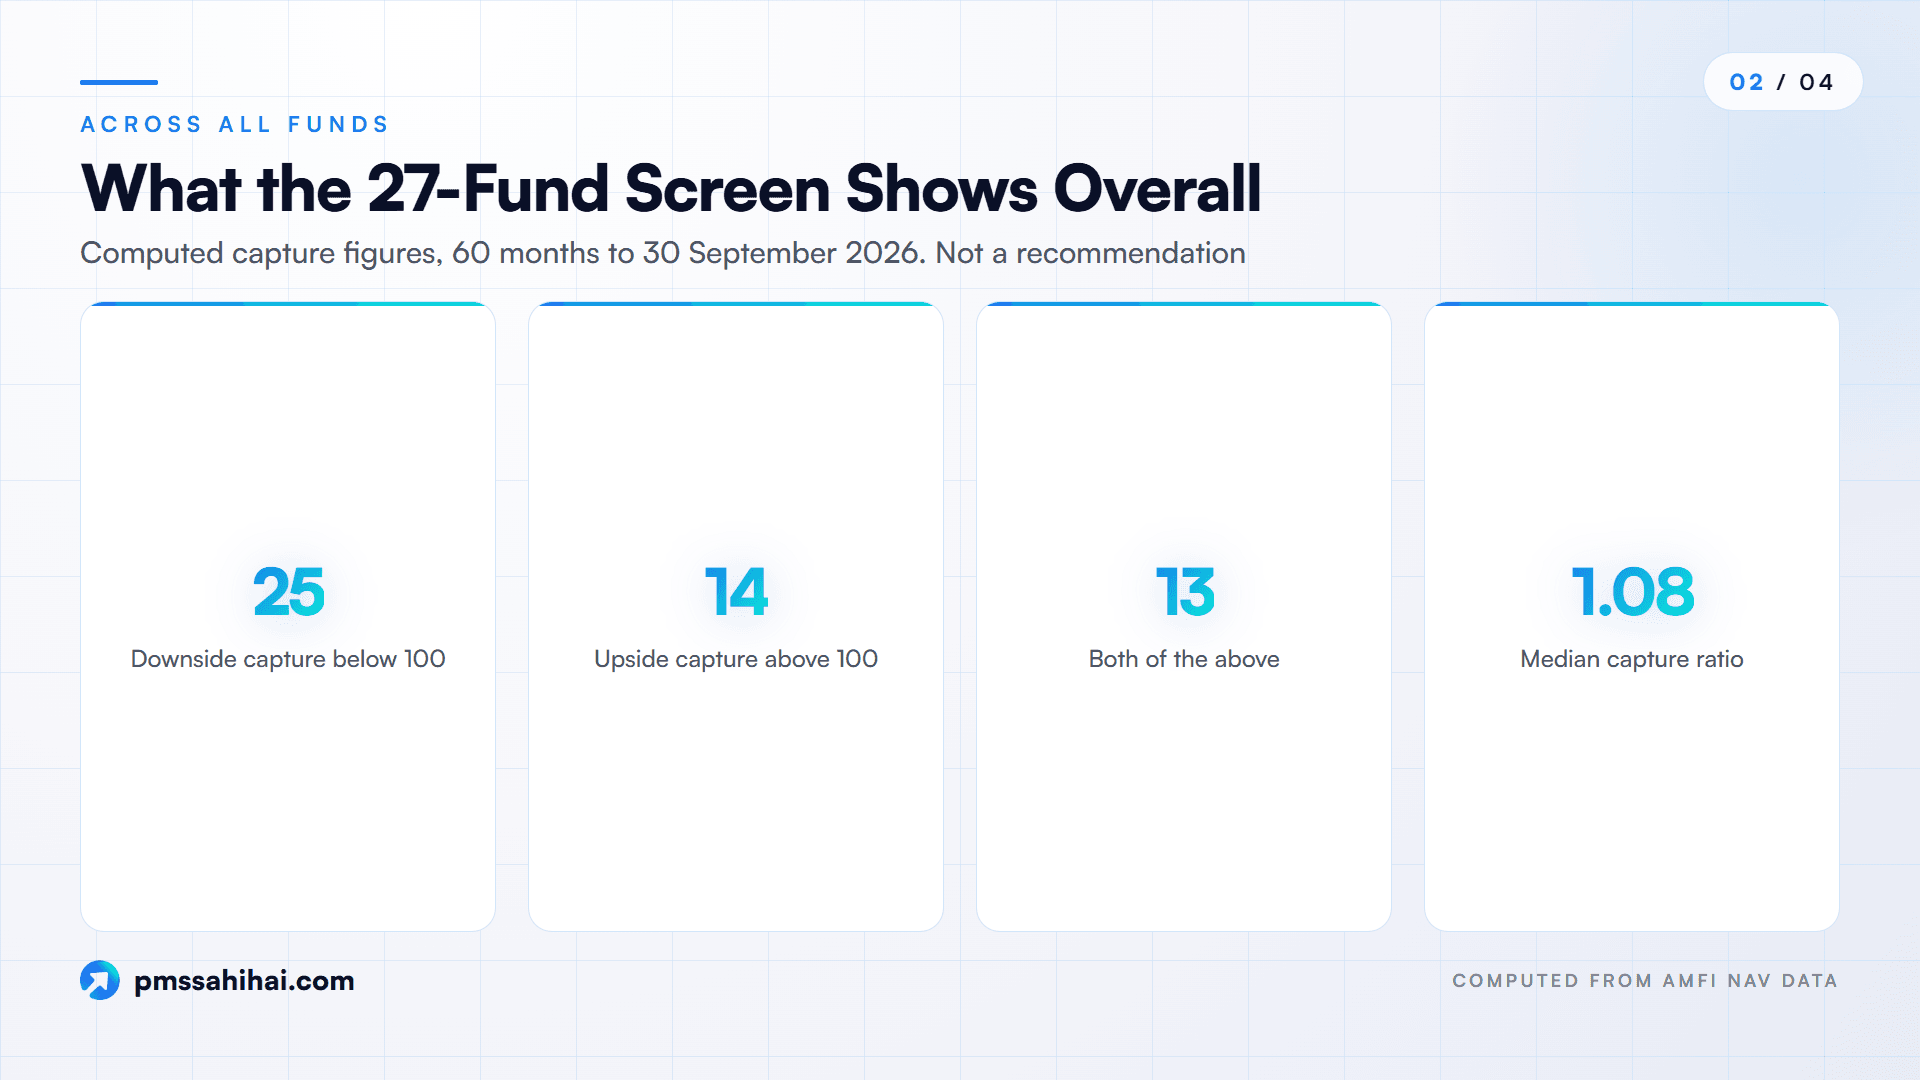
Across all 27 funds, 25 had downside capture below 100 and 14 had upside capture above 100, while 13 had both. The median capture ratio was 1.08, and five funds were below 1. Any of those numbers would look different against the index itself. A capture ratio is not a return figure.
A Worked Capture Ratio Calculation From NAV Data
Take the first row. The computed annualised returns for the 60-month window are:
| Months | Nippon India Large Cap (Direct Growth) | Nifty 100 proxy |
|---|---|---|
| 36 up months, annualised | 50.32% | 46.13% |
| 24 down months, annualised | -27.95% | -33.23% |
These are high numbers because they are annualised returns from only the up months or only the down months. No investor earned them as an actual return. They exist only as inputs to the ratio.
The arithmetic is:
- Upside capture = 50.32 / 46.13 x 100, about 109
- Downside capture = -27.95 / -33.23 x 100, about 84
- Capture ratio = 109.07 / 84.12 = 1.30
The small differences from dividing rounded inputs are why we show the unrounded result in the table. The two negative signs cancel in the downside step, so a lower downside capture means the fund's down-month losses were smaller than the proxy's.
Over the same 60 months, the proxy's overall annualised return was 6.83%, using the same data. Notice how far that is from the 46.13% up-month figure and the -33.23% down-month figure. It is a useful reminder that the ratio's inputs are not returns anyone received.
How the Ranking Shifts With Period and Benchmark
This table reruns the same rule for other windows. Everything else stays the same. A dash means the fund lacked the history for that window.
| Scheme | 5Y to Sep 2026 | 3Y to Sep 2026 | 1Y to Sep 2026 | 5Y to Mar 2026 | 5Y to Sep 2025 |
|---|---|---|---|---|---|
| Nippon India | 1 | 9 | 27 | 1 | 1 |
| Invesco India | 2 | 1 | 4 | 4 | 13 |
| ICICI Prudential | 3 | 11 | 29 | 2 | 2 |
| Taurus | 4 | 3 | 1 | 18 | 23 |
| Bandhan | 5 | 6 | 7 | 6 | 14 |
| HDFC | 6 | 23 | 18 | 3 | 3 |
| JM | 7 | 12 | 8 | 9 | 17 |
| Edelweiss | 8 | 15 | 13 | 5 | 12 |
| Bank of India | 9 | 5 | 3 | – | – |
| DSP | 10 | 10 | 31 | 7 | 7 |
| Funds ranked | 27 | 30 | 32 | 26 | 24 |
| Shared with main top ten | – | 6 | 5 | 8 | 4 |
The spread is large. Taurus is first over one year and 23rd over the five years to September 2025. HDFC is sixth over five years and 23rd over three. Nippon India is first in all three five-year windows, but 27th of 32 over one year.
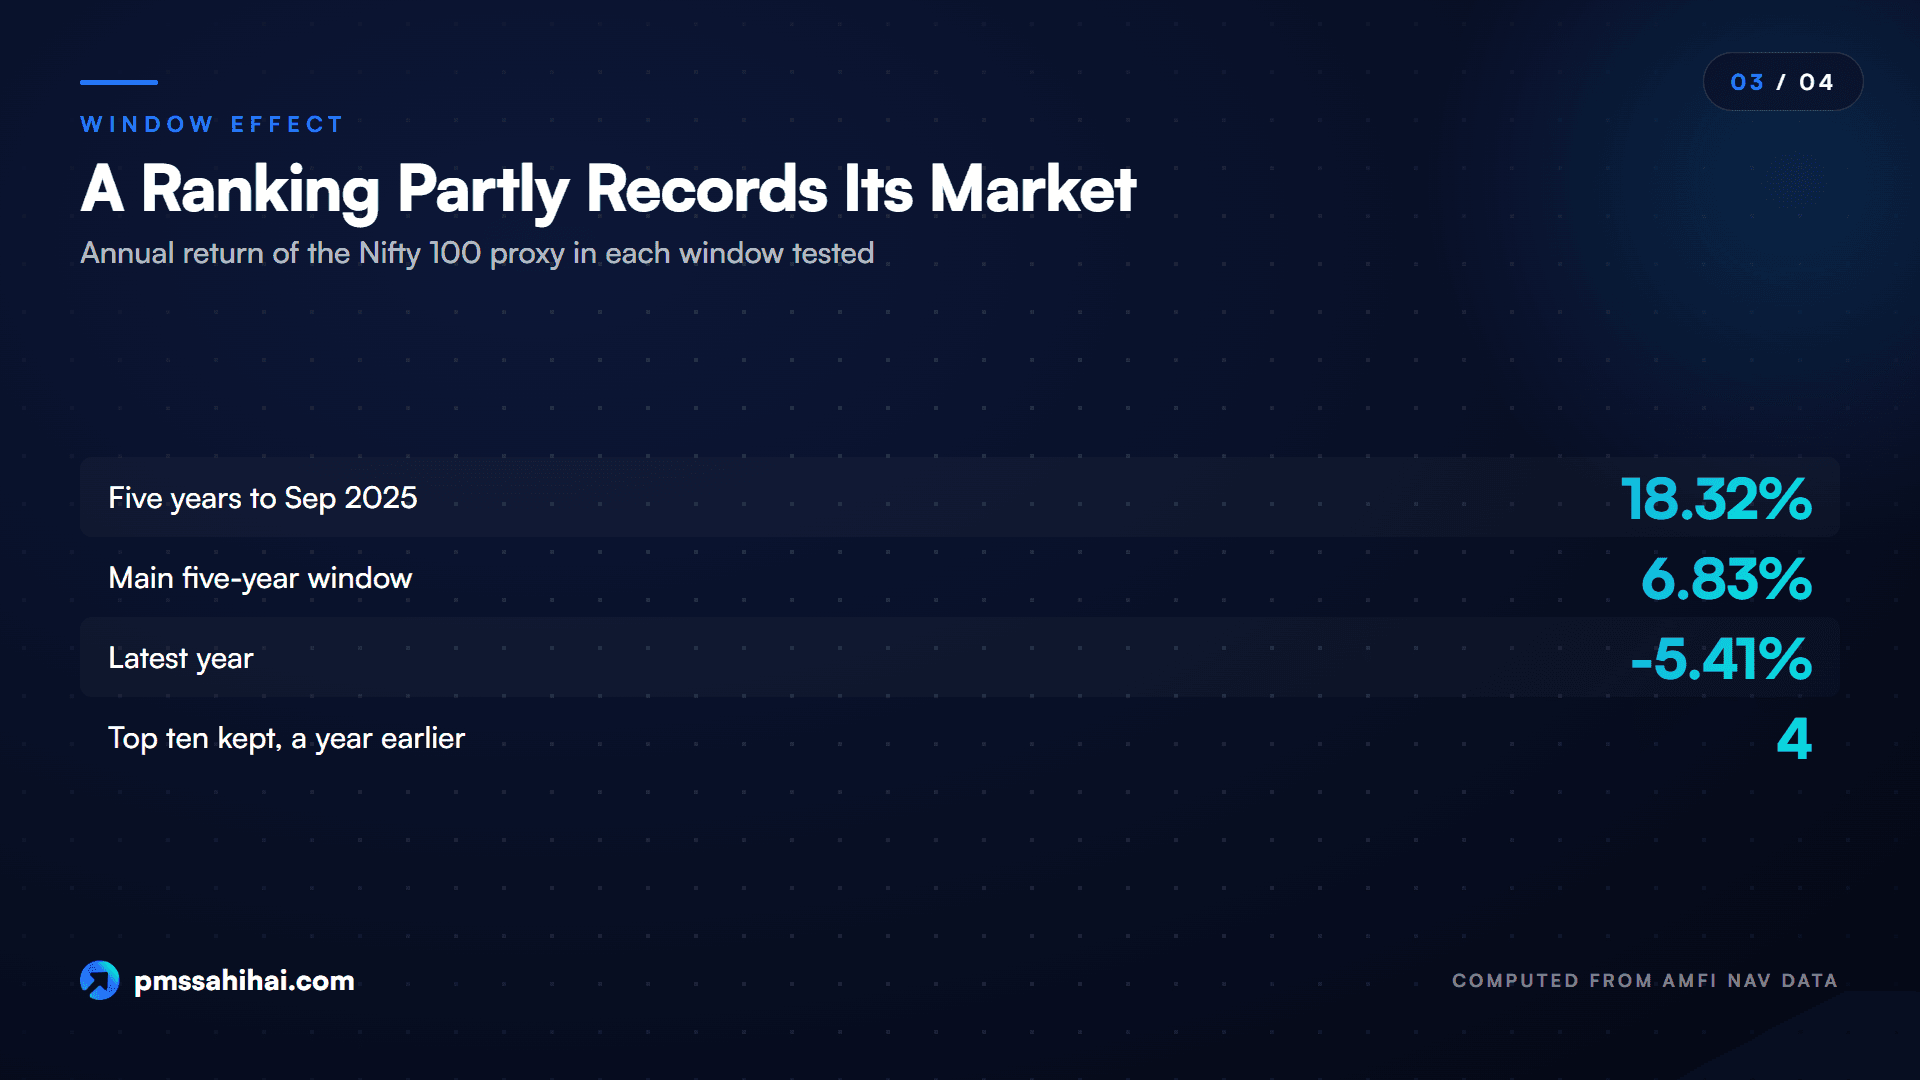
Moving the end date by only 12 months leaves four of the ten names in the top ten. The five-year window to September 2025 had a very different backdrop too: the proxy compounded at 18.32% a year, against 6.83% in the main window and -5.41% over the latest year. A ranking partly records the market it was measured in.
The one-year column deserves extra caution. It rests on just six up months and six down months, so a single month can move a result sharply.
Changing the benchmark moved the numbers more than the membership. Using the UTI Nifty 50 Index Fund Direct Growth NAV as the proxy, the same ten funds stayed in the top ten for the 60-month window, but ICICI Prudential moved to second and Invesco to third, and Nippon India's ratio rose from 1.30 to 1.37. Using the HDFC Nifty 100 Index Fund Direct Growth NAV for the three-year window kept the same ten names as the first three-year test, though quant and Taurus swapped places. Those are proxy tests only, and a different index family could shift things further.
Changing the ranking rule also shifts the order. Sorted by lowest downside capture alone, the first five in the 27-fund set are Nippon India, ICICI Prudential, SBI, DSP and Sundaram. Sorted by highest upside capture alone, they are Taurus, Invesco, Bank of India, Nippon India and JM.
What Capture Ratios Do Well When Comparing Funds
For all those cautions, the measure has real uses when you treat it as a description.
- It splits one number into two. A return figure blends rising and falling months. Capture figures show each side.
- It makes asymmetry visible. You can see whether a fund kept up in rallies, cushioned falls, did both or did neither in that window.
- It suits same-category comparison. Nippon India Mutual Fund's explainer stresses using an appropriate benchmark, and funds under one category mandate at least share one starting point.
- It can be computed from public data. Daily NAVs are published by AMFI, so you do not need a paid terminal to check a figure.
- It works with other measures. Volatility, drawdown and rolling returns each cover something capture does not. Morningstar India's 2022 market-fall piece, for example, used maximum drawdown for a related question.
It also makes some tasks easier. If a factsheet quotes a capture figure, you can ask concrete questions: against what benchmark, over which months and by what formula? If two sites disagree, those same questions usually explain why. And if a fund is described as defensive, the downside figure over several windows gives you something to test that word against.
None of this turns a capture ratio into a forecast. It simply makes a fund's history easier to read.
How PMS Sahi Hai Treats Capture Ratio Data Without Listing Mutual Funds
A plain statement first: PMS Sahi Hai does not list mutual funds. Its comparison shelf, as our earlier posts describe it, covers PMS, AIF and GIFT City strategies. None of the schemes in the table above can be compared or scored on the platform.
This article is a data illustration, not advice. PMS Sahi Hai is an APMI-registered distributor of PMS and AIF products (APRN08358), and APMI registration does not vouch for a distributor's credentials. Nyra, the platform's AI research tool, describes itself as an analytical tool and not a SEBI-registered investment adviser. Nothing on this page is a recommendation to buy, sell or hold any mutual fund scheme.
So why run this screen? Because the habit of reading it carries across products. The questions you ask of a mutual fund's capture figure, which benchmark, which months and which formula, are the same questions a PMS or AIF investor should ask of a factsheet.
That is where the platform's own material can help:
- Reading a factsheet. The guide on how to read a PMS factsheet walks through a performance document section by section, and alpha and beta in PMS covers related benchmark-relative measures.
- Comparing the structures. If you are weighing the products themselves, PMS vs mutual fund sets out the differences in returns, tax and fees.
- PMS and AIF comparison. The compare page and AIF compare page line up strategies in those categories only.
- Scoring method. Nyra's published methodology lists five pillars for PMS and AIF strategies, including downside protection. We are not aware of the platform publishing capture ratios as a field, so don't assume these figures exist there.
If your question is about a mutual fund scheme, the right documents are that scheme's own, along with AMFI's data. The platform is not a source for them.
Limits of This Capture Ratio Ranking
This section matters as much as the table.
It uses a proxy benchmark. The ratios are measured against an index fund NAV, not Nifty 100 TRI. The gap to the published TRI returns above was about 0.5 to 0.7 points a year.
A single benchmark may not fit every fund. Morningstar notes that comparing all funds in an asset class with one benchmark can make funds with different styles look striking. A fund's own stated benchmark may differ from ours, and Morningstar's explainer says it uses the BSE 100 for this category.
There is survivorship bias. We started from schemes in AMFI's file in October 2026. Schemes that closed or merged earlier are not in the data, and such exclusions are a known source of bias in fund performance studies.
History is not a like-for-like record. We did not adjust for changes in fund manager, mandate, scheme mergers or category changes. A fund's name today may hide a different process in earlier years.
Fund size was not checked. We applied no asset-size filter and did not measure scheme size, so nothing here speaks to how size may have affected any result.
The numbers cover direct growth plans only. Regular plans carry higher expenses, so their figures would differ. Exit loads, taxes and your own entry and exit dates are not reflected.
One market cycle is thin. Sixty months is a modest sample, and 24 down months is smaller still. Morningstar warns against relying on a single ratio, especially over one market cycle, and notes that most active funds show a trade-off between the two sides.
The rule itself is a choice. Dividing upside by downside treats them symmetrically. A reader who cares mostly about falls might prefer a different sort, and as shown above, that changes the list.
The data is frozen on one date. These figures are as of 30 September 2026 and will go out of date. We have not checked them against any AMC's factsheet, which may use a different formula and benchmark.
How to Recompute a Capture Ratio Yourself
You can repeat this in a spreadsheet, one fund at a time.
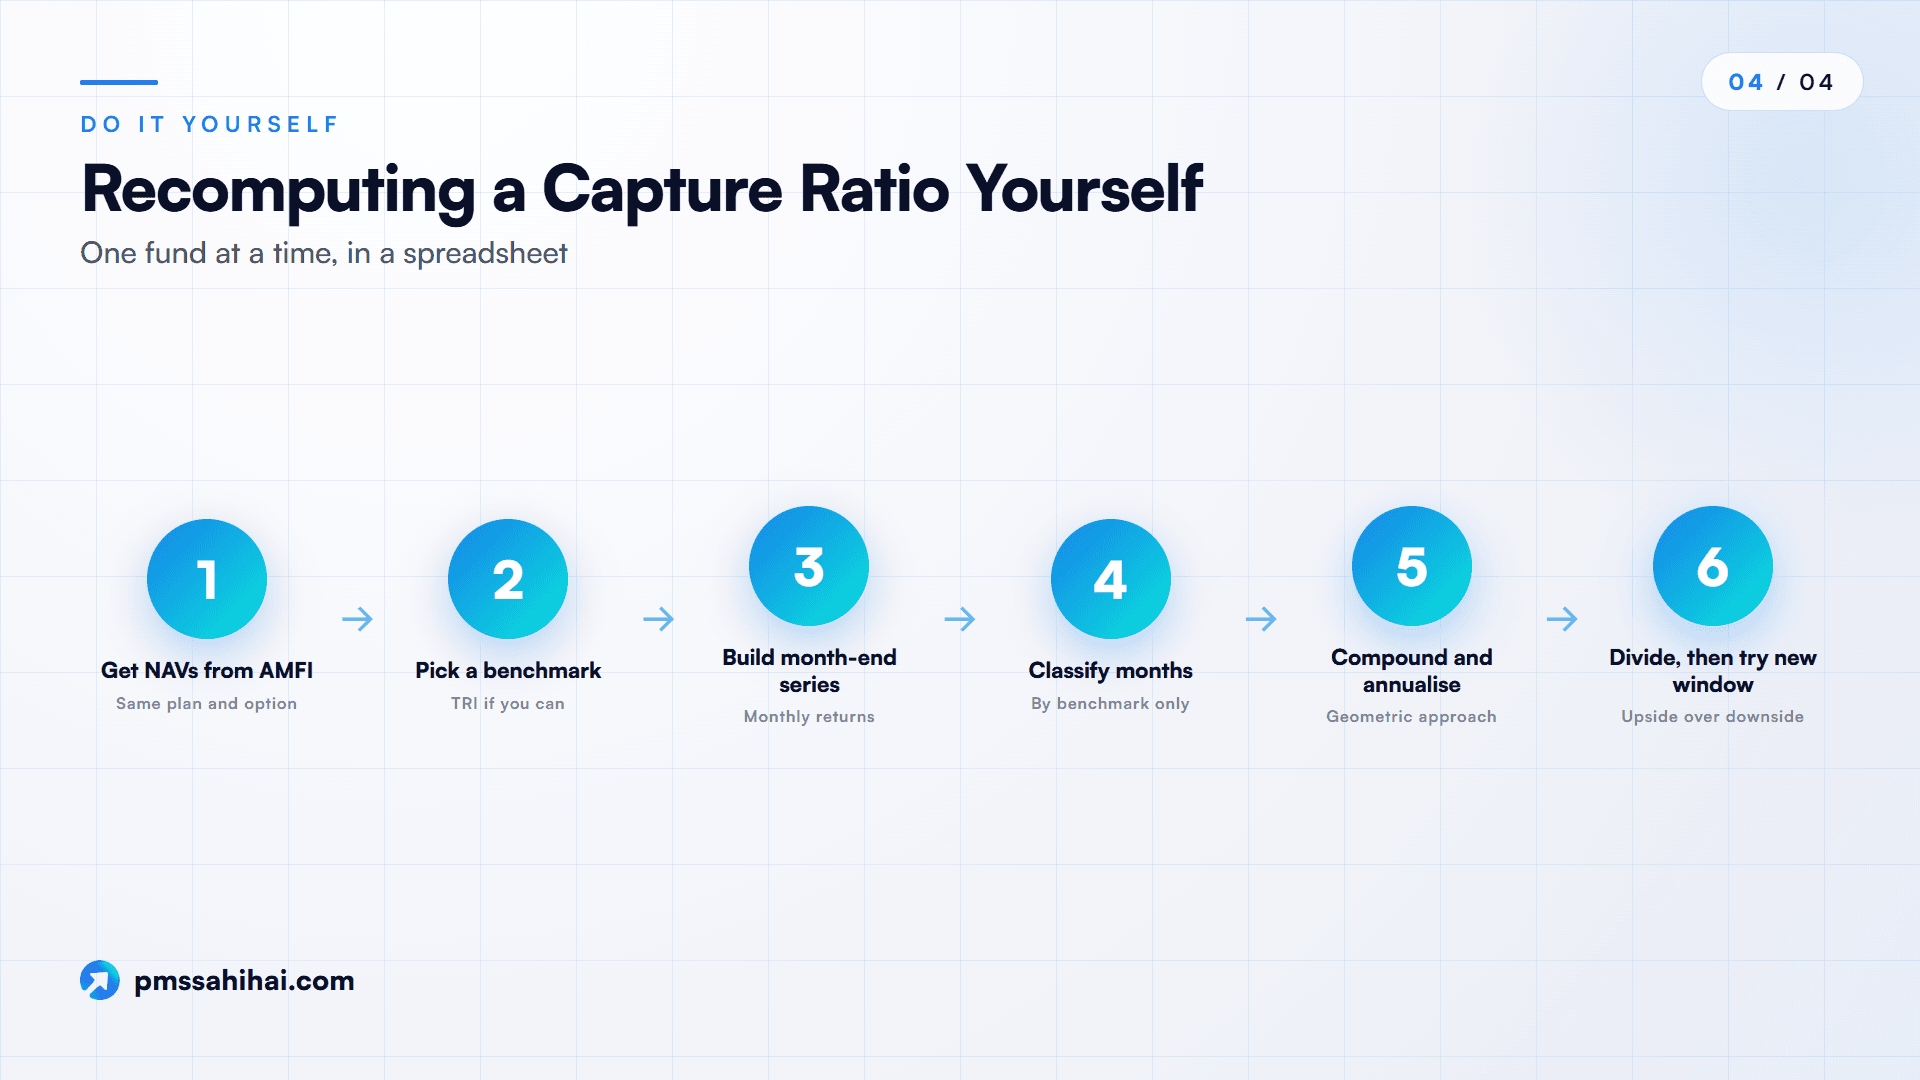
- Get NAVs. Download the scheme's history from AMFI's NAV history tools. Use the same plan and option throughout.
- Pick a benchmark. Use published TRI values if you can get them. If you use an index fund, say so.
- Build month-end series. Take the last NAV on or before each month-end, then compute monthly returns.
- Classify months. Mark each month up or down using only the benchmark.
- Compound and annualise. For each side, multiply (1 + r), raise to (12 / months) and subtract 1. This is the geometric approach, which suits compounding growth better than a simple average.
- Divide. Fund over benchmark for each side, times 100. Then divide upside capture by downside capture.
- Repeat for another window. If the conclusion you drew survives only one window, it is not much of a conclusion.
Then read the scheme's documents. The figures tell you nothing about objectives, risk level, costs or holdings. Those are in the Scheme Information Document and factsheet, and they matter more for any actual decision. A registered adviser can help you assess suitability, which a data table cannot.
What This Data Screen Shows and Does Not Show
It shows that, over the 60 months to 30 September 2026, under one formula and against one proxy, these ten large cap funds had the highest capture ratios among the 27 that qualified.
It does not show that any of them will repeat that result. It does not show that they suit you. It also does not show that they would top a list with a different window: the five-year test ending a year earlier shares just four names.
The useful lesson is more about reading than picking. Ask for the benchmark, the period, the formula and the data source whenever you see a capture ranking. If those four things are missing, you cannot check it. Mutual fund investments are subject to market risks, read all scheme-related documents carefully. Past performance doesn't indicate future returns. PMS Sahi Hai does not list mutual funds, and neither it nor Nyra can tell you which of these schemes, if any, suits you.
Next Steps After Reading This Capture Ratio Screen
If you want to use this data, the next step is checking, not buying. Open the Scheme Information Document and latest factsheet of any scheme you are studying, then recompute the figures for a second window. Speak to a SEBI-registered investment adviser if you need a view on suitability. Mutual fund investments are subject to market risks, read all scheme-related documents carefully.
If your interest is in PMS or AIF strategies, which are a separate matter, you can compare them on PMS Sahi Hai, ask Nyra to explain a term, or contact the team. AMCs pay PMS Sahi Hai distribution fees on those products, and it does not list the mutual funds named above.
PMS Sahi Hai is a distributor of Portfolio Management Services and Alternative Investment Funds, APMI-registered (Registration No. APRN08358). This article is for education only and is not investment advice, a recommendation, or an offer to buy or sell any security. Investments in securities markets are subject to market risks; read all scheme-related documents carefully. Past performance is not indicative of future results. Consult your advisor before investing.
Ishaan founded PMS Sahi Hai to make India's PMS, AIF and GIFT City markets legible to serious investors, comparing every SEBI-registered manager on the same comparative basis, with no shelf products and no commission bias.
Frequently asked
Which mutual fund has the highest capture ratio?
In this screen, Nippon India Large Cap Fund Direct Growth had the highest figure, 1.30, among 27 large cap funds over the 60 months to 30 September 2026, against a Nifty 100 proxy. That answer applies only to this method and window. Over one year to the same date, it ranked 27th of 32. It is a data point, not a recommendation.
How is capture ratio calculated?
Compute monthly returns for a fund and its benchmark, and split months by whether the benchmark rose or fell. Compound and annualise each side. Upside capture is the fund's up-month figure divided by the benchmark's, times 100, and downside capture is the same for down months. Capture ratio here means upside capture divided by downside capture.
What is a good capture ratio in mutual funds?
No regulator sets a pass mark that we found, and a useful reading depends on category, benchmark and period. A ratio above 1 only means upside capture exceeded downside capture in that window. In our screen the median was 1.08. Compare funds within one category, under one method, over several windows, and read the two components as well.
Is a higher capture ratio always better?
Not necessarily. It is a historical description that can hide different profiles. In this screen, two funds shared a 1.19 ratio with very different upside and downside figures, and another ranked fourth with downside capture above 100. A higher ratio also does not address costs, risk level, fund size or suitability, and it does not predict future returns.
Why do capture ratios differ between websites?
Publishers may use different benchmarks, windows, plans and formulas. Morningstar's explainer says it uses the BSE 100 for large cap funds with geometric averaging. Freefincal notes its formula differs from Morningstar's. Our screen uses a Nifty 100 index fund's NAV as a proxy. Check those four inputs before comparing any two published capture figures with each other.
What period should I use for a capture ratio?
No single period is correct. Short windows rest on few months: our one-year test had six up and six down months. Longer windows include more conditions but may reflect older management and mandates. Morningstar India once chose five years for a screen, judging three too short and ten too restrictive. Checking several windows shows how stable a pattern has been.
Can capture ratio predict future returns?
No. It summarises what happened against one benchmark in one period. AMFI's investor material says past performance does not guarantee future performance of any scheme, and mutual fund investments are subject to market risks. In this screen, only four of the top ten names also appeared in the top ten for the five-year window ending one year earlier.
Where can I find capture ratios for a mutual fund?
Morningstar India publishes them, and Ventura's glossary says fund factsheets and Value Research also carry them. You can also compute them from AMFI NAV data, as this article shows. When you find a figure, note its benchmark, period and formula, because numbers from different sources are often not directly comparable with each other.
Keep reading
All articles
How to Read Upside and Downside Capture Ratios in a PMS Factsheet
Read upside and downside capture ratios in a PMS factsheet: the formula, real examples, beta checks, fee effects and five questions for your manager.

What Is Estate Planning? Why Nomination Alone Doesn’t Transfer Wealth
Estate planning in India explained: why a nominee only receives assets, and how a will, trust and joint holding decide who finally owns your wealth.

POA in a Demat Account: What You Signed and What DDPI Changed
What a POA in a demat account lets a broker do, how SEBI's DDPI limits it, why old POAs stay valid until revoked, and how to check and cancel yours.
Read it. Now pressure-test it.
Ask Nyra how this applies to your portfolio, or talk to our team, no pitch, no pressure.