
What Is Alpha Decay? Why Winning PMS Strategies Stop Winning
Alpha decay is when a strategy's excess return fades. Learn the five causes, from AUM growth and crowding to manager change, with a PMS example.


Alpha decay is the gradual shrinking of the excess return a strategy earns over its benchmark. It happens for five main reasons: assets grow faster than the strategy can absorb, other investors copy the same idea, the market regime changes, the manager who built the record leaves, or the portfolio drifts away from the style that earned the alpha. Research from the US and global markets shows each of these forces at work, and Indian PMS investors face the same pressures, especially in small and mid caps. Knowing the causes helps you ask better questions before you commit ₹50 lakh or more, and stops you treating a great three-year record as a promise.
Alpha Decay Explained: When a Winning Edge Starts to Fade
Every PMS pitch deck has the same chart: a line for the strategy climbing well above a line for the benchmark. The gap between those two lines is the manager's alpha, the excess return earned over a suitable index. The uncomfortable question the chart cannot answer is whether that gap will keep widening, or whether it has already started to close.
So, what is alpha decay? In plain terms, alpha decay is the gradual loss of a strategy's ability to produce excess returns over its benchmark. The phrase is borrowed from nuclear physics, where an unstable nucleus loses energy by emitting alpha particles. In investing, the "energy" being lost is the edge. A stock-selection idea, a quantitative signal or a manager's style that once beat the market by five or six percentage points a year beats it by three, then one, then not at all.
The word "gradual" matters. Alpha decay is not a single bad year. It is a trend in which the edge weakens over several periods, usually for a structural reason that a careful investor can name.
Alpha, Briefly, Before It Decays
Alpha is the active return of an investment compared with a suitable market index. In the capital asset pricing model it is the intercept of a regression of the portfolio's returns on the market's, which is why the most common version is called Jensen's alpha. A positive alpha means the portfolio beat what its market exposure alone would have delivered. If you want the full mechanics of alpha and beta with Indian numbers, our existing guide on alpha and beta in PMS covers them; this article starts where that one ends, with the question of why alpha does not last.
One more piece of theory sets the stage. In a perfectly efficient market, the expected value of alpha is zero. Any edge a manager finds is, by definition, a small inefficiency. Inefficiencies attract attention, money and competition. That is the root of nearly every cause of alpha decay that follows.
Decay Versus a Bad Year
A strategy can trail its benchmark for a year without its alpha decaying. Decay is when the excess return keeps shrinking across rolling periods, often while assets keep growing or after a change in people or process. Telling the two apart takes its own toolkit, such as rolling alpha and alpha plotted against AUM; here we focus on why decay happens.
Where the Idea of Alpha Decay Came From
Alpha decay has no single inventor. The idea grew out of six decades of research into whether active managers can beat the market, and why those who do so rarely keep doing it.
From Jensen's Alpha to Efficient Markets
In 1968 Michael Jensen published "The Performance of Mutual Funds in the Period 1945–1964" in the Journal of Finance, giving the industry a widely used measure of risk-adjusted outperformance. Two years later, Eugene Fama's 1970 review formalised the efficient-market hypothesis, the claim that prices reflect available information so consistent risk-adjusted outperformance should be impossible. Between them, these two papers framed the debate: alpha can be measured, but theory says it should not persist.
Berk and Green: Why Success Attracts the Money That Erodes It
The most influential explanation came from Jonathan Berk and Richard Green. Their paper "Mutual Fund Flows and Performance in Rational Markets", circulated as an NBER working paper in October 2002 and published in the Journal of Political Economy in 2004, made a striking argument. Money flows strongly toward funds with good past performance. Because active management has decreasing returns to scale, those inflows push returns down until predictable outperformance disappears.
The key insight is that a lack of performance persistence does not prove managers lack skill. Skilled managers may simply end up running so much money that their edge is spread too thin. In the Berk and Green world, alpha decay is the natural result of success.
McLean and Pontiff: What Happens After an Edge Is Published
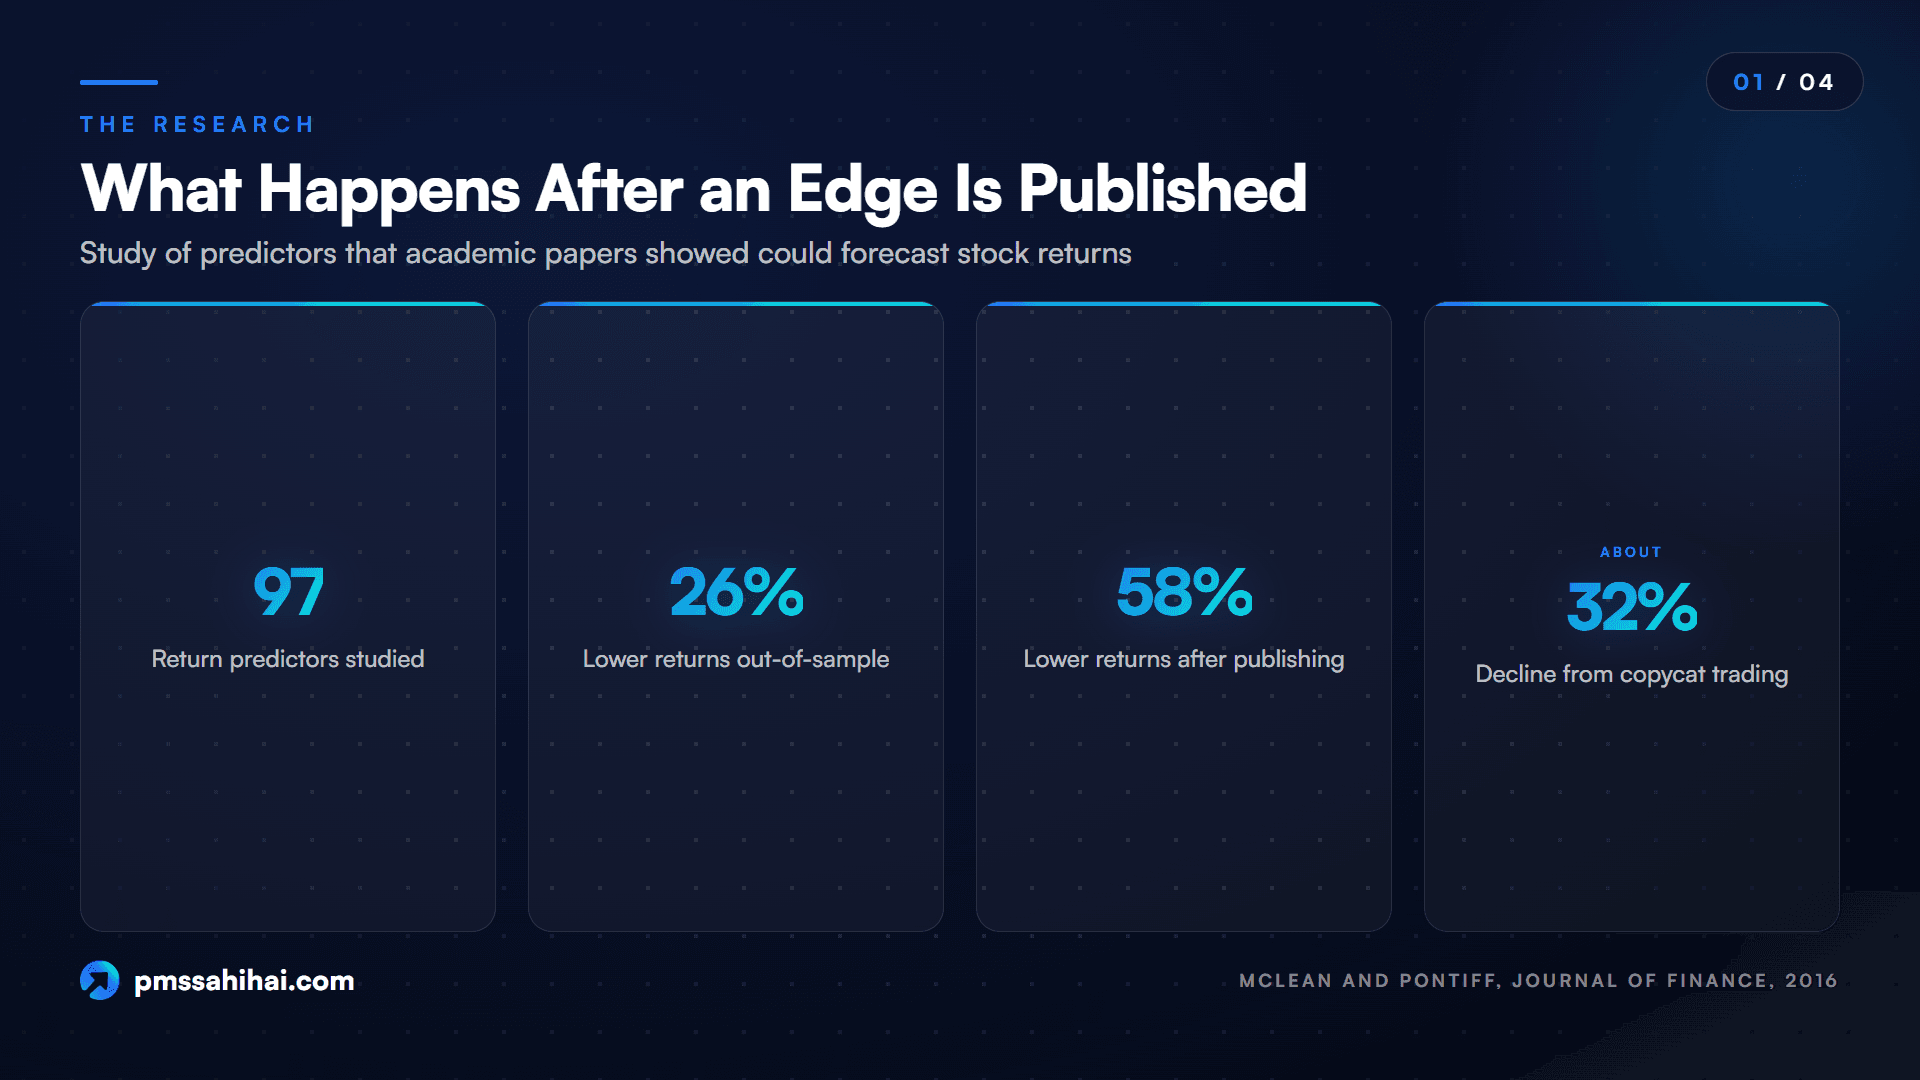
The second major thread came from studies of published stock-return patterns. R. David McLean and Jeffrey Pontiff examined 97 variables that academic papers had shown to predict stock returns. Their paper, "Does Academic Research Destroy Stock Return Predictability?", published in the Journal of Finance in February 2016, found that portfolio returns were 26% lower out-of-sample and 58% lower after publication. The authors estimated that about 32% of the decline came from publication-informed trading: investors read the papers and traded on them. Declines were larger for the predictors with the highest original returns.
That is alpha decay in its cleanest form. An edge that is written down, taught and widely copied does not stay an edge for long.
Cause One: AUM Growth That Outruns Strategy Capacity
The first and most PMS-relevant cause of alpha decay is size. Strategy capacity is the amount of money a strategy can manage before its own trading starts to harm its returns. Every active strategy has a ceiling, and the ceiling is lowest for strategies that buy small, thinly traded companies.
Why Market Impact Grows With Fund Size
When a manager buys a stock, the purchase pushes the price up; when it sells, the sale pushes the price down. This is market impact. It is small when the order is tiny compared with the stock's normal trading volume, and it can reach several percentage points when the order is large relative to turnover. Practitioners often model impact as rising with the square root of the volume traded.
A small fund can build a position in a small company with a few days of quiet buying. A much larger fund needs months for the same percentage position, and its own buying lifts the price before it is done. It pays more on the way in and receives less on the way out, and that cost comes straight out of alpha.
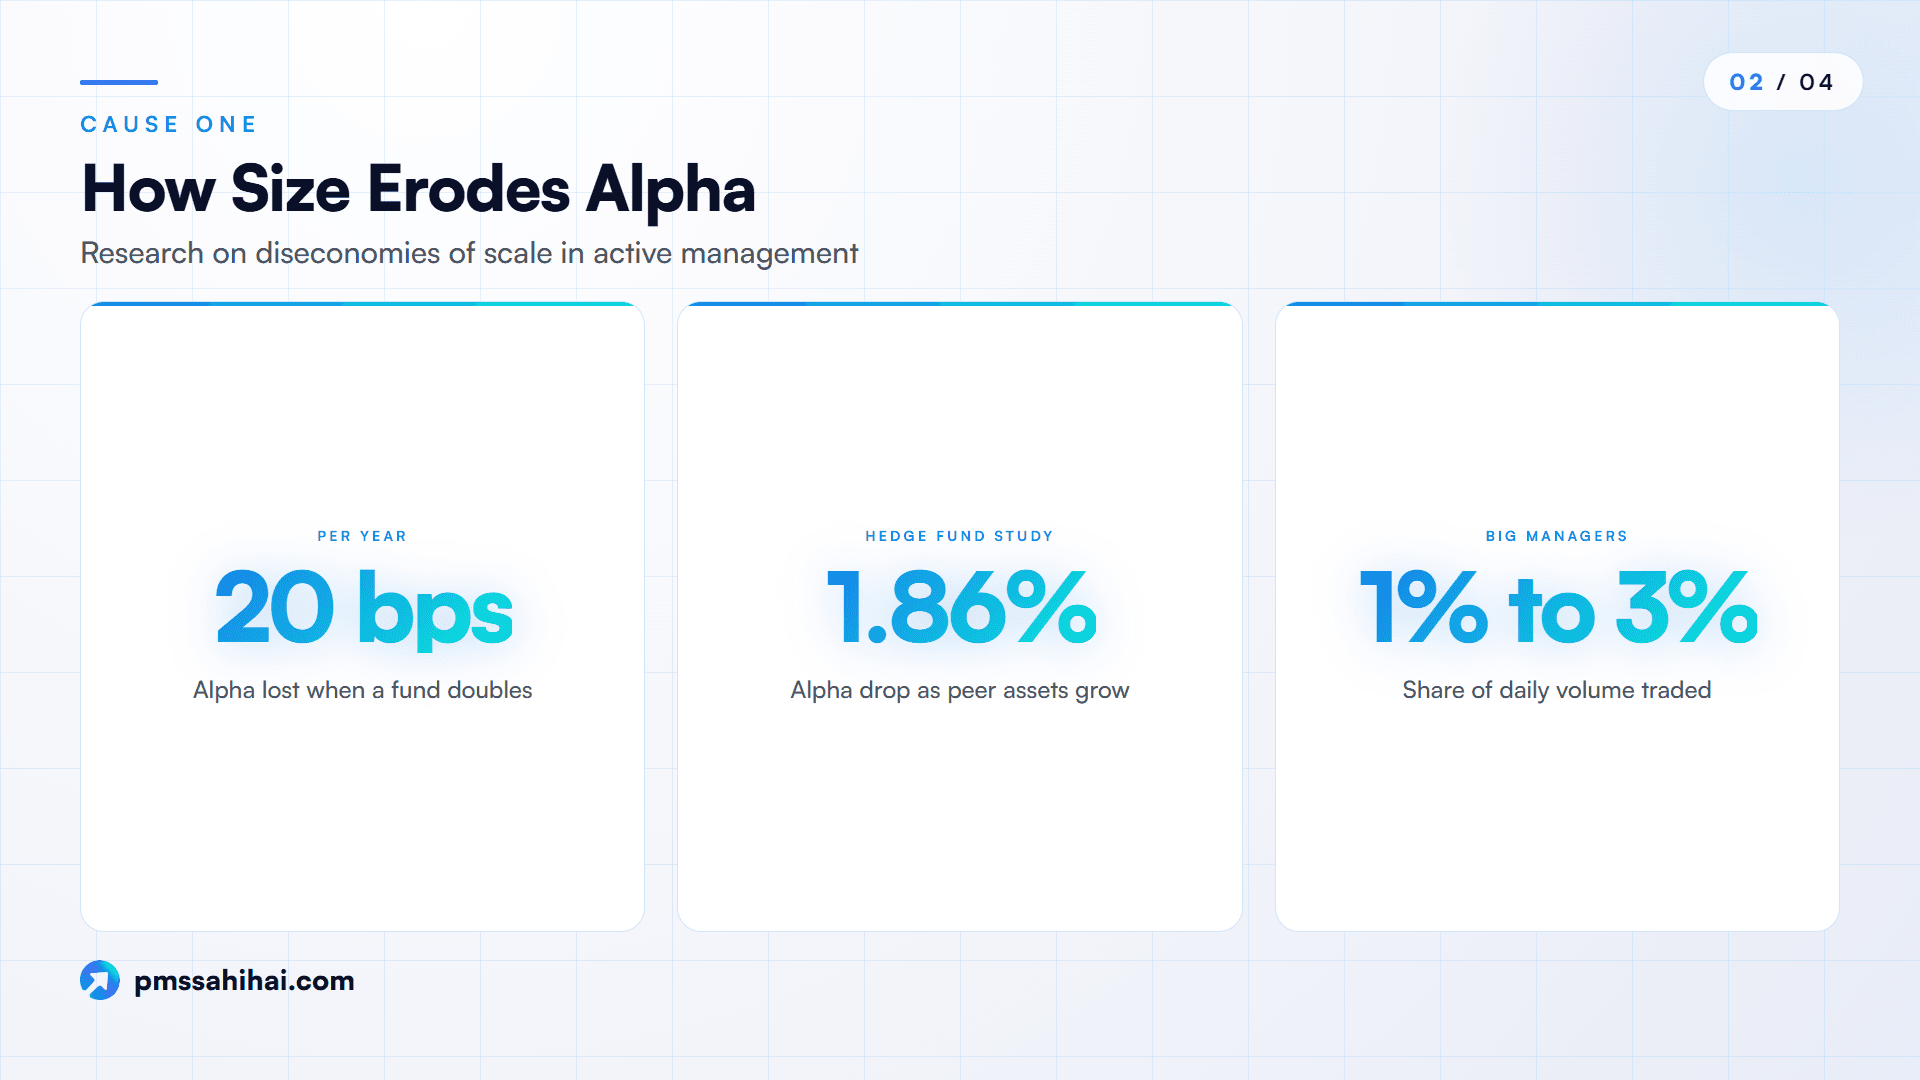
Larger managers face a related problem described by Larry Swedroe in a 2026 Firstlinks column: big managers typically trade only around 1% to 3% of a stock's average daily volume to limit impact, which creates "latency". By the time the portfolio reflects a new idea, part of the opportunity has passed.
What the Research Says About Scale and Skill
Several studies have put numbers on these diseconomies of scale.
- Harvey and Liu, "Does Scale Impact Skill?" Using CRSP data on active US domestic equity funds from 1991 to 2011, Campbell Harvey and Yan Liu found that alpha shrinks as funds grow. As reported by Institutional Investor in July 2017, an average fund that doubled in size relative to the industry over a year saw its alpha fall by about 20 basis points a year.
- Forsberg, Gallagher and Warren (Financial Analysts Journal, 2022). Studying 7,406 hedge funds from 1997 to 2016, the authors found that a one-standard-deviation increase in the assets of a fund's close peers, its cohort, was associated with a 1.86% drop in annualised alpha. The effect was strongest for funds with unique strategies.
The size of the effect varies across studies and asset classes, and it is not the same for every manager. A large-cap strategy that buys the most liquid companies in India can absorb far more money than a micro-cap strategy. But the direction is consistent: beyond a point, more money means less alpha per rupee.
Why This Matters More in a PMS
A PMS holds stocks directly in each client's demat account, so every new client's money must be invested by buying the same stocks in the market. After a strong run, inflows arrive exactly when the holdings are most expensive. Whether the manager limits intake is the firm's decision, which is why AUM growth is one of the first questions to ask.
A Worked Example of Capacity in a Small-Cap PMS
The numbers below are illustrative, not drawn from any real strategy. They show how strategy capacity bites as AUM grows.
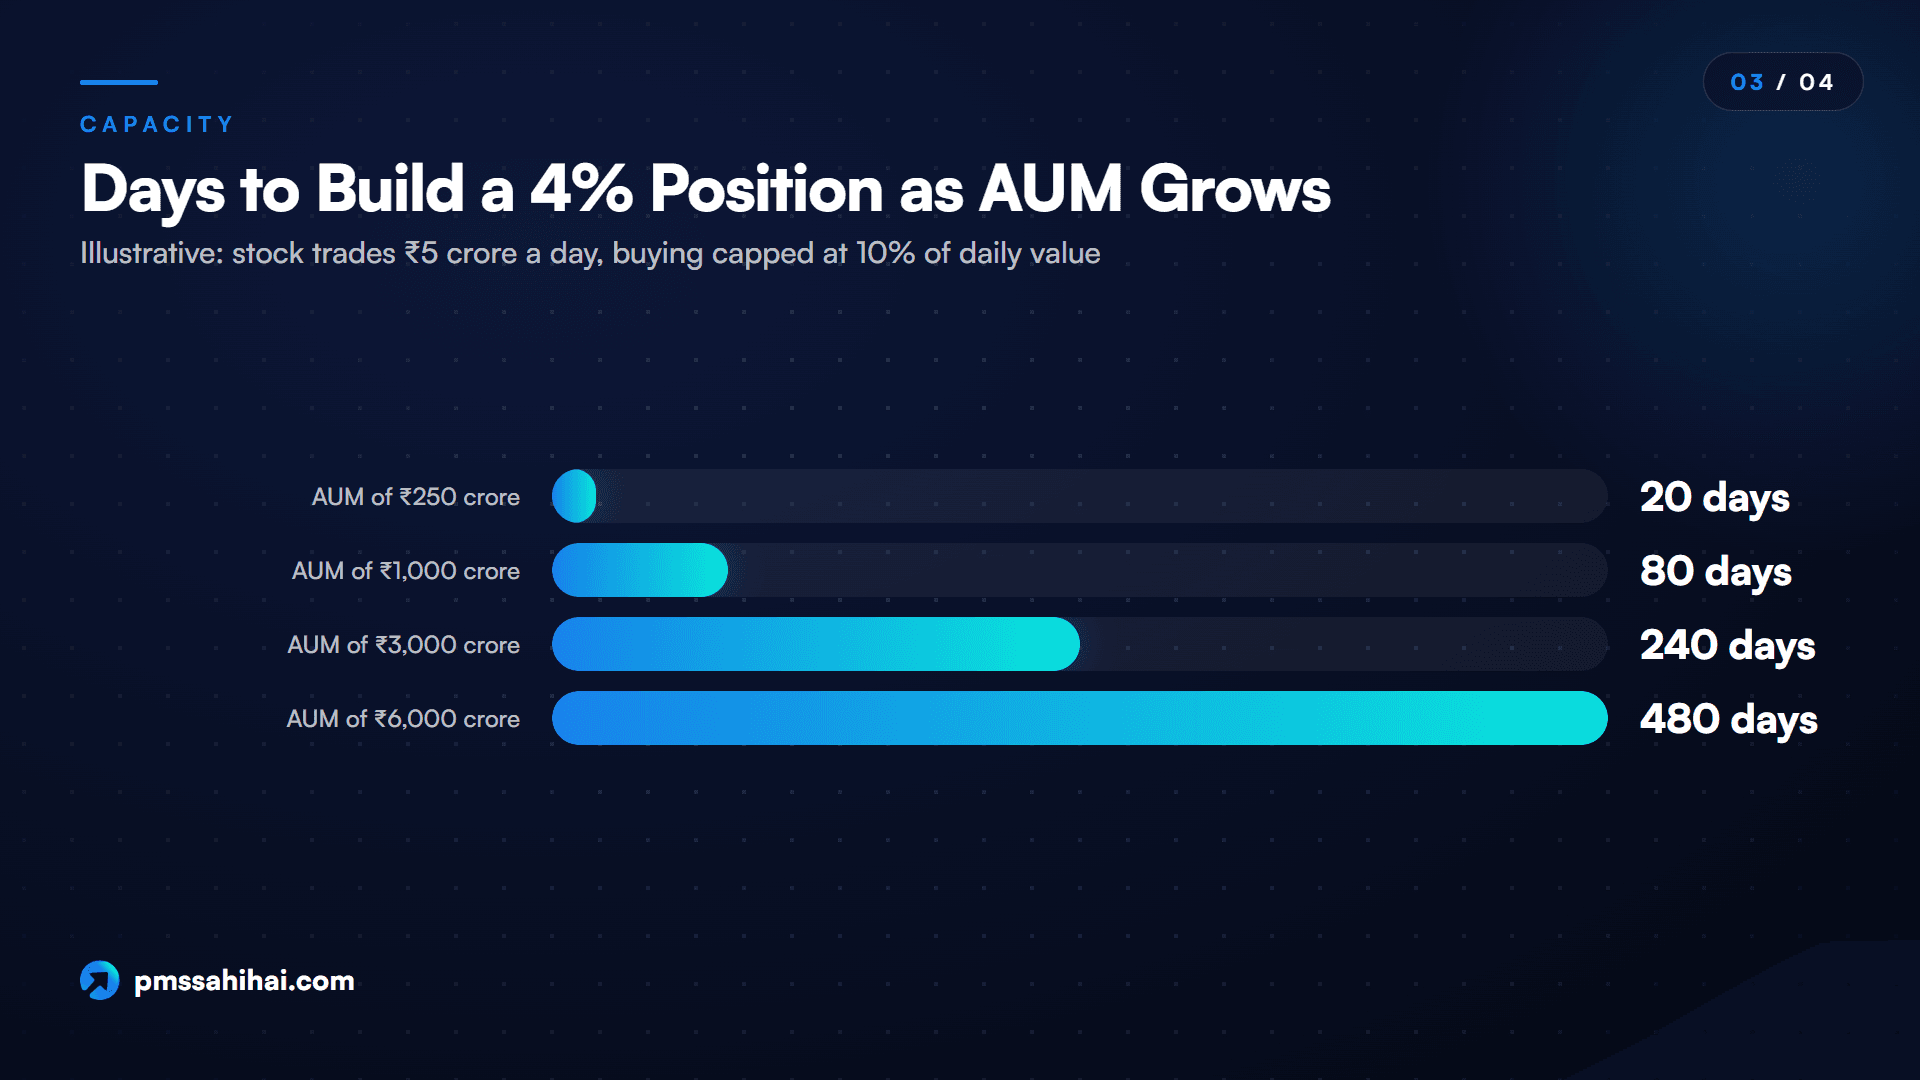
Assume a small-cap PMS wants a 4% position in a company whose shares trade about ₹5 crore a day on average. To avoid moving the price too much, the manager limits its own buying to 10% of each day's traded value, or ₹50 lakh a day.
| Strategy AUM | 4% position size | Trading days to build at ₹50 lakh/day | Roughly |
|---|---|---|---|
| ₹250 crore | ₹10 crore | 20 days | One month |
| ₹1,000 crore | ₹40 crore | 80 days | Four months |
| ₹3,000 crore | ₹120 crore | 240 days | About a year |
| ₹6,000 crore | ₹240 crore | 480 days | About two years |
At ₹250 crore the idea is easy to implement. At ₹6,000 crore the manager has three bad choices:
- Trade faster and accept heavy market impact, paying up on every purchase.
- Take a smaller position, say 0.5% instead of 4%, so the best idea barely moves portfolio returns.
- Move up the market-cap ladder into larger, more widely researched companies where the original edge is weaker.
Each choice dilutes alpha. The third quietly turns a small-cap strategy into something closer to a mid-cap one, an early form of style drift. None of these requires the manager to become less skilled; the arithmetic of size does the damage.
Exiting is the mirror image. In a sharp small-cap sell-off, a large strategy may need weeks to sell a position that a smaller one could exit in days, so falling prices hurt the bigger book more.
Cause Two: Crowded Trades and Copied Ideas
The second cause of alpha decay comes from outside the fund. When many investors chase the same signal, the opportunity shrinks for everyone. Crowded trades also create a hidden risk: when the crowd tries to leave at once, the exit is very narrow.
The McLean and Pontiff findings show the slow version of crowding. Once a profitable pattern is published, investors trade on it, prices adjust earlier, and the remaining excess return falls. Their study also found that after publication, the returns of those strategies became more correlated with other published strategies, a sign that the same pool of money was moving into all of them.
Crowding does not affect every style in the same way. Nick Baltas, writing in the Financial Analysts Journal in 2019, argued that divergence strategies such as momentum are more likely to underperform after crowded periods, while convergence strategies such as value tend to behave differently as investor flows grow. In other words, the type of edge matters: a strategy that profits from trends can be hurt by its own popularity faster than one that profits from prices returning to fair value.
The August 2007 Quant Unwind
The fast version of crowding came in August 2007. Amir Khandani and Andrew Lo of MIT documented that during the week of 6 August 2007, several high-profile and highly successful quantitative long/short equity hedge funds suffered unprecedented losses. Their hypothesis was that the losses began with the rapid unwinding of one or more large quantitative portfolios, possibly because of margin calls or risk reduction. Because many funds held similar positions, the selling hit all of them, triggering further losses on 9 August before a significant rebound on 10 August.
The lesson for an Indian investor is that strategies built on the same screens or the same popular small caps can look diversified on paper while holding the same crowded trades underneath.
Cause Three: Market Regime Change That Breaks a Style
A regime change is a shift in the market environment that changes which strategies work: a move from falling to rising interest rates, from cheap to expensive liquidity, from broad rallies to narrow leadership, or from one dominant sector to another.
A style that thrives in one environment can struggle in the next. The classic example is value investing: value stocks do not always beat growth stocks, as the late 1990s demonstrated. Risk arbitrage, similarly, was unprofitable for a period after 2001 and regained popularity when merger activity picked up.
Regime change is the cause most likely to be mistaken for permanent decay. The edge may be dormant rather than gone; in 2004 Andrew Lo's adaptive market hypothesis described markets as an ecosystem in which edges fade and return as conditions change. An April 2026 Firstlinks column summarising research by Berkin and Wang went further, arguing that some apparent decay in factor alpha comes from measuring factors poorly rather than from the edge vanishing. New academic work in 2026, including a paper by Nolan Alexander and Frank Fabozzi on "strategy-decay risk", proposes judging strategies by their worst performance across distinct historical regimes, because a high long-run Sharpe ratio does not guarantee resilience when conditions shift.
For PMS investors the practical point is that a strategy's best years often coincide with a regime that suited it. When a manager's record was built almost entirely in one kind of market, ask how the process held up, or would hold up, in a different one.
Causes Four and Five: Manager Change and Style Drift
The last two causes are internal to the firm, and they are the ones Indian PMS investors can most often spot early.
When the Person Behind the Record Leaves
A PMS track record belongs to an investment approach, but the alpha was produced by people. When the lead fund manager, the chief investment officer or a key analyst team leaves, the record stays with the strategy while the skill that created it may walk out of the door. The new team may be capable, but its alpha has to be earned again; it cannot be inherited.
SEBI's rules treat some of these changes as material. Under paragraph 4.1.1 of the SEBI Master Circular for Portfolio Managers dated 16 July 2025, a material change in the disclosure document includes a change in control of the portfolio manager, the Principal Officer, the fees and charges, and the investment approaches offered. These rules apply under the SEBI (Portfolio Managers) Regulations, 2020 until the 2026 Regulations take effect on 1 April 2027, so re-check the details after that date. Not every change of an individual fund manager is a change of Principal Officer, so investors should also ask directly who makes the buy and sell decisions today, and since when.
When the Portfolio Stops Matching the Label
Style drift happens when a fund's actual investment style no longer matches the style it declares. In the size example above, drift was a side-effect of growth: the small-cap manager drifted toward mid caps to keep deploying money. Drift can also come from chasing a hot theme, raising cash during a rally, or concentrating in a sector outside the stated mandate.
Research on style drift links it to agency problems and higher trading costs, and a 2020 study by Chua and Tam found that managers who drift tend to have weaker stock-picking ability. Drift matters for alpha decay because the alpha in the track record was earned by the original style. If the portfolio now looks like something else, the old alpha no longer describes it.
SEBI has addressed part of this. Each PMS investment approach must be tagged to one strategy and one benchmark, and under paragraph 4.6A.5 of the Master Circular the tag can be changed only after offering investors an exit without exit load, with the earlier track record no longer usable for performance reporting. Paragraph 4.5.3.3 requires managers to disclose clearly any change in investment approach that may affect client performance in marketing material. These rules catch formal changes. Gradual drift inside an unchanged label still needs an investor's eye, which our earlier guide to manager tenure and style drift covers in more depth.
The Five Causes at a Glance
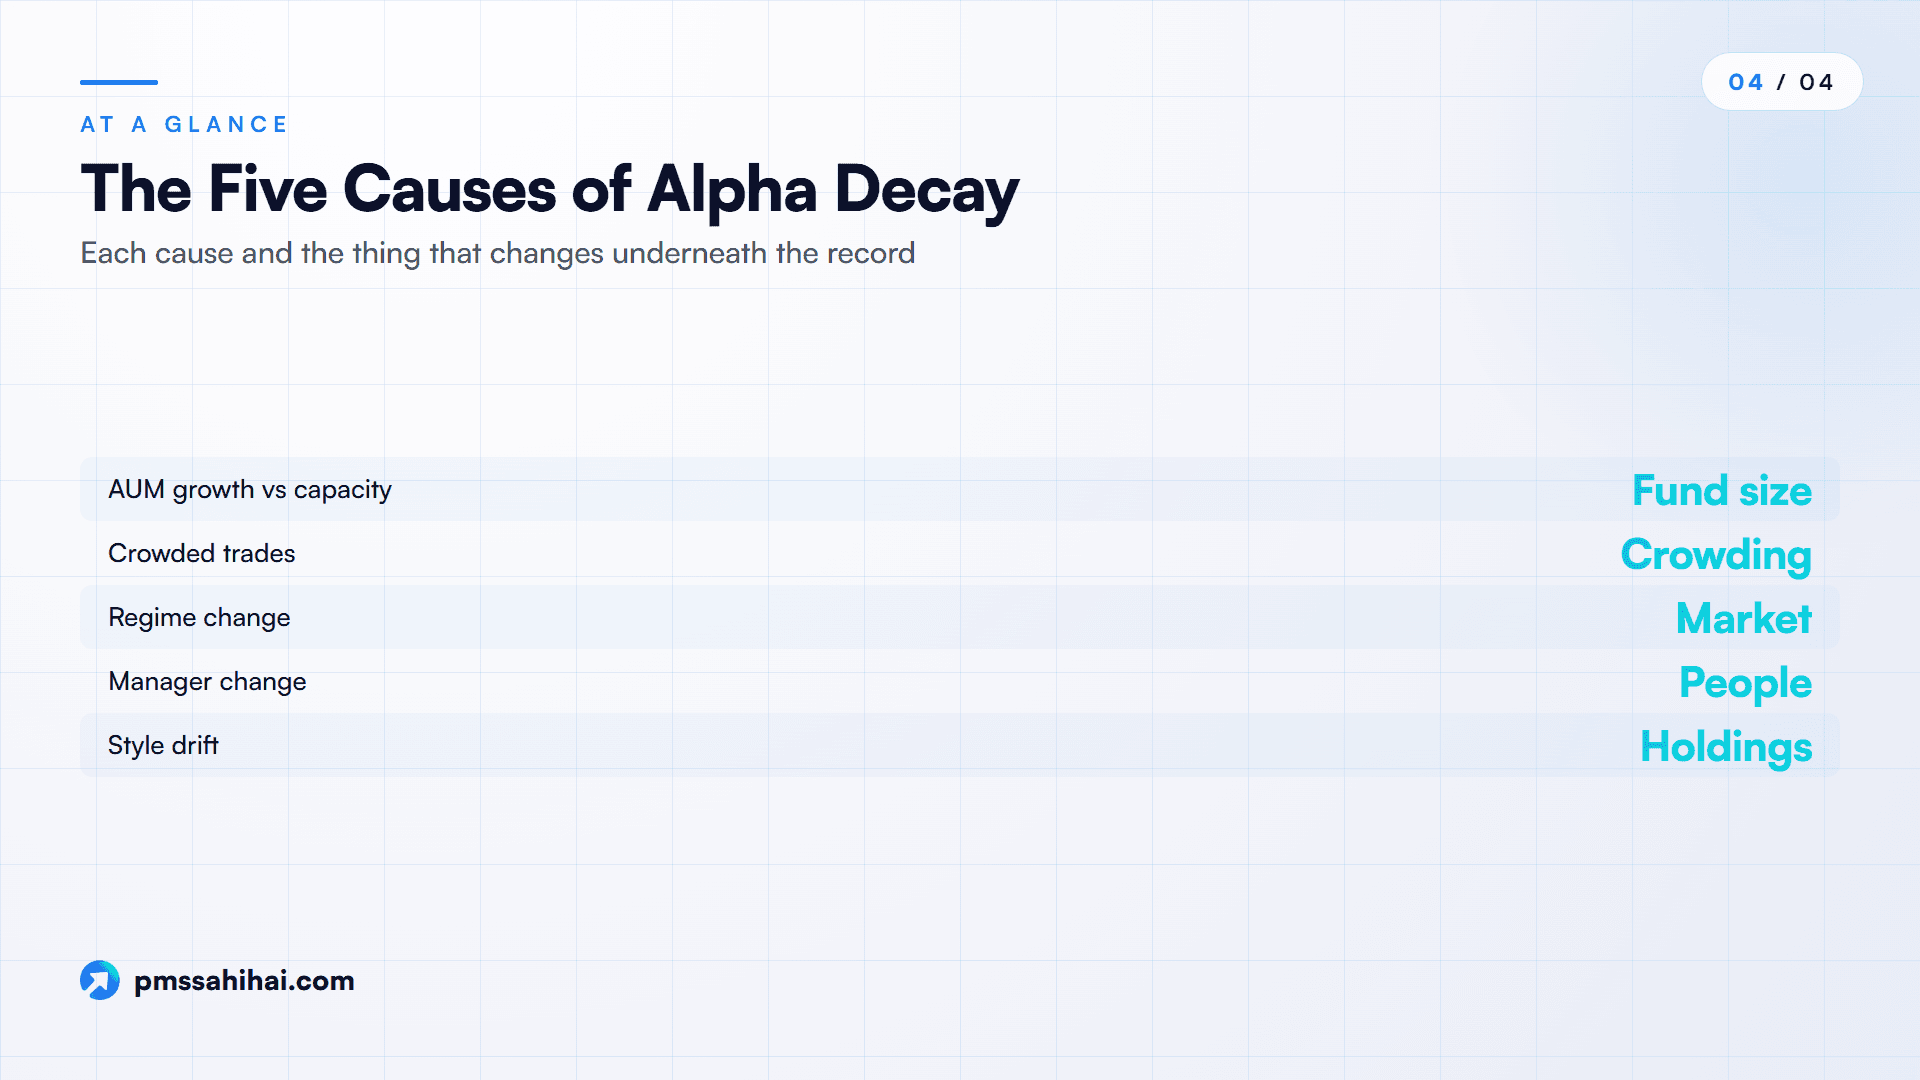
| Cause | What changes | Typical warning sign | Most exposed strategies |
|---|---|---|---|
| AUM growth vs strategy capacity | Fund size relative to stock liquidity | Rapid AUM growth after a strong run | Small-cap, micro-cap, concentrated |
| Crowded trades | Number of investors chasing the same idea | Same stocks across many "top" strategies | Popular themes, factor and quant screens |
| Regime change | Market environment | Record built in one kind of market | Single-style, single-factor strategies |
| Manager change | The people making decisions | Departure of lead manager or team | Star-manager-led boutiques |
| Style drift | What the portfolio actually holds | Holdings no longer match the label | Strategies under inflow pressure |
How Alpha Decay Plays Out in Today's Data-Driven Markets
Technology has sped up every cause of alpha decay. Data reaches thousands of investors in seconds. In quantitative trading, decay is often measured as a signal's half-life: how quickly the expected return of a signal shrinks as the market absorbs it. Short half-lives demand fast execution; slow-decaying signals allow patient trading.
Three trends stand out:
- Ideas spread faster. Academic papers, screener tools and smart-beta products turn yesterday's edge into a widely available product. That is the McLean and Pontiff effect at industrial scale.
- More money tracks the same factors. Factor and quant strategies, including the rule-based PMS products that have grown in India, can end up holding similar stocks for similar reasons, which raises crowding risk.
- Measurement has improved. Investors can now compare a strategy's alpha across periods far more easily than a decade ago.
That last trend is especially relevant in India. Since 1 April 2023, under SEBI's circular of 16 December 2022 on performance benchmarking and reporting by portfolio managers, a manager must show the time-weighted rate of return of an investment approach alongside the trailing return of its selected benchmark whenever it communicates performance (Master Circular paragraph 5.6.1). Each approach is tagged to one strategy (Equity, Debt, Hybrid or Multi Asset) and one benchmark chosen from up to three that APMI prescribes. Standardised, benchmark-relative reporting is what makes alpha decay visible: you can line up the same strategy's excess return year after year against the same yardstick.
Why Understanding Alpha Decay Makes PMS Decisions Easier
Knowing why alpha fades turns a performance table from a promise into a set of questions. The practical benefits are real.
- It resets expectations. Berk and Green's work explains why the top performer of the last three years is a weak guide to the next three. Performance persistence is rarer than marketing suggests, so you stop paying for past returns alone.
- It gives you specific questions for the manager. How large is the strategy today versus three years ago? What does the manager think its strategy capacity is? Has the firm ever soft-closed a strategy or capped inflows?
- It separates a bad year from a broken process. If the shortfall coincides with a regime that hurts the whole style, it may be temporary. If it coincides with rapid AUM growth, a team exit or a change in holdings, it may be structural.
- It flags disclosure events. Material changes to the Principal Officer, fees or investment approach, and any re-tagging of strategy or benchmark, are signals to review your holding, not paperwork to ignore.
- It improves diversification. Because regimes rotate, combining strategies whose edges come from different sources reduces the risk that all your alpha decays at once.
For an investor writing a cheque of ₹50 lakh or more, the minimum PMS investment under SEBI rules, these questions are cheap insurance.
How PMS Sahi Hai Helps You Read the Inner Clause of Alpha Decay
Spotting alpha decay starts with putting the right numbers side by side, and that is where PMS Sahi Hai is built to help. Its PMS comparison listings let you filter strategies by category, benchmark, AUM size and style, and shortlist up to four for a side-by-side view.
Each strategy page then lays out the evidence the five causes point to:
- Size: the strategy's AUM sits next to its 3-year, 5-year and since-inception returns, so you can ask whether a strategy that has grown fast still has room in its stocks. The page does not show the date of the AUM figure, so confirm it with the manager.
- Fading excess return: trailing returns from one month to since inception are shown against the benchmark with alpha, which makes it easy to see whether recent alpha is smaller than the long-run figure.
- Consistency: a reliability panel shows the share of rolling 1-year and 3-year windows in which the strategy beat its index, a better guide than one start date.
- People: the manager section names the fund manager and shows their tenure on the strategy and the AUM they manage.
- Style: the portfolio section shows the market-cap mix and concentration, so a small-cap label holding a growing slice of larger companies stands out.
Nyra, PMS Sahi Hai's AI research analyst, adds a second layer. The Nyra Score methodology gives 15% weight to consistency, meaning how often a strategy beat its benchmark across horizons and how stable that outperformance was, and includes asset base in its Structure and Stewardship pillar. Strategies with less than 12 months of record are "Not Rated". The methodology page does not mention manager changes or style drift, and Nyra does not label anything "alpha decay", so treat the score as a starting point rather than a verdict. You can also ask Nyra to review a portfolio for overlap, drift and fee drag, or use the portfolio scan, which reviews returns, risk, manager tenure and fees for the strategies you already hold. Nyra describes itself as an analytical tool, not a SEBI-registered investment adviser.
For the underlying maths, see our guide to alpha and beta in PMS.
Honest Limits of the Alpha Decay Lens
Alpha decay is a useful idea, but it has clear limits.
- Short records make decay hard to prove. Many PMS strategies have three to five years of history. Over such short periods, the difference between noise, a regime effect and true decay is often statistically unclear.
- Most evidence is not Indian. The best studies on scale, crowding and publication effects use US mutual funds, global hedge funds or published US factors. Indian PMS-level research on capacity is scarce, so apply the findings as direction, not as precise numbers.
- The size of effects varies. A doubling of AUM costs a liquid large-cap strategy far less than a micro-cap one. A 20-basis-point estimate from one study does not transfer neatly to a concentrated small-cap PMS.
- Decay can reverse. Under the adaptive market view, a dormant edge may return when the regime changes. Exiting on the first sign of fading can lock in the worst period.
- Some decay is measurement. Choice of benchmark, time window and risk model can make alpha appear or vanish. A strategy compared with the wrong index can look like it is decaying when it is simply being measured against the wrong thing.
What Alpha Decay Means for Your Next PMS Review
Alpha decay is not a scandal or a sign of a bad manager. It is the normal life cycle of an investment edge: discovered, exploited, copied, scaled and eventually diluted.
For an Indian PMS investor, the five causes of alpha decay give a practical checklist. Ask how fast AUM has grown and whether the manager has a view on capacity. Check whether the strategy holds the same crowded stocks as its peers. Ask what kind of market built the record. Confirm who makes the decisions today. Compare current holdings with the stated style. None of these questions requires complex maths, and each one tells you more about future alpha than the size of the past return. PMS Sahi Hai's strategy pages and Nyra put most of the answers, from AUM and manager tenure to rolling consistency, on one screen.
Ready to Check Whether Your PMS Edge Is Still Alive?
A winning record is where your research starts, not where it ends. Before you invest, or the next time you review a strategy you already hold, ask the five questions behind alpha decay: size, crowding, regime, people and style. Compare the strategy's excess return over several periods against the same benchmark, and look closely at what has changed since its best years.
PMS Sahi Hai makes that check practical. Compare PMS strategies on AUM, alpha and rolling consistency, ask Nyra to review your current holdings for drift and overlap, or book a consultation to talk through a strategy you are considering.
PMS Sahi Hai is a distributor of Portfolio Management Services and Alternative Investment Funds, APMI-registered (Registration No. APRN08358). This article is for education only and is not investment advice, a recommendation, or an offer to buy or sell any security. Investments in securities markets are subject to market risks; read all scheme-related documents carefully. Past performance is not indicative of future results. Consult your advisor before investing.
Ishaan founded PMS Sahi Hai to make India's PMS, AIF and GIFT City markets legible to serious investors, comparing every SEBI-registered manager on the same comparative basis, with no shelf products and no commission bias.
Frequently asked
What is alpha decay in simple terms?
Alpha decay is the gradual shrinking of the extra return a strategy earns over its benchmark. A strategy that once beat its index by five percentage points a year might beat it by two, then by nothing. It usually happens because of a structural reason, such as too much money, copied ideas, a changed market, a departed manager or a drift in style, rather than one unlucky year.
Why does alpha decay over time?
Alpha is a small market inefficiency, and inefficiencies attract money and competitors. Success brings inflows, and larger funds pay more in market impact. Other investors copy profitable ideas, so prices adjust sooner. Markets also change regime, managers move on, and portfolios drift from their original style. Each of these forces chips away at the edge that produced the original excess return.
Does a bigger PMS always earn lower returns?
Not always, but beyond a certain size more money usually means less alpha per rupee. Studies of US mutual funds and global hedge funds find that alpha tends to fall as funds and their close peers grow. The effect is strongest for strategies that buy small, thinly traded stocks.
What is strategy capacity in a PMS?
Strategy capacity is the maximum amount of money a strategy can manage before its own buying and selling starts to hurt returns. It depends on how liquid the stocks are, how concentrated the portfolio is and how quickly the manager trades. Small-cap and concentrated strategies have the lowest capacity, which is why some managers stop accepting new money after a point.
Is style drift the same as alpha decay?
No, but one often causes the other. Style drift means the portfolio no longer matches the style it claims, for example a small-cap strategy that now holds mostly mid caps. Alpha decay is the fall in excess return. Drift can lead to decay because the alpha in the track record was earned by the original style, not the new one.
Can alpha come back after it decays?
Sometimes. If the cause was a regime change, the edge may return when conditions change again, much as risk arbitrage regained popularity once merger activity picked up after a lean period in the early 2000s. If the cause was structural, such as a strategy that is now far larger than its capacity or a departed manager, the original alpha is much less likely to return without a change in the strategy itself.
Should I exit a PMS if its alpha is falling?
Not automatically. First identify the likely cause. A shortfall shared by the whole style during an unfavourable market may be temporary. A slide that coincides with rapid AUM growth, a team departure or a visible change in holdings is more worrying. Weigh exit loads and capital gains tax before switching, and consult a qualified adviser for a decision about your own portfolio.
Keep reading
All articles
SIF Taxation: Is a Specialised Investment Fund Taxed Like a Mutual Fund?
SIF taxation under the Income-tax Act 2025: equity, hybrid and debt SIF rules, 12 vs 24-month clocks, and TDS for NRIs.
What Is an ETF-Based PMS? Passive Building Blocks, Active Allocation
What an ETF-based PMS is, its two cost layers, ETF liquidity and tax on every switch, PRIM from April 2027, and how it compares with DIY ETFs.
Passive vs Active Management: Mutual Funds, ETFs and PMS Compared
Passive vs active management in India: 2026 cost caps, SPIVA evidence, tracking error, and when index funds, active funds or PMS fit.
Read it. Now pressure-test it.
Ask Nyra how this applies to your portfolio, or talk to our team, no pitch, no pressure.