
Equity vs Hybrid Long-Short SIFs: 24 Funds, NAVs and Fees Compared
All 24 equity and hybrid long-short SIFs compared on AMFI data to 26 Oct 2026: NAV since launch, drawdowns, holdings, fees and minimums.

As of 26 October 2026, AMFI lists 13 equity long-short SIF strategies and 11 hybrid long-short SIF strategies with published NAVs. Measured on AMFI's own NAV history, the median equity long-short SIF is down 0.64% since launch with a median maximum drawdown of 7.68%, while the median hybrid long-short SIF is up 2.51% with a median drawdown of 2.41%. Hybrids also cost less: their median direct-plan expense ratio in September 2026 was 1.25%, against 2.34% for equity long-short. The averages hide wide gaps between funds, so this guide lists every strategy, what it holds, what it has returned, what it charges and how to choose between the two categories.
Why Fund-Level Data Beats Category Labels for SIF Investors
Most articles on equity vs hybrid long-short SIFs compare rulebooks. An investor with ₹10 lakh faces a narrower question: which of the 24 live strategies has done what with its money, and at what cost?
The answer sits in public data. Every Specialised Investment Fund (SIF) publishes a daily NAV, a daily expense ratio and a portfolio every alternate month, and AMFI hosts all of it. We found no ranking page that puts it in one place on one date.
This guide does. All NAVs are direct-plan growth options from AMFI's NAV history on 26 October 2026, with returns measured from the ₹10 face value (₹1,000 for two funds). Expense ratios average AMFI's daily disclosures for September 2026. Nothing here ranks long-short SIFs for purchase.
One warning: the oldest strategy has just over a year of NAVs, and 13 of the 24 have less than six months. Treat every return figure as an early reading, not a track record.
Equity vs Hybrid Long-Short SIFs: The Rules in One Short Recap
A separate post in this series compares the two rulebooks in detail. Here is the one-paragraph version you need to read the data.
SEBI's SIF framework of 27 February 2025 sets the boundaries. An equity long-short SIF must keep at least 80% in equity and equity-related instruments and may take up to 25% of net assets in unhedged short positions through derivatives; it may redeem as often as daily. A hybrid long-short SIF must keep at least 25% in equity and at least 25% in debt, may also short up to 25%, and is an interval strategy that redeems at most twice a week. Both need a minimum of ₹10 lakh per investor across all strategies of one SIF, measured at PAN level, though the minimum does not apply to accredited investors. Tax depends on how much listed equity a strategy actually holds, so check each fund's stated treatment and consult a tax adviser before investing.
How Long-Short SIFs Grew to 24 Live Strategies in One Year
Long-short investing is old; Alfred Winslow Jones is usually credited with the first hedged fund in 1949. What is new is a mutual-fund-style Indian wrapper with a ₹10 lakh ticket. The timeline uses AMFI NAV records.
| Date | Milestone |
|---|---|
| 27 Feb 2025 | SEBI issues the SIF framework, effective 1 April 2025 |
| 8 Oct 2025 | qsif Equity Long-Short Fund publishes the first SIF NAV |
| 20–29 Oct 2025 | First three hybrid long-short NAVs: qsif, Altiva, Magnum |
| Dec 2025–Mar 2026 | Diviniti, Titanium Hybrid, Arudha (both), iSIF Hybrid, DynaSIF and Apex Hybrid follow |
| Apr–Jul 2026 | Sapphire, WSIF, Titanium, Arthaya, iSIF, Platinum, RedHex, Infinity, Prism and Summit start NAVs |
| 30 Sep 2026 | AMFI counts 12 equity long-short and 11 hybrid long-short strategies |
| 1 Sep–26 Oct 2026 | Apex, Altiva and MSIF equity long-short strategies publish first NAVs |
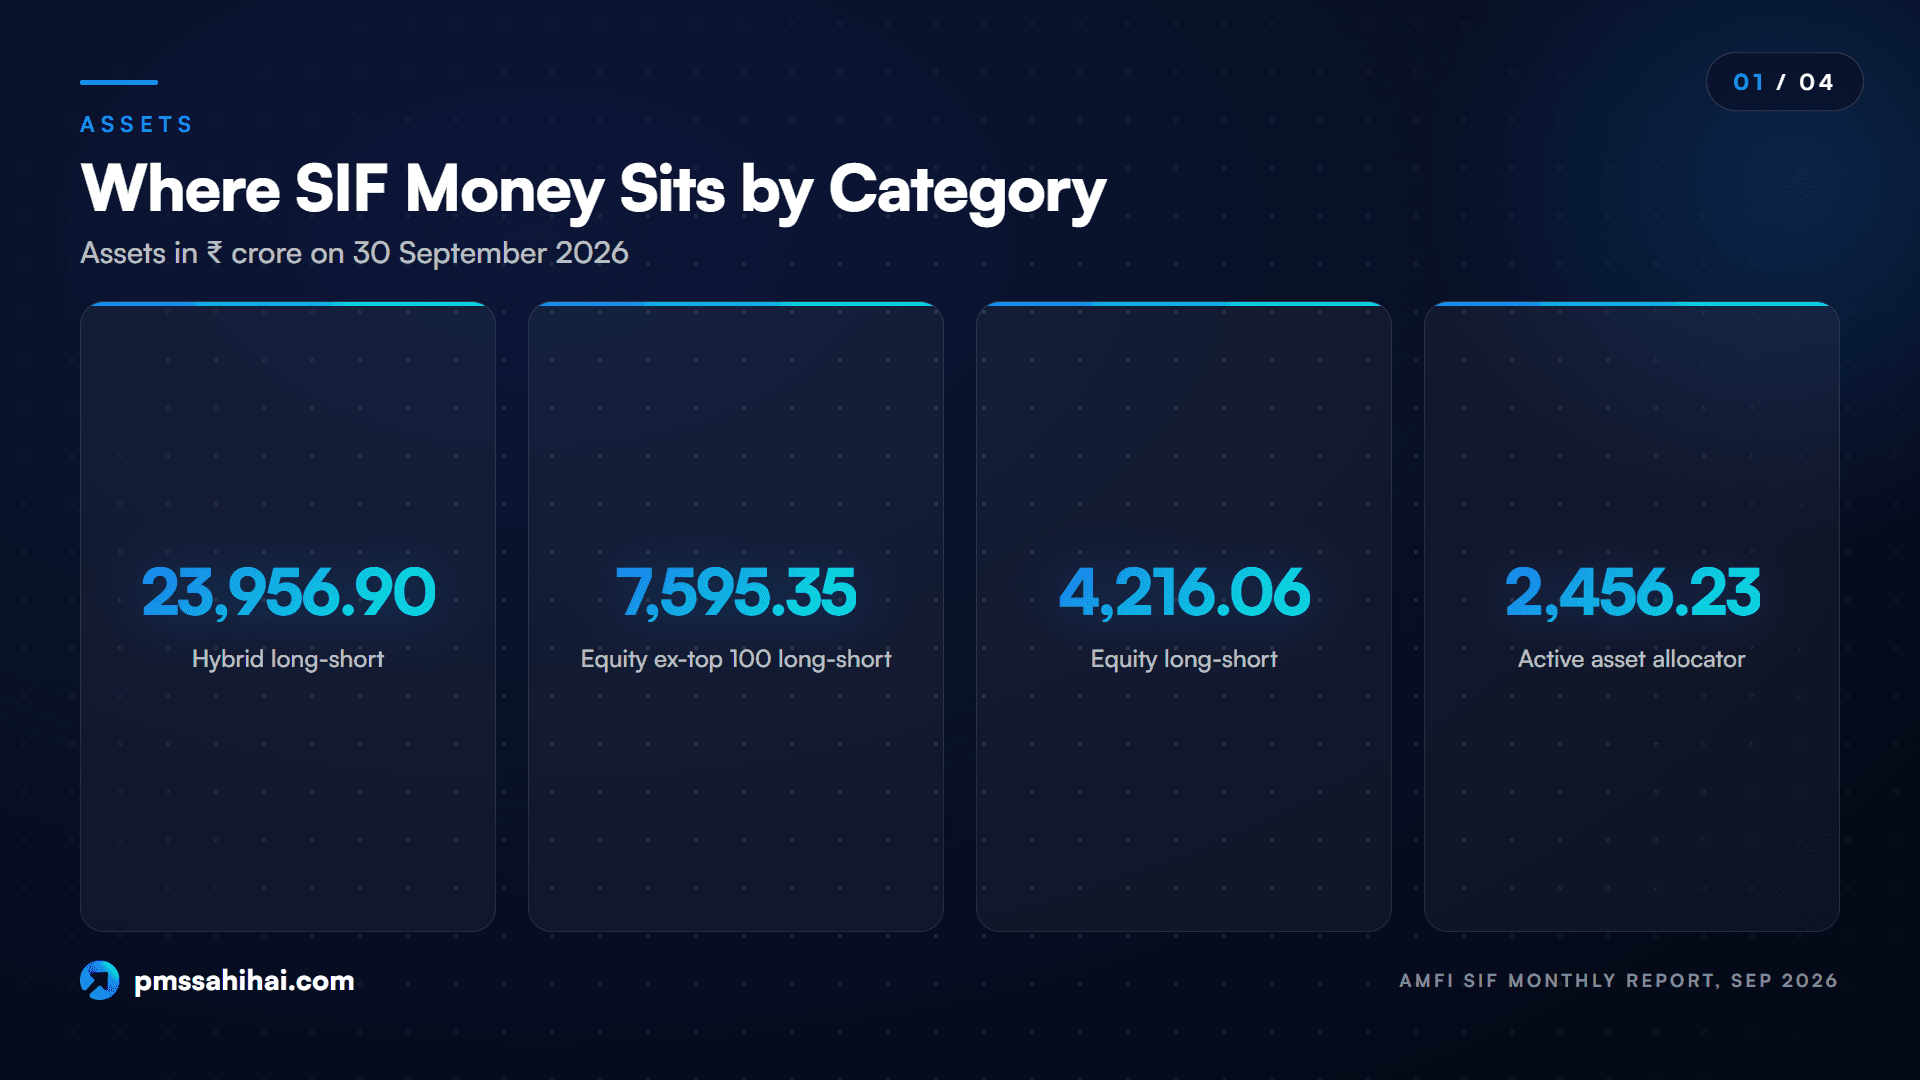
The money has gone mostly one way. On 30 September 2026, AMFI's SIF monthly report showed ₹23,956.90 crore in hybrid long-short strategies across 58,178 folios, against ₹4,216.06 crore in equity long-short across 29,856 folios. Hybrid long-short alone held about 63% of the industry's ₹38,286.94 crore. In September, hybrid long-short drew net inflows of ₹4,486.12 crore; equity long-short drew ₹895.21 crore.
Two sister categories sit outside this comparison of equity vs hybrid long-short SIFs: Equity Ex-Top 100 Long-Short (7 strategies, ₹7,595.35 crore) and Active Asset Allocator Long-Short (3 strategies, ₹2,456.23 crore).
Reading SIF Data: Where AMFI Publishes NAVs, Fees and Portfolios
Long-short SIFs are among the most transparent products an Indian HNI can buy.
- Daily NAVs. AMFI's SIF NAV page carries every plan's latest NAV, and its NAV history tool returns the full daily series for any plan since launch.
- Daily expense ratios. AMFI's TER page for SIFs reports each plan's expense ratio every day, split into four parts. Under Regulation 67 of the SEBI (Mutual Funds) Regulations, 2026, as AMC offer documents describe it, total expenses are the base expense ratio (BER) plus brokerage, transaction costs and statutory levies. The BER covers management and running costs. The other three rise and fall with trading.
- Portfolios. SEBI requires every SIF to publish its full portfolio, including derivatives, as of the end of every alternate month (May, July, September, November, January and March), in a downloadable spreadsheet on the AMC and AMFI websites within 10 days.
- Factsheets. Some fund houses now publish daily long, short and net exposure and portfolio beta; quant's qsif factsheet is the most detailed so far.
Every Equity Long-Short SIF Launched So Far
Thirteen equity long-short SIF strategies had NAVs on 26 October 2026. They are listed by first NAV date, not by merit; launch dates, minimums and exit loads are on AMFI's SIF scheme-details page.
| Strategy | Fund house | First NAV | Direct NAV, 26 Oct 2026 |
|---|---|---|---|
| qsif Equity Long-Short Fund | quant | 8 Oct 2025 | 10.8041 |
| Diviniti Equity Long Short Fund | ITI | 3 Dec 2025 | 866.3764 (face value ₹1,000) |
| DynaSIF Equity Long-Short Fund | 360 ONE | 27 Feb 2026 | 9.9356 |
| Arudha Equity Long-Short Fund | Bandhan | 30 Mar 2026 | 10.0510 |
| Sapphire Equity Long-Short SIF | Franklin Templeton | 29 Apr 2026 | 945.8689 (face value ₹1,000) |
| WSIF Equity Long-Short Fund | The Wealth Company | 11 May 2026 | 9.8595 |
| Titanium Equity Long-Short Fund | Tata | 20 May 2026 | 10.0349 |
| Arthaya Equity Long Short Fund | Union | 29 May 2026 | 9.7016 |
| iSIF Equity Long-Short Fund | ICICI Prudential | 8 Jun 2026 | 10.2100 |
| Summit Equity Long-Short Fund | Invesco | 24 Jul 2026 | 9.9700 |
| Apex Equity Long-Short Fund | Aditya Birla Sun Life | 1 Sep 2026 | 9.7600 |
| Altiva Equity Long-Short Fund | Edelweiss | 5 Oct 2026 | 10.0025 |
| MSIF Equity Long-Short Fund | Mahindra Manulife | 26 Oct 2026 | 10.0207 |
Seven of the 13 sat below their issue price on 26 October. That says more about when they launched than about skill: many opened into a falling market in September and October 2026.
Who is big and who is small in equity long-short
AMFI publishes size by category, not by fund. Fund-level figures come from AMC factsheets and data platforms. Quant's factsheet put qsif Equity Long-Short at ₹1,018 crore on 30 September 2026, the largest in the category. Data platform Advisorkhoj, on 26 October, showed regular-plan assets of roughly ₹400 crore for iSIF, ₹370 crore for DynaSIF, ₹317 crore for Diviniti and ₹276 crore for Titanium, with WSIF near ₹34 crore. Small size is not a flaw, but fixed costs weigh more.
Every Hybrid Long-Short SIF Launched So Far
Eleven hybrid long-short SIF strategies had NAVs on 26 October 2026, matching AMFI's count for 30 September.
| Strategy | Fund house | First NAV | Equity range in ISID | Direct NAV, 26 Oct 2026 |
|---|---|---|---|---|
| qsif Hybrid Long-Short Fund | quant | 20 Oct 2025 | 35–65% | 12.6340 |
| Altiva Hybrid Long-Short Fund | Edelweiss | 24 Oct 2025 | 25–75% | 10.9042 |
| Magnum Hybrid Long Short Fund | SBI | 29 Oct 2025 | 65–75% | 10.2507 |
| Titanium Hybrid Long-Short Fund | Tata | 17 Dec 2025 | 65–75% | 9.9644 |
| Arudha Hybrid Long-Short Fund | Bandhan | 4 Feb 2026 | 35–65% | 10.4300 |
| iSIF Hybrid Long-Short Fund | ICICI Prudential | 5 Feb 2026 | 65–75% | 10.1240 |
| Apex Hybrid Long-Short Fund | Aditya Birla Sun Life | 30 Mar 2026 | 35–65% | 10.7538 |
| Platinum Hybrid Long-Short Fund | Mirae Asset | 11 Jun 2026 | 65–75% | 10.0370 |
| RedHex Hybrid Long-Short Fund | HSBC | 25 Jun 2026 | 25–75% | 10.2087 |
| Infinity Hybrid Long-Short Fund | Kotak | 9 Jul 2026 | 35–75% | 10.2590 |
| Prism Hybrid Long-Short Fund | JioBlackRock | 23 Jul 2026 | 35–75% | 10.2014 |
Only one of the 11 was below its issue price on 26 October: Titanium Hybrid, by 0.36%.
Two very different hybrid designs hide under one label
The equity column matters more than any other in this table. Four hybrids, including SBI's Magnum along with Titanium, iSIF and Platinum, must keep 65–75% in equity, and their offer documents allow most of that to be hedged through arbitrage and derivatives. Three, led by Bandhan's Arudha with Apex and qsif, sit at 35–65%. Four, including Edelweiss's Altiva with RedHex, Infinity and Prism, have wide ranges from 25% or 35% up to 75%.
A 65–75% hybrid usually holds mostly hedged equity, which behaves like an arbitrage book, plus a debt sleeve. A 35–65% hybrid carries more debt and more room to shift. Same label, different engines, possibly different tax.
Size is concentrated too. Cafemutual, citing SIFPrime data, reported average assets for the September quarter of about ₹8,322 crore for Altiva Hybrid and ₹3,899 crore for Magnum Hybrid. Together that is roughly half of the category's month-end total, although average and month-end figures are not strictly comparable. Quant's qsif Hybrid, the best performer by far, was a much smaller ₹663 crore on 30 September.
What Equity and Hybrid Long-Short SIFs Actually Hold
The rules set limits; portfolios show choices. The snapshots below come from factsheets and data platforms.
Inside an equity long-short book
Quant's factsheet gives the clearest picture. During September 2026, qsif Equity Long-Short ran average equity deployment of about 92%, with unhedged longs of about 77%, shorts of about 15% and net exposure of about 62%. Month-end portfolio beta was 0.54, meaning the fund was expected to move about half as much as the market. Its largest unhedged positions were Indus Towers at 9.47% of NAV and National Stock Exchange of India at 8.25%, and the manager reported being overweight telecom and power and underweight financial services.
Other equity long-short funds look far less hedged on some days. Tickertape's data for Sapphire Equity Long-Short SIF on 26 October 2026 showed 93.75% in equity, 6.25% in cash and futures and options at about zero, with HDFC Bank, ICICI Bank and Reliance Industries as the top holdings. On that day, Sapphire was in effect a long-only portfolio led by large banks, with the option to short.
That gap, from about 62% net to nearly full exposure, is the biggest difference between equity long-short SIFs. It decides how far each falls in a sell-off.
Inside a hybrid long-short book
Quant's qsif Hybrid Long-Short, again from its factsheet, averaged equity deployment of about 58% in September, unhedged longs of about 45%, shorts of about 13% and net equity exposure of about 32%, with a month-end beta of just 0.06. The debt book had a yield to maturity of 5.94% and a modified duration of 0.27 years, so it carried little interest-rate risk. Debt excluding tri-party repo was about 26% of the fund, of which 43% was sovereign, 20% AAA and 37% AA+.
The surprise is in the top holdings. The largest unhedged position was ESDS Software Solution at 12.74% of NAV, followed by a Capri Global Capital commercial paper at 9.53% and IRB InvIT Fund at 6.92%. Dezerv's breakdown of the same portfolio showed small caps at 12.80% of the fund against 3.10% in large caps. This is a hybrid fund taking concentrated small-cap bets, which explains much of its return and much of its risk.
ICICI Prudential's iSIF Hybrid, whose offer document sets 65–75% equity and 25–35% debt, looks more like a traditional balanced book. Groww's holdings data on 26 October listed 95 positions across equities, corporate bonds, government securities, Treasury bills, index and stock derivatives and repo, with the largest single lines at about 7.5% in repo and 4.8% in TVS Motor.
Long-Short SIF Performance Since Launch: The NAV Scorecard
The tables below measure SIF returns since launch from face value to the 26 October 2026 NAV, the three months from 30 June to 30 September 2026, and the maximum drawdown, which is the largest peak-to-trough fall in the daily NAV since launch. All figures are direct-plan growth, computed from AMFI's NAV history, and none is annualised. Funds with less than a month of NAVs are left out.
Equity long-short scorecard
| Strategy | Since launch | Jul–Sep 2026 | Max drawdown |
|---|---|---|---|
| qsif | +8.04% | +3.87% | -12.40% |
| iSIF | +2.10% | +4.03% | -7.68% |
| Arudha | +0.51% | -1.20% | -5.88% |
| Titanium | +0.35% | +1.01% | -6.39% |
| Summit | -0.30% | n/a | -7.32% |
| DynaSIF | -0.64% | -2.64% | -8.91% |
| WSIF | -1.40% | -2.72% | -9.65% |
| Apex | -2.40% | n/a | -3.09% |
| Arthaya | -2.98% | -3.21% | -5.32% |
| Sapphire | -5.41% | -4.04% | -8.78% |
| Diviniti | -13.36% | -6.20% | -14.57% |
For reference, quant's factsheet put the Nifty 500 TRI at -3.73% over the same three months. Seven of the nine equity funds with a full quarter beat that, and the median since launch is -0.64%. The spread is wide: 21 percentage points separate qsif and Diviniti.
Hybrid long-short scorecard
| Strategy | Since launch | Jul–Sep 2026 | Max drawdown |
|---|---|---|---|
| qsif | +26.34% | +22.81% | -6.32% |
| Altiva | +9.04% | +2.19% | -2.66% |
| Apex | +7.54% | +4.65% | -0.71% |
| Arudha | +4.30% | +1.02% | -0.26% |
| Infinity | +2.59% | n/a | -1.49% |
| Magnum | +2.51% | -0.52% | -3.88% |
| RedHex | +2.09% | +2.12% | -0.47% |
| Prism | +2.01% | n/a | -0.68% |
| iSIF | +1.24% | +1.88% | -8.95% |
| Platinum | +0.37% | +0.06% | -2.41% |
| Titanium | -0.36% | -1.45% | -7.47% |
The Nifty 50 Hybrid Composite Debt 50:50 Index, qsif's benchmark, fell 3.02% over the same quarter. Every hybrid with a full quarter except Magnum and Titanium was positive. The median long-short SIF performance since launch in this category is +2.51%.
One fund distorts every average. qsif Hybrid's NAV rose from 11.1261 on 31 August to 13.3624 on 15 September 2026, a gain of about 20% in two weeks, which is unusual for any hybrid. Strip it out and the equal-weighted average since launch for the other ten falls from 5.24% to 3.13%.
The more useful pattern is the drawdown column. The three hybrids with the deepest falls (iSIF, Titanium and qsif) all launched before the March 2026 market low and hit their lowest NAVs in late March. The four with drawdowns under 1% (Arudha, RedHex, Prism and Apex) launched after that low or run a 35–65% design.
How Both Categories Handled the September 2026 Fall
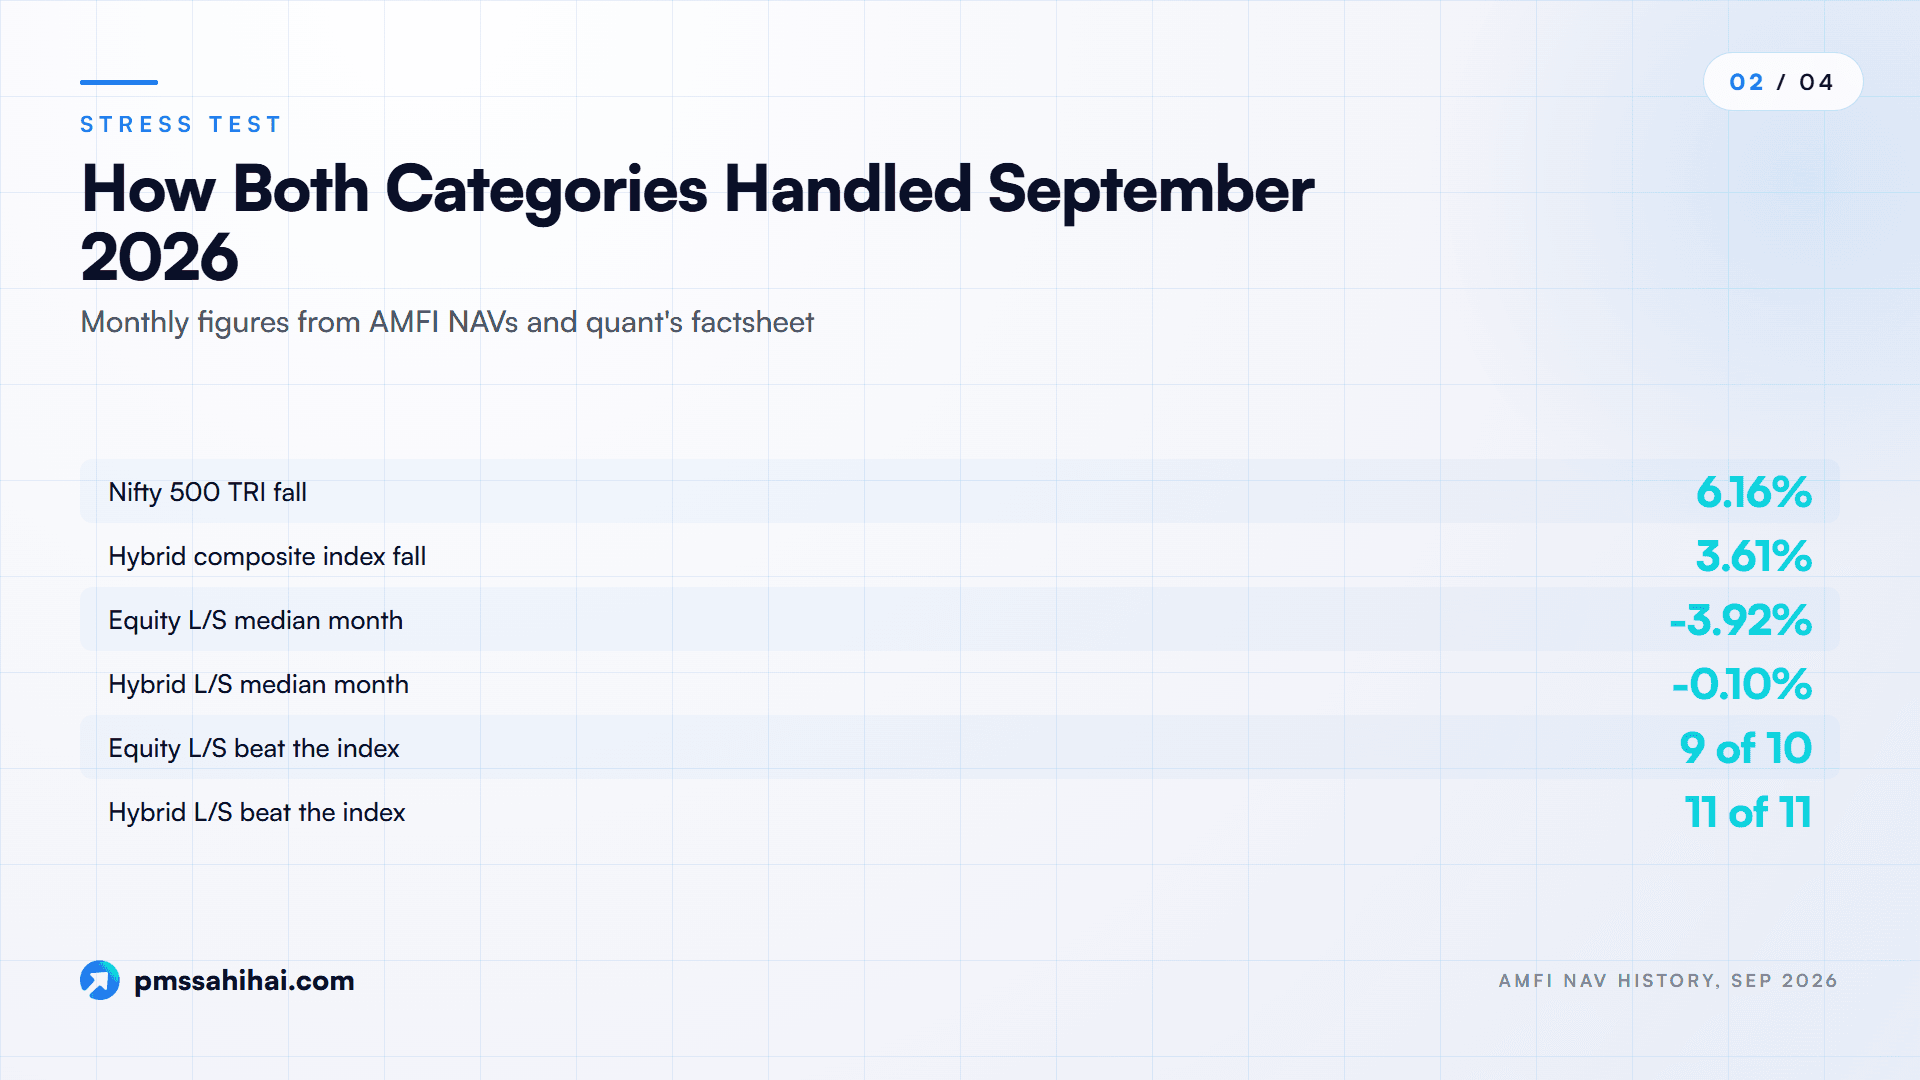
September 2026 was the first broad test that most of these funds faced together. Quant's factsheet records the Nifty 500 TRI down 6.16% for the month and the Nifty 50 Hybrid Composite Debt 50:50 Index down 3.61%.
| Measure, September 2026 | Equity long-short (10 funds) | Hybrid long-short (11 funds) |
|---|---|---|
| Best month return | qsif -1.56% | qsif +16.91% |
| Median month return | -3.92% | -0.10% |
| Worst month return | Diviniti -6.29% | iSIF -3.32% |
| Funds that beat the reference index | 9 of 10 | 11 of 11 |
Nine of ten equity long-short funds fell less than the broad market, though most still lost 3% to 5%. Diviniti fell slightly more than the Nifty 500 TRI; its own benchmark is the Nifty 50 TRI.
Hybrids did what conservative investors hope for. Eight of the 11 lost less than 1.5% or gained, and five ended the month positive. The 1–26 October readings continued the pattern, with equity long-short funds giving up a further 0.6% to 3.6% and most hybrids moving 1.3% or less.
Earlier, an Ionic Wealth study reported by 5paisa found that equity long-short SIFs captured 59% of the Nifty 50's 15.2% fall from 2 January to 30 March 2026, against 92% for large-cap mutual funds.
SIF Expense Ratios Decoded: Base Fee, Trading Costs and Plan Type
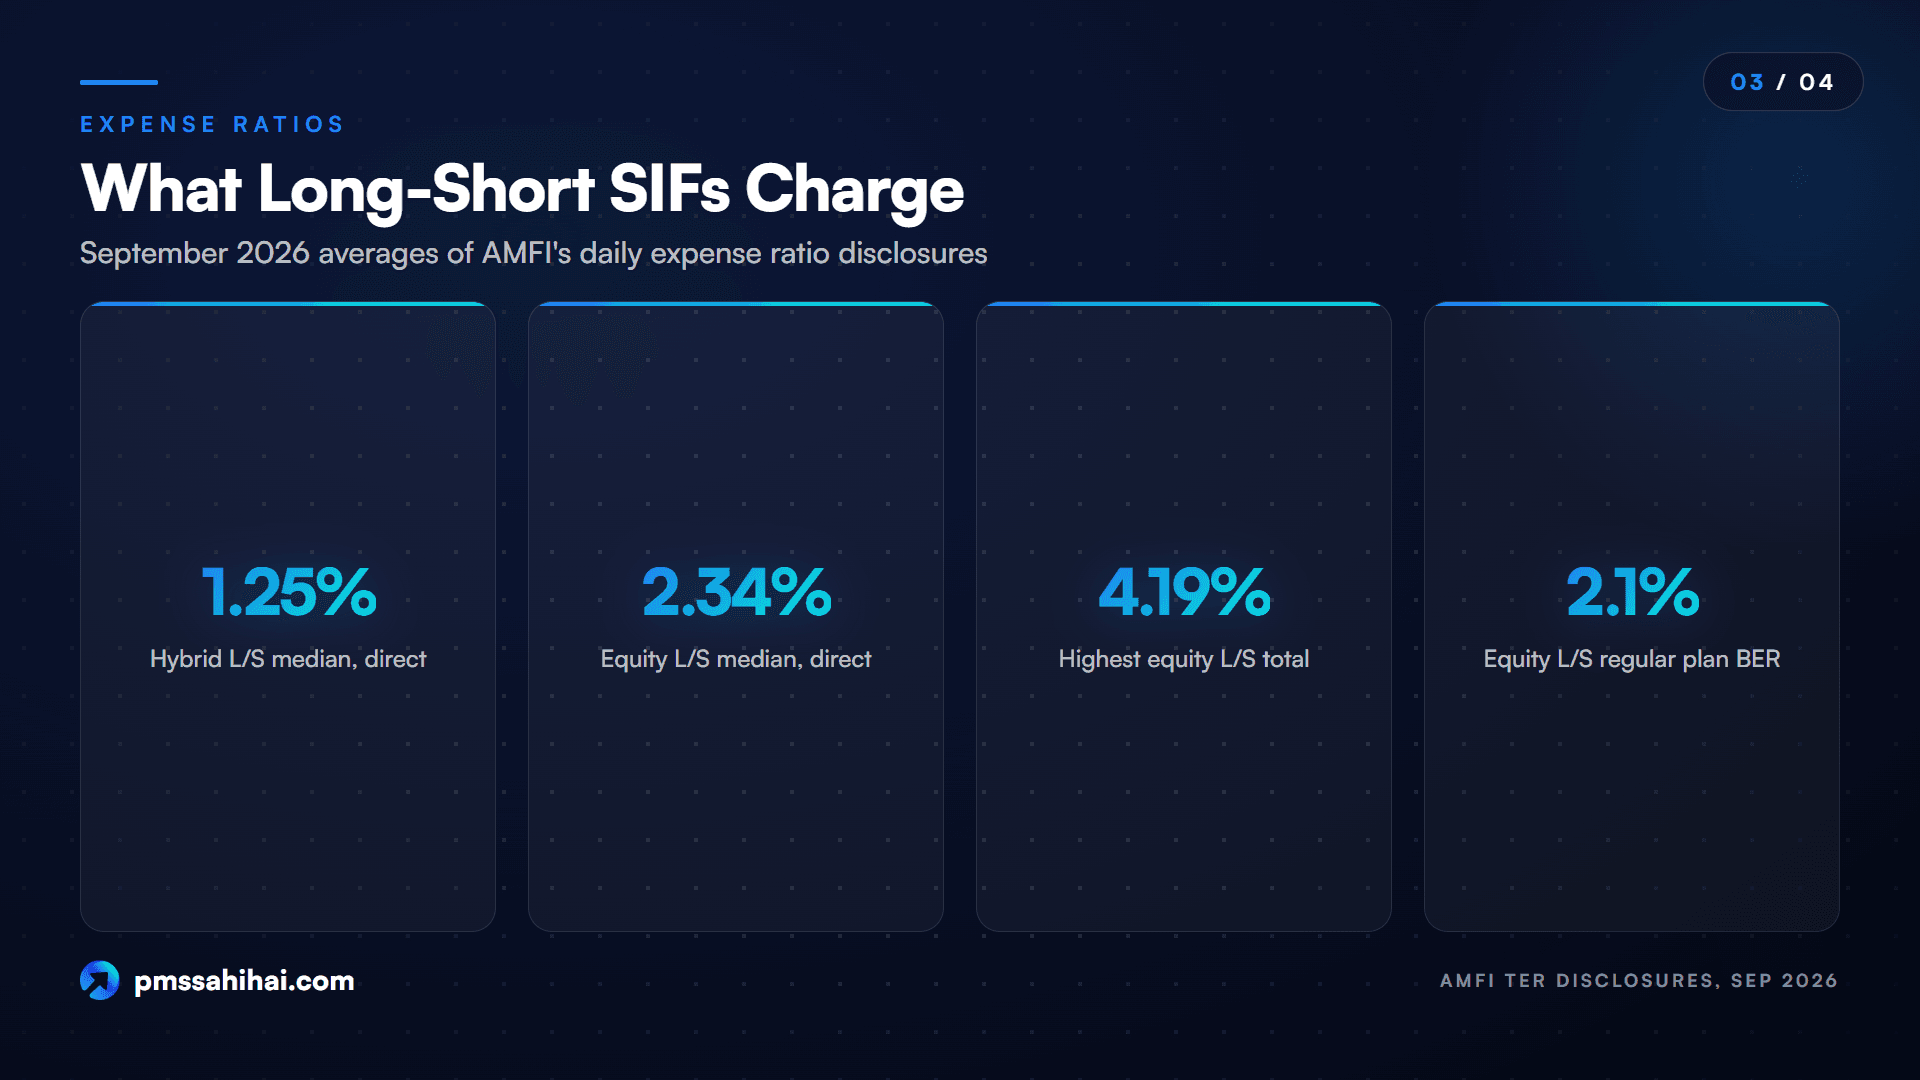
The SIF expense ratio you see on a fund page is now a sum. AMFI's daily data splits it into the base expense ratio plus brokerage, transaction costs and statutory levies, the structure Edelweiss's Altiva Equity Long-Short offer document sets out under Regulation 67. The table shows September 2026 averages of the daily figures for direct plans, and the regular-plan BER for comparison.
| Equity long-short | Direct total | Direct BER | Regular BER |
|---|---|---|---|
| Apex | 0.71% | 0.56% | 2.06% |
| Sapphire | 1.28% | 0.58% | 2.10% |
| Titanium | 1.34% | 0.49% | 2.09% |
| Arudha | 1.73% | 0.78% | 2.10% |
| WSIF | 2.28% | 0.39% | 2.10% |
| DynaSIF | 2.34% | 0.83% | 2.10% |
| iSIF | 2.39% | 0.76% | 2.01% |
| Summit | 2.50% | 0.70% | 2.10% |
| qsif | 2.89% | 0.80% | 1.95% |
| Diviniti | 3.12% | 0.84% | 2.10% |
| Arthaya | 4.19% | 1.15% | 2.10% |
| Hybrid long-short | Direct total | Direct BER | Regular BER |
|---|---|---|---|
| Arudha | 0.83% | 0.25% | 0.63% |
| Titanium | 0.99% | 0.54% | 2.07% |
| Magnum | 1.07% | 0.41% | 0.95% |
| iSIF | 1.17% | 0.67% | 1.81% |
| RedHex | 1.22% | 0.39% | 0.94% |
| Altiva | 1.25% | 0.55% | 1.24% |
| Apex | 1.62% | 0.40% | 1.41% |
| Platinum | 1.90% | 0.15% | 1.30% |
| Prism | 1.99% | 0.40% | 1.38% |
| Infinity | 2.18% | 0.42% | 1.40% |
| qsif | 2.22% | 0.61% | 1.85% |
Three things stand out.
- Trading costs dominate in equity long-short. BERs cluster between 0.4% and 0.85%, but totals run from 0.71% to 4.19%. A strategy that trades and rolls derivatives heavily can see brokerage, transaction costs and levies add three times its base fee. Apex's low total reflects a fund in its first month, not a settled cost level.
- Hybrids are cheaper. The median direct total was 1.25% for hybrids against 2.34% for equity long-short.
- Regular plans cost much more. Most equity long-short regular plans charge a BER of about 2.1%, roughly 1 to 1.7 percentage points above the direct plan, before trading costs.
The trading component moves daily, so check the latest month on AMFI's TER page.
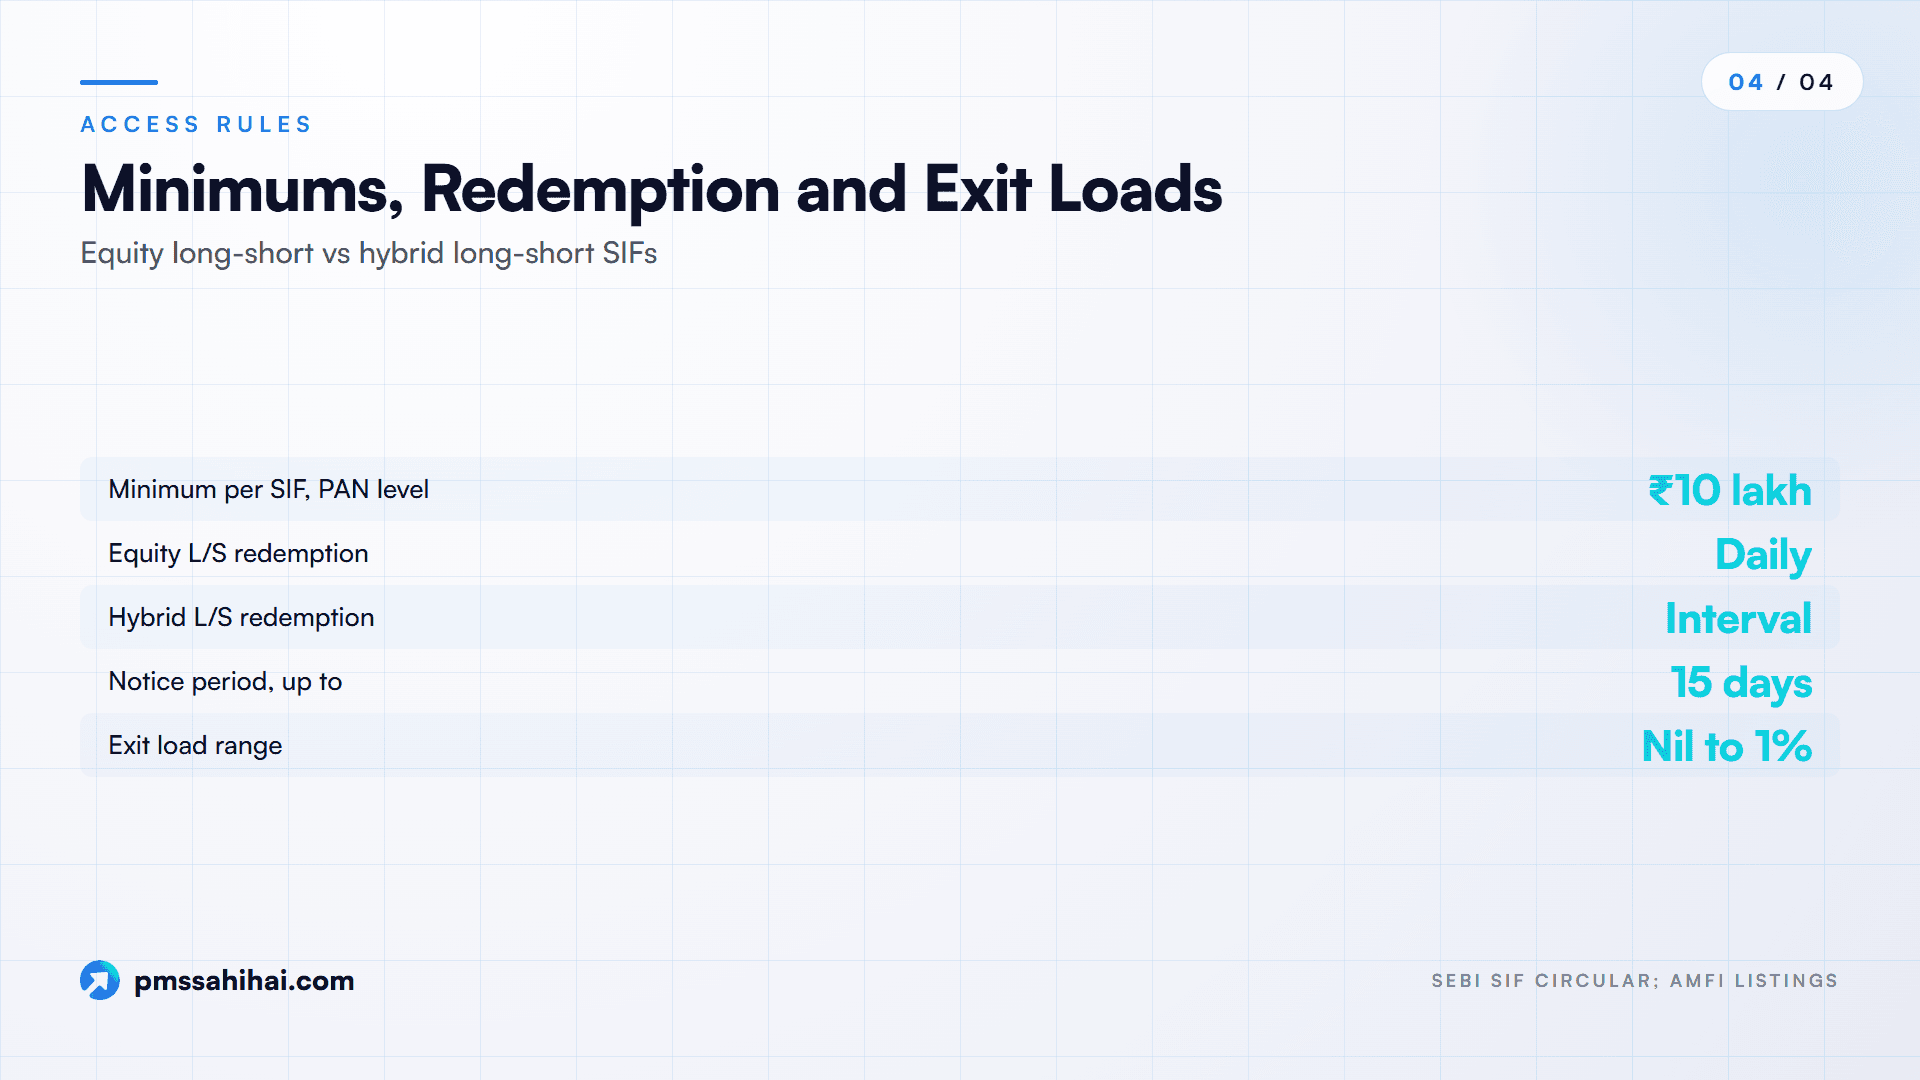
Minimums, Redemption Windows and Exit Loads Compared
| Feature | Equity long-short SIF | Hybrid long-short SIF |
|---|---|---|
| Minimum | ₹10 lakh across one SIF's strategies, at PAN level | Same |
| Accredited investors | Minimum does not apply under SEBI's rule | Same; Infinity and Platinum list ₹1 lakh on AMFI |
| Redemption | Open-ended; the funds we checked redeem every business day | Interval, at most twice a week |
| Exit loads on AMFI's listing | Nil (WSIF) to 1% within 12 months (iSIF) | Nil (Arudha) to 1% within 12 months (iSIF) |
| Notice period | Up to 15 working days allowed | Same |
Under SEBI's circular, the ₹10 lakh threshold is per SIF, not per strategy. An investor in Altiva SIF, for example, can split ₹10 lakh between its equity long-short, equity ex-top-100 and hybrid strategies. Investing with two fund houses needs ₹10 lakh at each.
Hybrid redemption days differ by fund; quant's factsheet lists every Tuesday and Wednesday for qsif Hybrid. Money is locked between windows, so confirm the days first.
Exit loads on AMFI's scheme pages range from nil to 1% for 12 months, and some fund houses have changed them since launch. Quant's October factsheet, for instance, shows a different exit load from its AMFI listing, so read the latest offer document and addenda.
What the Data Says Long-Short SIFs Do Well
A year of NAVs is short, but some advantages already show up in the numbers.
- Smaller falls in bad months. Nine of ten equity long-short funds fell less than the Nifty 500 TRI in September 2026.
- Shallow drawdowns in most hybrids. Seven of 11 hybrid long-short funds have never fallen more than 3% from a peak.
- Lower costs in the hybrid category. A median direct expense ratio of 1.25% is competitive for a strategy that uses derivatives actively.
- Public, daily evidence. Daily NAVs, daily expense ratios and bi-monthly portfolios let you check a manager's claims yourself.
- One ticket, several strategies. The PAN-level ₹10 lakh threshold lets you combine equity and hybrid strategies inside one SIF.
- Daily liquidity on the equity side. Equity long-short strategies are open-ended, and the offer documents we checked allow redemption on every business day.
That makes long-short SIFs simpler to own than a Category III AIF, with its ₹1 crore ticket and private reporting.
How PMS Sahi Hai Helps You Put Long-Short SIF Data in Context
The tables above answer "what has each SIF done?" The harder question is "what else could this ₹10 lakh do?" That is where PMS Sahi Hai fits, with one limit stated up front: PMS Sahi Hai does not list or score SIFs. SIFs are mutual fund products, so for fund-level SIF data the primary sources remain AMFI and each fund house, as used throughout this guide.
What the platform does cover is the alternatives that compete for the same money.
- The higher-ticket version of the same idea. The AIF comparison page lists Category III AIFs, including long-short funds, with strategy, vintage, lock-in and a Nyra Score shown side by side. If you have ₹1 crore and are weighing a long-short SIF against a Category III fund, start there, and read our long-short funds comparison of AIFs and SIFs for the structural differences.
- The PMS alternative. If your choice is between a ₹10 lakh SIF and a ₹50 lakh PMS, our SIF vs PMS guide sets out minimums, costs and control.
- Nyra for rule-level questions. Nyra, the platform's AI research analyst, is described as grounded in SEBI, AMC and IFSCA primary sources, citing its working and declining to answer when no verifiable source exists. It is an analytical tool, not a SEBI-registered investment adviser.
- A track-record rule worth borrowing. Under the Nyra methodology, strategies with less than 12 months of history are "Not Rated". On that standard, 21 of the 24 SIF strategies in this guide would not yet earn a score, which is a useful reminder of how early these numbers are.
New to the wrapper itself? Our explainer on what a SIF is covers the basics this guide skips.
Limits of One Year of Long-Short SIF Data
- No full cycle. Nothing here has lived through a long bull market or a long bear market.
- Launch timing drives returns. Funds that launched just before the March 2026 low look worse than funds that launched just after it, for reasons that have little to do with skill.
- Averages are skewed. qsif Hybrid's September surge lifts every hybrid average. Its largest unhedged position was 12.74% of NAV in a single stock, a concentration few hybrid investors would expect.
- Hedging is a choice, not a guarantee. Some equity long-short funds hold almost no shorts on a given day.
- Liquidity is real in hybrids. Interval windows mean you cannot exit on the day you choose.
- Data sources disagree. We found swapped return columns and conflicting exit loads across platforms while preparing this guide.
How to Choose Between an Equity and a Hybrid Long-Short SIF
- If you want equity returns with smaller falls and can hold for five years or more, the equity long-short category fits. Quant's factsheet rates its equity strategy for a horizon of five years and above.
- If you want a debt-plus or conservative-hybrid alternative and can live with twice-a-week liquidity, the hybrid long-short category fits. Quant rates its hybrid for three years and above.
A five-step shortlist using public data
- Check the design range. For hybrids, read the equity range in the offer document: 65–75% and 35–65% funds behave and may be taxed differently. For equity funds, ask for average net exposure.
- Look at drawdown before return. Pull the NAV history from AMFI and find the largest fall since launch. Compare it with the return.
- Read the latest portfolio. Open the bi-monthly disclosure and look at the five largest unhedged positions. Concentration shows up there first.
- Use the right expense figure. Take the latest month's total direct expense ratio from AMFI, not the BER alone, and avoid regular plans unless you are paying for advice.
- Confirm liquidity and loads. Note redemption days, notice periods and exit loads from the latest offer document and addenda.
Repeat the check every quarter; with long-short SIFs this young, the picture will change quickly.
Equity or Hybrid Long-Short SIF: A Data-Led Verdict
On one year of evidence, the two categories are doing different jobs. Equity long-short SIFs have cushioned falls but have not yet made money for most investors, with a median since-launch return of -0.64% and a median drawdown of 7.68%. Hybrid long-short SIFs have been steadier and cheaper, with a median return of +2.51% and a median drawdown of 2.41%, though their average is flattered by one fund.
Neither category of long-short SIFs is a buy or a sell on these numbers. The data is good enough to rule funds out on costs, concentration and drawdowns, not yet good enough to rule any fund in on returns alone. When the real choice is between a SIF and a PMS or Category III AIF, PMS Sahi Hai's comparison pages and Nyra help you weigh the alternatives on the same evidence-first basis.
Compare Your Long-Short Shortlist With PMS Sahi Hai and Nyra
Before you commit ₹10 lakh, pull three things for every fund on your list: the NAV history and drawdown from AMFI, the latest month's total expense ratio, and the most recent portfolio disclosure. Then decide which job you are hiring the money for: hedged equity or a steadier hybrid. Speak to a tax adviser about how the strategy you choose will be taxed, and revisit the numbers every quarter while these funds build their records.
If a long-short SIF is one option among several, put it next to the PMS and AIF alternatives on PMS Sahi Hai's comparison tools, and ask Nyra the rule-level questions, with sources, before you decide.
PMS Sahi Hai is a distributor of Portfolio Management Services and Alternative Investment Funds, APMI-registered (Registration No. APRN08358). This article is for education only and is not investment advice, a recommendation, or an offer to buy or sell any security. Investments in securities markets are subject to market risks; read all scheme-related documents carefully. Past performance is not indicative of future results. Consult your advisor before investing.
Ishaan founded PMS Sahi Hai to make India's PMS, AIF and GIFT City markets legible to serious investors, comparing every SEBI-registered manager on the same comparative basis, with no shelf products and no commission bias.
Frequently asked
How many equity and hybrid long-short SIFs have launched?
On 26 October 2026, AMFI listed NAVs for 13 equity long-short strategies and 11 hybrid long-short strategies. AMFI's monthly report for 30 September 2026 counted 12 and 11; MSIF Equity Long-Short published its first NAV on 26 October. The hybrid category is far larger, with ₹23,956.90 crore against ₹4,216.06 crore at the end of September.
Which category has done better since launch?
Hybrid long-short. On AMFI NAV history to 26 October 2026, the median hybrid strategy is up 2.51% since launch against -0.64% for the median equity long-short strategy, with a smaller median drawdown (2.41% against 7.68%). One hybrid, qsif, gained over 26% and lifts the average, so compare medians and individual funds.
What is the expense ratio of a long-short SIF?
It varies. In September 2026, direct-plan totals averaged 0.71% to 4.19% for equity long-short strategies and 0.83% to 2.22% for hybrids, according to AMFI's daily TER data. Each total combines a base expense ratio with brokerage, transaction costs and statutory levies, so heavy traders cost more. On base fees alone, regular plans charged 0.4 to 1.7 percentage points more than direct plans.
What does a hybrid long-short SIF actually hold?
A mix of equity, much of it hedged through arbitrage, debt and money market instruments, derivatives and sometimes InvITs. Equity ranges in offer documents run from 25–75% to 65–75%. Quant's qsif Hybrid, for example, held net equity exposure of about 32% in September 2026, with a short-duration debt book and a 12.74% position in a single stock.
Can I split ₹10 lakh between an equity and a hybrid long-short SIF?
Yes, if both strategies belong to the same SIF. SEBI applies the ₹10 lakh minimum at PAN level across all strategies of one SIF, so you can divide it between one fund house's equity long-short and hybrid long-short strategies. A second fund house needs a separate ₹10 lakh. Accredited investors are exempt.
How often can I redeem a hybrid long-short SIF?
Hybrid long-short SIFs are interval strategies, and SEBI allows redemption at most twice a week. Each fund sets its own days; quant's factsheet, for example, lists every Tuesday and Wednesday for qsif Hybrid. Equity long-short strategies are open-ended, and those we checked redeem on every business day. Check the offer document for notice periods and exit loads.
Is a hybrid long-short SIF safer than an equity long-short SIF?
On the data so far, hybrids have been less volatile: seven of 11 have never fallen more than 3% from a peak, while equity long-short drawdowns run from 3% to nearly 15%. But "safer" depends on each fund. Some hybrids take concentrated equity bets, and hybrids give up daily liquidity. Read the portfolio, not the label.
Where can I check SIF NAV and portfolio data myself?
AMFI's website carries the latest SIF NAV for every plan, a NAV history tool, daily expense ratios and scheme details. Each SIF must publish its full portfolio, including derivatives, every alternate month on its own website and AMFI's. Many fund houses also publish factsheets with exposure and beta.
Keep reading
All articles
Hybrid Long-Short SIF vs Arbitrage vs Balanced Advantage Funds
Hybrid long-short SIF vs arbitrage fund vs balanced advantage fund: how each earns, how it is taxed, liquidity and minimums compared for 2026.

Will vs Trust vs Nomination: Who Actually Gets Your PMS Portfolio
A nominee is not the owner. How SEBI's 2026 nomination and transmission rules, wills and trusts decide who gets your PMS portfolio.
Single Family Office vs Multi Family Office: Which Fits Your Wealth?
Single family office vs multi family office in India: wealth thresholds, cost break-even, SEBI and GIFT City rules, and which model fits your wealth.
Read it. Now pressure-test it.
Ask Nyra how this applies to your portfolio, or talk to our team, no pitch, no pressure.