
What Are Rolling Returns? How to Read the Range, Not the Average
Rolling returns explained: the formula, a worked example, which windows to use, and how to read the worst, median and hit rate before you invest.

Rolling returns calculate the same fixed-length return, such as three or five years, from many start dates, so you see a range of outcomes instead of one number. The calculation is plain CAGR repeated: (ending value ÷ starting value)^(1 ÷ years) − 1. The useful part is reading the result: look at the worst window first, then the median, the middle of the range, and how often the investment beat a sensible hurdle and its benchmark. Rolling windows overlap heavily, so hundreds of data points can contain only a handful of truly separate periods. They describe history and do not forecast it.
Why One Return Figure Hides What Investors Need
Picture two portfolios in a ten-year track record. At the end of year nine, Strategy B shows a three-year return of 16.95% a year against 13.96% for Strategy A. B looks like the obvious pick. One year later the same table reads 2.50% for B and 11.33% for A. The only thing that moved was the date on the page.
That sensitivity is the problem rolling returns solve. Any single return depends on where it starts and where it ends. A return measured from a market low looks generous, and one measured into a market low looks poor, whatever the skill behind it.
An investor rarely gets to choose those dates, and nobody knows in advance which date they will end up with. So the honest question is not "what did this return between these two dates?" but "across every holding period of the length I care about, what actually happened?"
Rolling returns answer that second question. This guide covers the definition, the calculation, and most of all how to read the output, because a rolling series is only useful if you know what to look at. Every number in the worked examples below is hypothetical and was recomputed for this article, and the market data is dated and attributed.
What Rolling Returns Actually Measure
Rolling returns are a series of annualised returns over a fixed holding period, measured again and again as the start date moves forward. Investopedia describes them as "rolling period returns", and its example shows the idea clearly: the five-year figure for 2015 covers 1 January 2011 to 31 December 2015, and the figure for 2016 covers 2012 through 2016.
So a 3-year rolling return is not one number. It is a list: the return from January 2015 to January 2018, then from February 2015 to February 2018, then March to March, and so on until the data runs out. The list is the product. An average of the list is only one summary of it, and usually not the most useful one.
It helps to separate rolling returns from two terms they get confused with:
| Measure | How many returns | What it tells you |
|---|---|---|
| Point-to-point return | One | The result between two chosen dates |
| Trailing return | One | A point-to-point return that ends on a recent date |
| CAGR | One | The smoothed yearly rate between two dates |
| Rolling return series | Many | The range of results for a fixed holding period |
CAGR is the formula, and we cover it in our CAGR guide. A rolling series is that formula applied repeatedly. They are not rivals, which is why "CAGR vs rolling returns" is slightly the wrong comparison.
The three settings behind every rolling series
Every rolling calculation depends on three choices, and two series are only comparable when all three match:
- Window: the holding period, such as one, three or five years.
- Frequency: how far the start date moves each time, such as a day, a week or a month.
- Span: the total history covered, such as ten years of data.
There is a practical consequence for data. To get three-year windows that start across a five-year span, you need eight years of history. A strategy with four years of record cannot produce a meaningful 5-year rolling return at all.
Where the Rolling Return Idea Came From
We could not find a single dated origin for rolling returns or a person credited with inventing them, so we will not name one. The mechanics are older than the investing use: a rolling window is the same device as a moving average, which recalculates a figure over a fixed-length stretch of data as it slides forward. Applied to returns, it produces the series described above.
What changed for Indian investors is less the idea than the inputs and the access to it.
- Better data: the Nifty 50 Total Return Index runs from 30 June 1999. That allows rolling tables spanning more than 27 years.
- Better benchmarks: SEBI required mutual fund schemes to benchmark to the Total Return variant of an index from 1 February 2018. Its reasoning was that a Price Return index captures only capital gains, whereas a Total Return index also counts dividends and interest.
- Better tools: rolling series were once a spreadsheet job. Research sites and AMC calculators now build them from NAV history in seconds.
- Tighter PMS reporting: SEBI's circular of 16 December 2022, applicable from 1 April 2023, standardised how portfolio managers report performance. It did not add rolling returns, and that gap matters, as we explain below.
How to Calculate Rolling Returns Step by Step
Here is the entire method, using the standard formula:
Rolling return = (ending NAV ÷ starting NAV)^(1 ÷ years) − 1
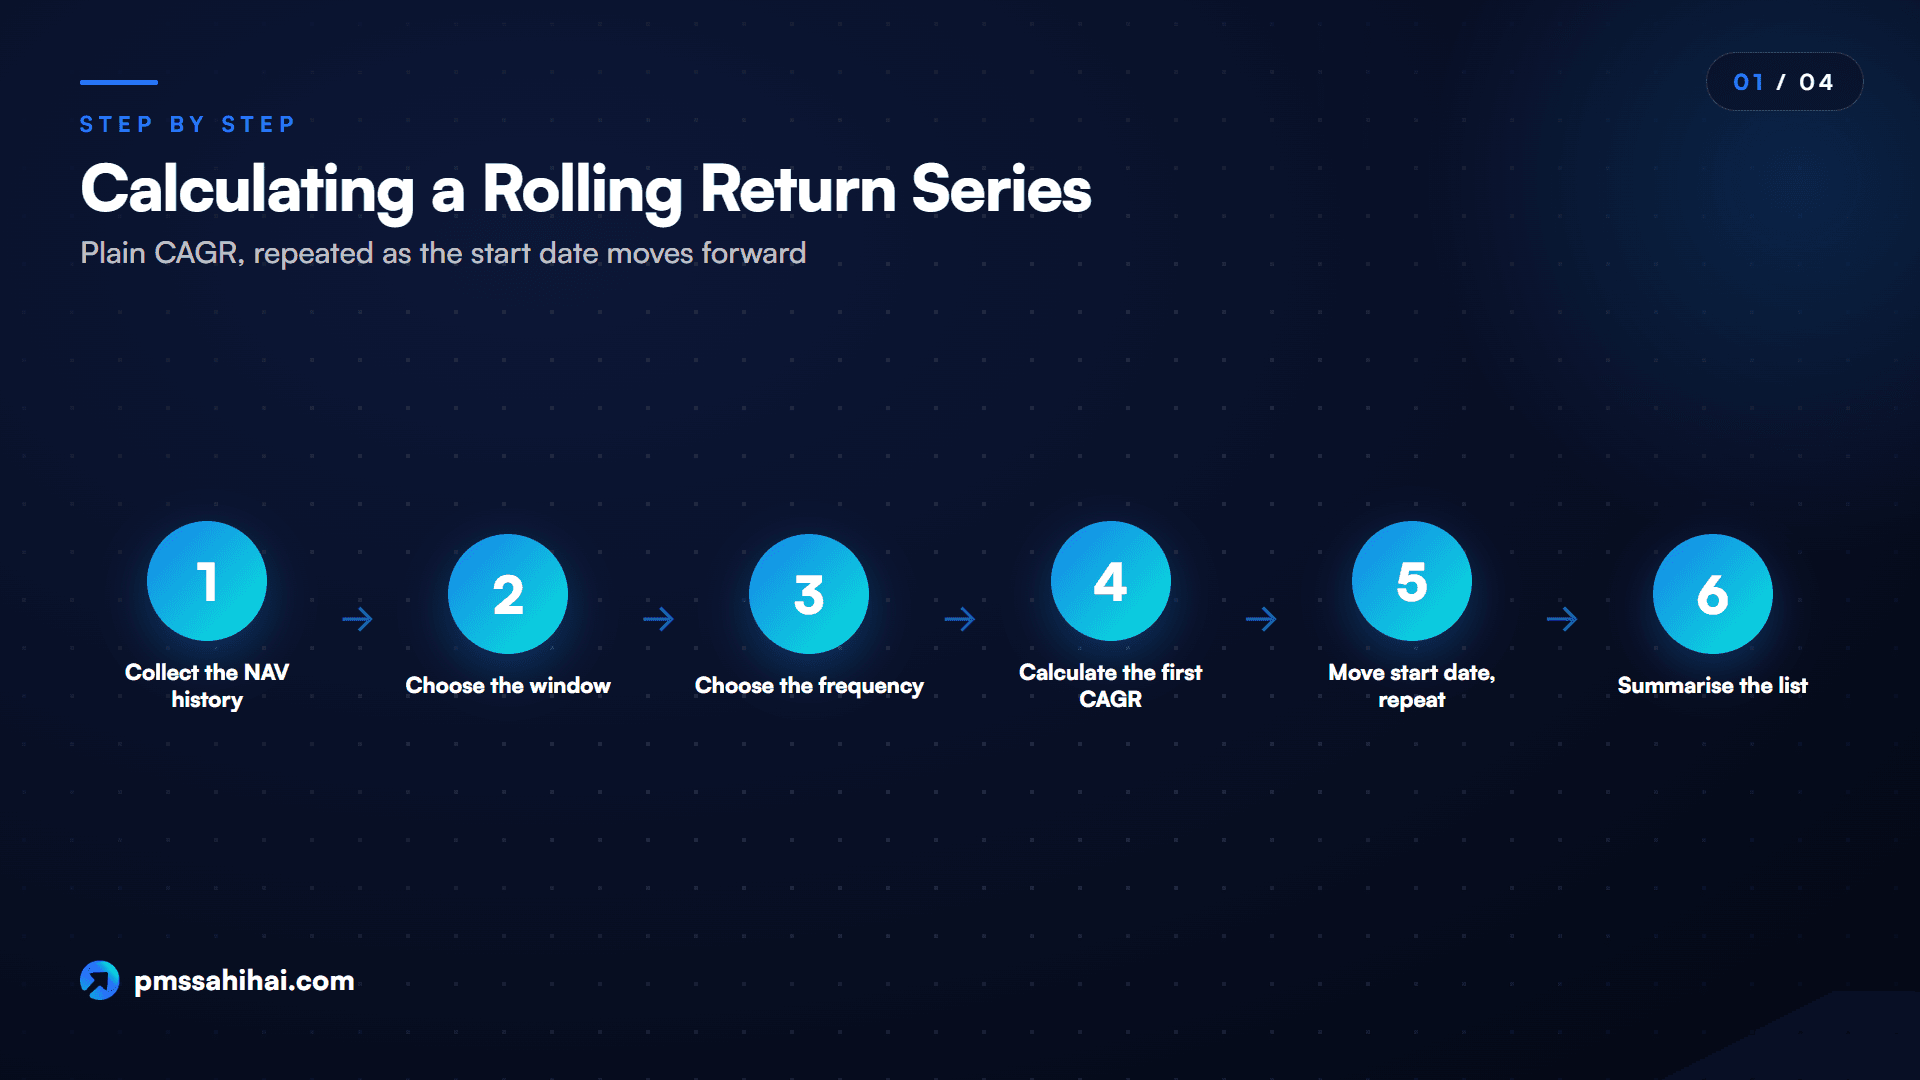
- Collect NAV history, or a month-end value series, for the whole span.
- Choose the window, for example three years.
- Choose the frequency, for example monthly.
- Calculate the CAGR for the first window.
- Move the start date forward by one step and calculate again.
- Repeat until the end of the window hits the last available date.
- Summarise the list with the measures in the next section.
Use total-return values where possible. A fund's growth-option NAV already includes dividends received. For a benchmark, use the Total Return Index, because comparing against a price-only index flatters the fund.
Worked example: a 3-year rolling return on ten years of NAV
Take a hypothetical Strategy A that starts at a value of 100. Its annual returns are +14%, −6%, +22%, +9%, +16%, −3%, +18%, +11%, +13% and +10%. That gives these year-end values, rounded to two decimals: 100.00, 114.00, 107.16, 130.74, 142.51, 165.31, 160.35, 189.21, 210.02, 237.32 and 261.05.
Yearly steps keep the arithmetic visible, so ten years produce eight windows. The first window is (130.74 ÷ 100.00)^(1 ÷ 3) − 1 = 9.35% a year.
| Window | Start value | End value | 3-year rolling return |
|---|---|---|---|
| Year 0 to 3 | 100.00 | 130.74 | 9.35% |
| Year 1 to 4 | 114.00 | 142.51 | 7.72% |
| Year 2 to 5 | 107.16 | 165.31 | 15.55% |
| Year 3 to 6 | 130.74 | 160.35 | 7.04% |
| Year 4 to 7 | 142.51 | 189.21 | 9.91% |
| Year 5 to 8 | 165.31 | 210.02 | 8.31% |
| Year 6 to 9 | 160.35 | 237.32 | 13.96% |
| Year 7 to 10 | 189.21 | 261.05 | 11.33% |
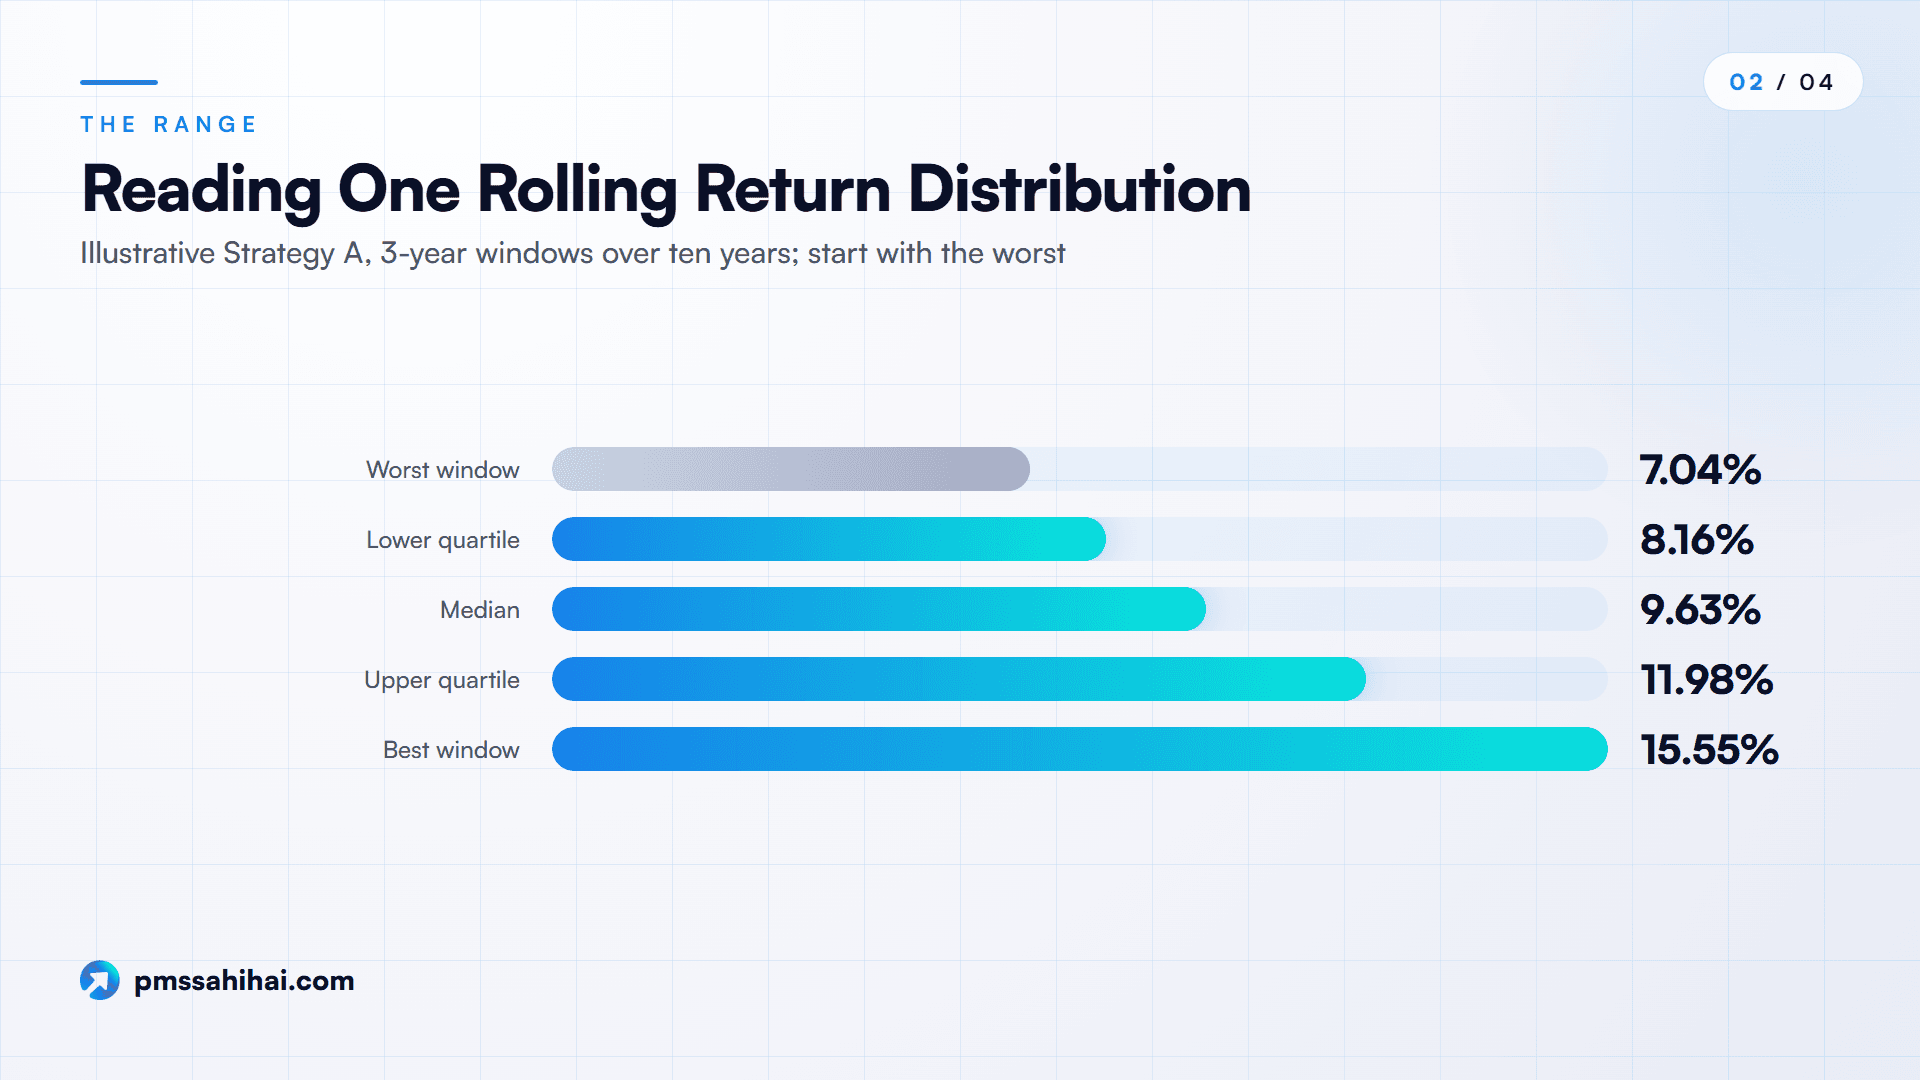
The full ten-year CAGR is 10.07%. A pitch using only that figure would not tell you that three-year holders earned anywhere from 7.04% to 15.55% a year, depending purely on when they entered.
The spreadsheet version
If your values sit in column B, from B2 down, with one row per month, a three-year window spans 36 rows. Put this in C38:
=(B38/B2)^(1/3)-1
Fill it down to the last row. For a five-year window, use =(B62/B2)^(1/5)-1 in C62. Then use MIN, MAX, MEDIAN and QUARTILE on column C, and COUNTIF for the share of windows above a hurdle. Check that your dates are aligned before you trust the result. A benchmark column needs the same dates as the fund column. Where a NAV is missing because of a holiday, use the previous available value.
The averaging mistake to avoid
Some explanations calculate a rolling return as the simple average of annual returns in the window. That is wrong whenever returns vary, because losses compound. Compare the first three-year window for two strategies with almost identical simple averages:
| First three years | Annual returns | Simple average | True 3-year rolling return |
|---|---|---|---|
| Strategy A | +14%, −6%, +22% | 10.00% | 9.35% |
| Strategy B | +46%, −24%, +8% | 10.00% | 6.22% |
A volatile path that "averages" 10% actually compounded at 6.22% a year. If a tool or an article shows you a rolling figure, confirm it compounds.
How to Read a Rolling Return Distribution
The list of window returns forms a rolling return distribution. Most explanations stop at "take the average". That throws away nearly everything the exercise was meant to reveal, so read it in this order instead. We will use Strategy A, the volatile Strategy B, and a hypothetical benchmark, all covering the same ten years with 3-year windows.
| 3-year windows (8) | Strategy A | Strategy B | Benchmark |
|---|---|---|---|
| Full ten-year CAGR | 10.07% | 8.95% | 8.18% |
| Worst window | 7.04% | 2.50% | 3.27% |
| Lower quartile | 8.16% | 5.85% | 5.96% |
| Median | 9.63% | 7.10% | 7.99% |
| Upper quartile | 11.98% | 9.68% | 10.55% |
| Best window | 15.55% | 16.95% | 14.38% |
| Average of windows | 10.39% | 8.11% | 8.53% |
| Windows at or above 12% | 2 of 8 | 1 of 8 | 2 of 8 |
| Windows beating benchmark | 8 of 8 | 4 of 8 | n/a |
Start with the worst window
The minimum is the single most useful number in the table, because it answers the question an investor actually feels: what happened to the unluckiest person who held for this long?
Convert it into money. On ₹50 lakh, Strategy A's worst three years would have grown the money to about ₹61.3 lakh. Strategy B's worst would have left about ₹53.9 lakh, after three years of waiting. B also has the highest single figure in the table, at 16.95%, which is exactly the number a marketing page would choose. The range tells you what that figure leaves out.
If you can only tolerate one outcome, ask whether you could live with the worst window, and then remember that the future can be worse than the worst past window. That minimum is a record of what has happened, not a floor.
Median, quartiles and the middle of the range
The median is the middle window, half above and half below. It is often a better "typical" figure than the average, because a few extreme windows can pull an average around. Here A's average (10.39%) sits above its median (9.63%), since a couple of strong windows lift it.
Quartiles show how tight the centre is. Half of A's windows fell between 8.16% and 11.98%, a gap of about 3.8 percentage points. B's middle half ran from 5.85% to 9.68%, about the same width but roughly 2.3 points lower. Note that a narrow range is only good news when it sits at a good level, because a dull strategy can be consistently mediocre.
Standard deviation is the other common spread measure, at 2.83 points for A and 4.13 for B on these windows. It is worth a glance, but the minimum and quartiles are easier to translate into a decision.
Do not expect the average of the windows to match the full-period CAGR. A's windows average 10.39% against a 10.07% CAGR. They are different calculations, and edge years count in fewer windows than middle years.
Hit rate against a hurdle and a benchmark
Next, count. Two counts matter:
- Hurdle hit rate: the share of windows above the return you need. If your plan requires 12% a year, A cleared it in only 2 of 8 windows, even though its CAGR is above 10%. That is a useful reality check on a plan.
- Benchmark hit rate: the share of matching windows in which the strategy beat its benchmark. A won 8 of 8, by an average of 1.86 points, with its narrowest lead at 0.74. B won 4 of 8, and its average gap was −0.42 points, ranging from +4.95 to −7.15.
Yet B's ten-year CAGR beats the benchmark too, 8.95% against 8.18%. That headline depends heavily on when you measure. Across the windows, B was close to a coin flip against the same benchmark. FundsIndia's research desk used the same two-part test, frequency plus margin, in its own rolling analysis, and it remains the cleanest way to ask whether outperformance is repeatable.
Always compare identical windows and dates. A strategy's rolling series against a benchmark's rolling series from another period proves nothing.
Choosing Rolling Windows and Sampling Frequency
Window length changes the question you are asking. Shorter rolling windows respond quickly but are noisy, and longer ones are smoother but slower to reveal a change.
| Window | Good for | Watch out for |
|---|---|---|
| 1 year | Seeing how rough a single year can be | Mostly market noise; says little about skill |
| 3 years | A common test for equity strategies | Can sit inside one market phase |
| 5 years | Most long-term equity investors | Needs a long record to mean much |
| 10 years | Seeing the outcome for patient capital | Few strategies have enough history |
Match the window to your real holding period. If you will hold for five years, the 5-year rolling return is the relevant evidence, and a 1-year chart mostly tells you how uncomfortable the ride may be. Avoid windows of three or six months for equity, since they mainly capture short-term market movement.
Frequency changes the count much more than the information. Daily, weekly and monthly sampling of the same history will look similar in shape. Daily windows produce far more points, though not much more evidence, as the next table shows. Daily data can catch an extreme date that month-end sampling skips, so a stated worst figure depends partly on the sampling used.
The arithmetic for monthly windows is simple: number of windows = months of data − window in months + 1.
| Ten years of month-end data | Rolling windows | Fully separate periods | Share of each window shared with the next |
|---|---|---|---|
| 1-year window | 109 | 10 | 91.7% |
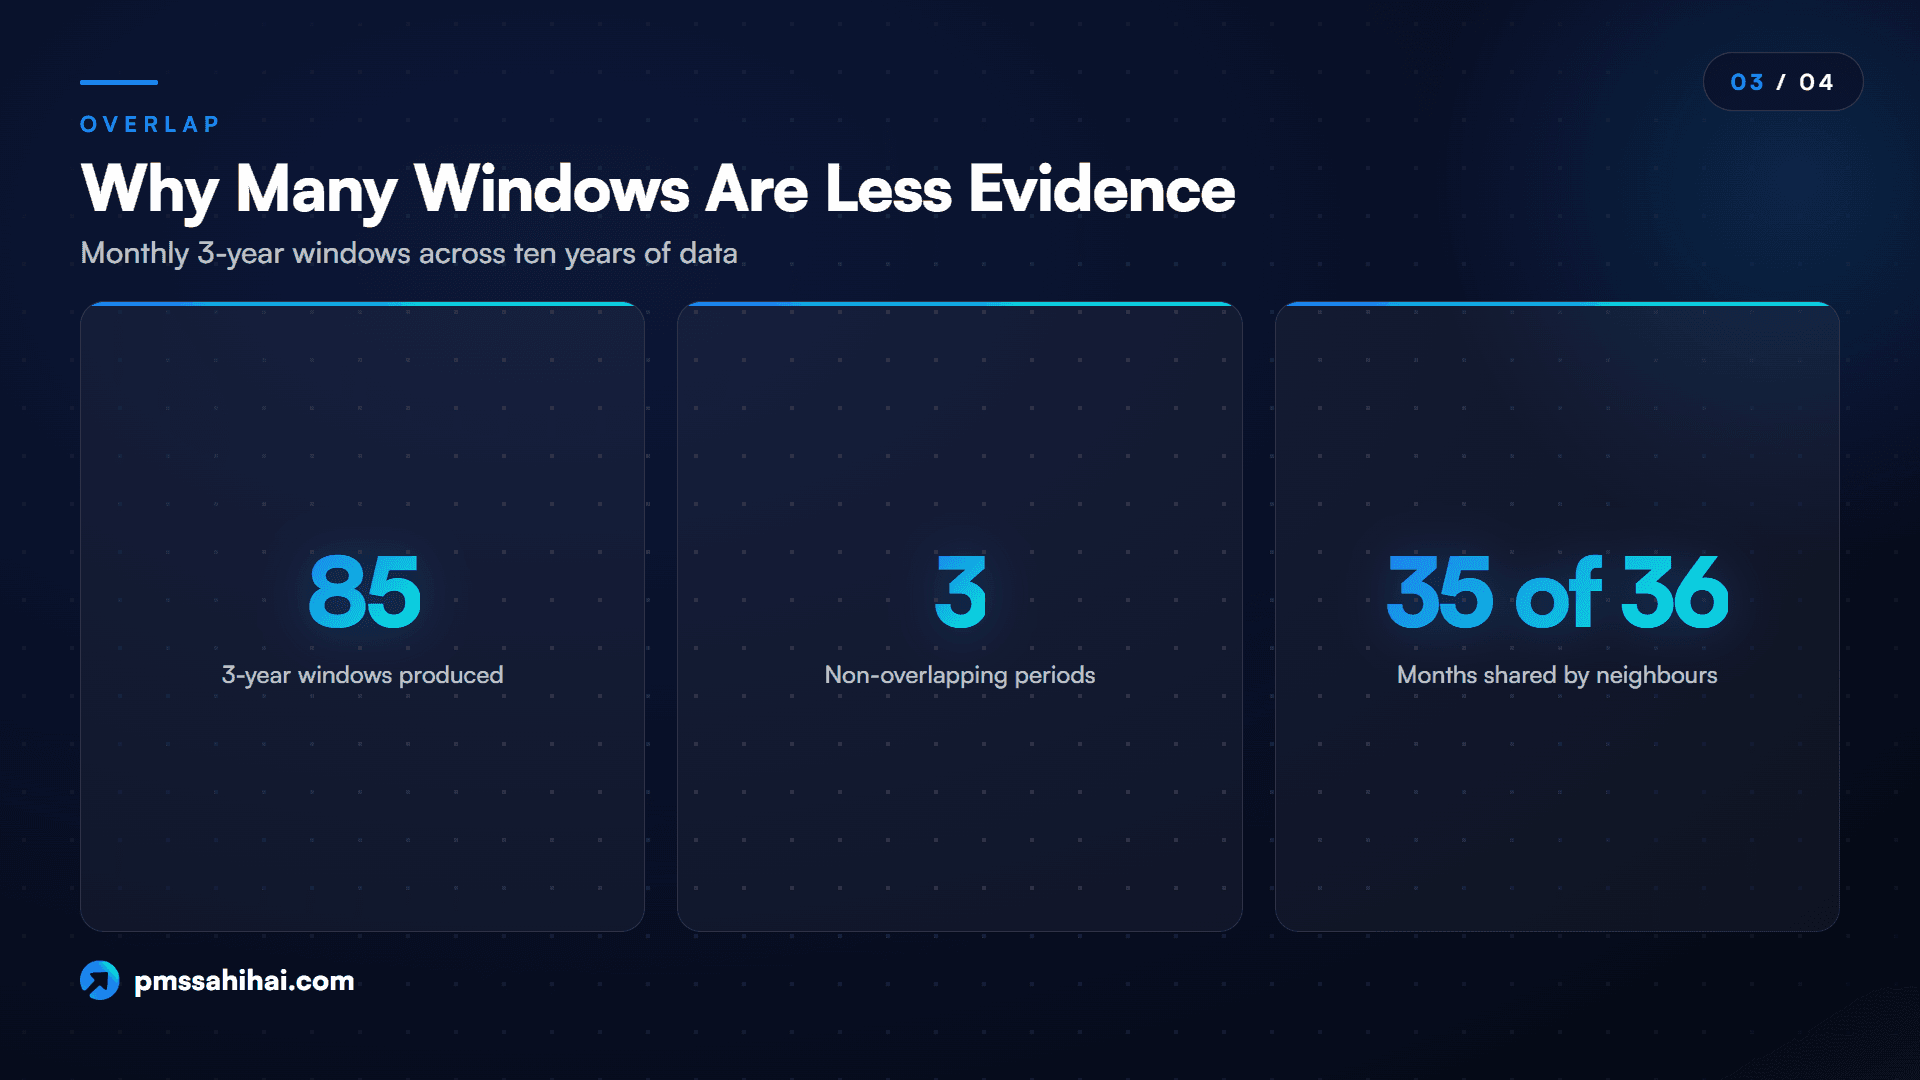
| 3-year window | 85 | 3 | 97.2% |
| 5-year window | 61 | 2 | 98.3% |
This is the most under-explained fact about rolling windows. Eighty-five three-year windows sound like a lot of evidence, yet ten years contains only three non-overlapping three-year periods. Consecutive windows share 35 of their 36 months, which is why statisticians describe the series as autocorrelated. An "85 of 85 beat the benchmark" claim is really closer to a few independent wins, so treat it as encouraging, and not as proof.
For a practical minimum, we suggest a span of at least twice the window, so a five-year rolling return needs ten years of record. That is our rule of thumb, not an industry standard. Below that, the windows overlap so heavily that they mostly restate one period.
What Nifty 50 Rolling Returns Show in Practice
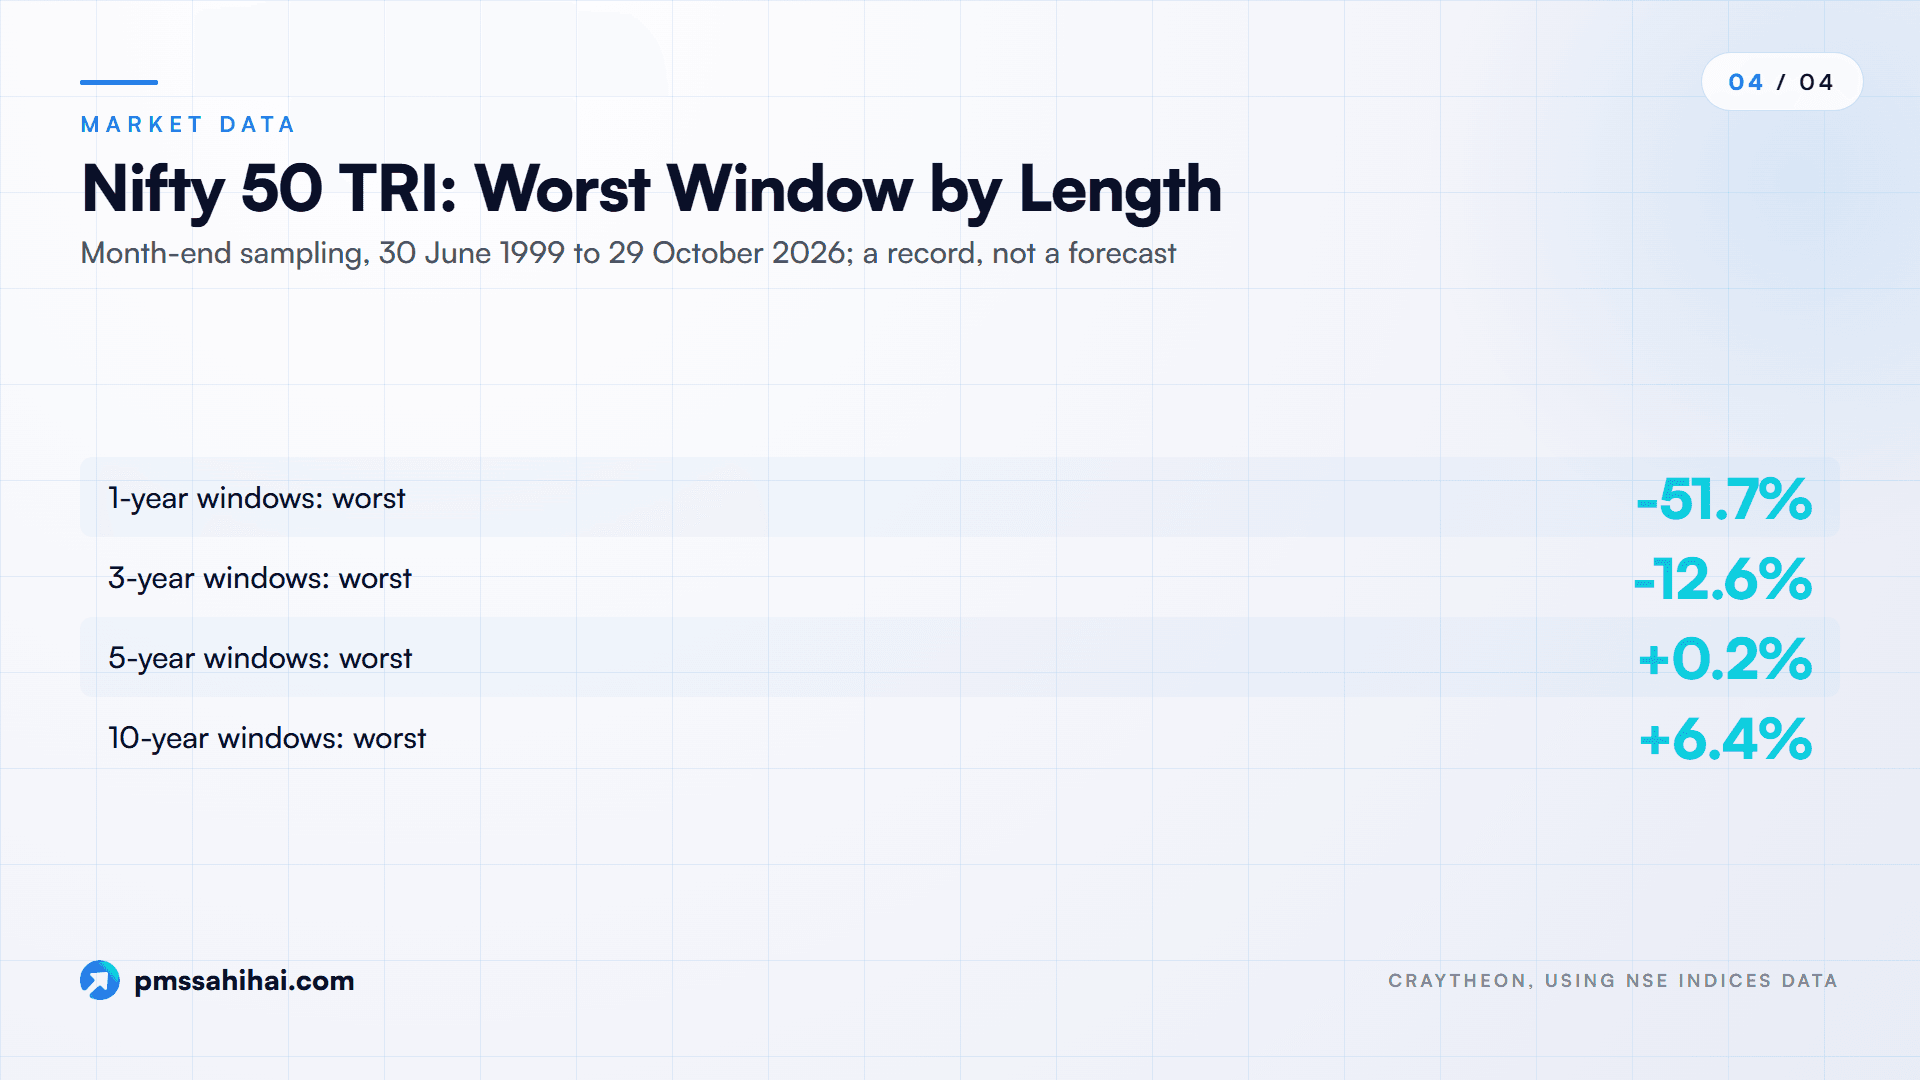
A real example shows how window length reshapes the same market. The table below is a third-party calculation by the data site Craytheon, using Nifty 50 Total Return Index values from NSE Indices, covering 30 June 1999 to 29 October 2026 with month-end sampling. We have not independently recalculated the returns, although the window counts reconcile with the 328 months in that span.
| Holding period | Windows | Average CAGR | Worst (window ending) | Best (window ending) | Negative windows |
|---|---|---|---|---|---|
| 1 year | 317 | 15.5% | −51.7% (Nov 2008) | +97.3% (Apr 2004) | 25.6% |
| 3 years | 293 | 15.0% | −12.6% (Mar 2003) | +59.5% (Apr 2006) | 6.5% |
| 5 years | 269 | 15.3% | +0.2% (Oct 2012) | +46.7% (Oct 2007) | 0.0% |
| 10 years | 209 | 14.0% | +6.4% (Mar 2020) | +22.1% (Apr 2013) | 0.0% |
Four things are worth drawing out.
The average barely moves, but the range collapses. The average sits between 14% and 15.5% across all four windows, while the gap between best and worst shrinks from about 149 points at one year to under 16 at ten. Time did not raise the typical return in this sample. It narrowed the spread around it.
A quarter of all one-year windows lost money. Equity does not deliver every year.
The zero is not a guarantee. No five-year window in this series ended negative, but the worst was only +0.2% a year, which is five years of almost nothing. Kuvera's analysis of the Nifty 50 for October 2015 to October 2025 counted 2,465 overlapping five-year periods, with a low of −1.03% and two negative periods. Kuvera does not state which index variant it used, so the two are not directly comparable. The lesson stands anyway: "never negative over five years" depends on the dataset, the variant and the sampling.
The sample is smaller than it looks. Those 269 five-year windows contain only five fully separate five-year periods, from one market in one stretch of history. Craytheon itself says past returns are a record, not a forecast.
How Rolling Returns Are Used Today in Funds and PMS
Rolling returns in mutual funds
Rolling returns in mutual funds are easy to obtain, because schemes publish daily NAVs. Fund research platforms and AMC calculators let you select a scheme, a window and a period, often with a benchmark alongside. Before relying on one, check the plan and option, the window, the date range, the frequency, and whether the benchmark is a Price Return or a Total Return index. Direct and regular plans of the same scheme have different NAVs, so make sure you are comparing the same plan.
Rolling returns in PMS reporting
PMS is harder. There is no publicly quoted daily NAV for a strategy, and client portfolios differ. SEBI rules require a portfolio manager to present the Time-Weighted Rate of Return of the investment approach along with the trailing return of the selected benchmark when mentioning performance. In reports to an investor, the manager must also show that investor's XIRR, with the minimum, maximum and median XIRR across all investors in that approach.
The monthly reporting format in the December 2022 circular uses fixed periods: 1, 3 and 6 months; 1, 2, 3, 4 and 5 years; and since inception. All of those are trailing figures ending on one reporting date. We read the full text of SEBI's Master Circular for Portfolio Managers of 16 July 2025 and found no rolling-return requirement: the word "rolling" appears once, in a rule about corporate bond trades. The new SEBI (Portfolio Managers) Regulations, 2026 take effect on 1 April 2027, so check whether the reporting framework changes then.
This leaves a practical gap: you will usually have to ask.
What to request from a PMS manager:
- The monthly TWRR series for the investment approach since inception, net of fees and expenses.
- The benchmark Total Return Index series on identical dates.
- Three-year and five-year rolling tables with the worst, median, best and benchmark hit rate.
- Confirmation that the series covers all client portfolios in the approach, because SEBI bars reporting model portfolio returns and cherry-picked investors.
With a monthly series, you can build the whole analysis yourself using the spreadsheet above. The minimum, maximum and median XIRR you receive are a related but different thing: they show the spread across investors on one date, not the spread across time.
Advantages of Rolling Returns for Everyday Decisions
The main benefit is that a difficult judgement becomes a set of simple questions.
- Less dependence on dates: a good or bad start or end point cannot dominate the picture, because every start date gets a turn.
- A visible worst case: you can see the poorest historical outcome for your holding period before you commit, rather than discovering it later.
- Fairer comparison: two strategies measured over the same windows are on equal footing, so one manager's convenient reporting date loses its advantage.
- A test of repeatability: a benchmark hit rate separates steady outperformance from one great stretch.
- Realistic planning: you can test a goal against the hurdle hit rate rather than assuming the headline return arrives every year.
- Better conversations: "show me your worst three-year window and your hit rate" is a far better question for a manager than "what is your return?"
The approach also makes behaviour easier. An investor who has already seen that a strategy delivered a 7% three-year stretch inside a 10% decade is less likely to quit in that stretch, because it has been expected from the start.
How PMS Sahi Hai and Nyra Look at Rolling Consistency
Rolling consistency is one of the things our research is built around, and we would rather show you the limits of our own data than hide them.
Consistency is a scored pillar. Nyra, the AI research tool on PMS Sahi Hai, rates strategies on five pillars: Return Performance, Risk-Adjusted Return, Downside Protection, Consistency, and Structure and Stewardship. As we set out in our guide to reading a PMS factsheet, Consistency looks at rolling-period behaviour across cycles. Its published methodology gives consistency 15% of the Nyra Score, and strategies with under 12 months of track record are shown as "Not Rated".
Know what our figures are. Strategy pages state that their growth chart, rolling-window and risk figures are modelled to the since-inception return and are illustrative. Use them as a starting point for questions. For an actual decision, get the monthly TWRR series from the manager and run the analysis in this article.
Where the tools help:
- Shortlisting: compare PMS strategies by style, fee structure and minimum ticket, then request rolling data only from the few that fit.
- Plain-English answers: ask Nyra what a score, a benchmark or a window means for a given strategy.
- Choosing the yardstick: a hit rate is only as honest as its benchmark, so read how to match a strategy to the right benchmark first.
- Going further: our guide to evaluating a fund manager beyond the return number puts rolling consistency alongside the other tests.
PMS Sahi Hai is an APMI-registered distributor, and its pages state that Nyra is an analytical tool and not a SEBI-registered investment adviser. Treat its output as research, not a recommendation.
Limitations of Rolling Returns You Should Know
Rolling analysis is an improvement, not a verdict. Its limits are real.
- It only describes the past: no rolling table predicts the future, and markets can produce a window worse than any on record.
- Overlap inflates apparent evidence: as shown earlier, many windows may contain few independent periods.
- Choices change the answer: the dataset, window and frequency all shift the figures, and a provider can select the flattering combination. Ask for several windows.
- Track records can be too short: a young strategy has few windows, and all of them may come from one market phase. A strong rolling record built entirely in a bull market says little about a bear market.
- Drawdowns stay hidden: a window measures only start and end values. A three-year return of 10% a year could include a 30% fall in the middle. Look at maximum drawdown as well.
- Survivorship bias: closed funds and discontinued strategies vanish from databases, so category-wide rolling figures can flatter the group.
- Lump-sum assumption: a standard rolling return assumes one investment on the start date. It is not your own experience if you invested through SIPs or added money over time, which needs XIRR.
- Pre-tax and sometimes pre-cost: rolling figures usually ignore your tax, and they may or may not reflect all fees. Check what the series is net of, as our note on gross and net TWRR explains.
- Manager changes: a long record may belong to a team, or a mandate, that has since changed.
Rolling returns also say nothing about how the return was earned. Pair them with risk-adjusted measures such as the Sharpe ratio and a look at the holdings.
Using Rolling Returns With Realistic Expectations
Rolling returns replace a single flattering or unflattering number with a fuller record of what holders of a given length actually experienced. The calculation is ordinary CAGR, repeated. The skill is in the reading.
When you see a rolling table, work in order. Match the window to your holding period. Read the worst window and convert it to rupees. Check the median and the middle of the range. Count how often it cleared your hurdle and beat a Total Return benchmark on identical dates. Then discount the whole table for overlap and for how few market cycles it covers.
A strategy that holds up through those questions has earned closer attention. It has not earned a guarantee, because every rolling table is a record of one past. Nyra on PMS Sahi Hai can help you frame those questions, while the answers should still come from the manager's own data.
Compare Strategies Beyond the Headline Return
Before your next investment decision, ask for the worst window, the median and the benchmark hit rate for the holding period you actually intend. Compare strategies on those answers, and treat the headline return as the start of the conversation, not the end of it.
You can compare PMS, AIF and GIFT City strategies on PMS Sahi Hai, ask Nyra to explain a score or a term, or talk to the team about the questions to put to a manager. Past performance does not guarantee future results, and this article is general information, not personal investment advice.
PMS Sahi Hai is a distributor of Portfolio Management Services and Alternative Investment Funds, APMI-registered (Registration No. APRN08358). This article is for education only and is not investment advice, a recommendation, or an offer to buy or sell any security. Investments in securities markets are subject to market risks; read all scheme-related documents carefully. Past performance is not indicative of future results. Consult your advisor before investing.
Ishaan founded PMS Sahi Hai to make India's PMS, AIF and GIFT City markets legible to serious investors, comparing every SEBI-registered manager on the same comparative basis, with no shelf products and no commission bias.
Frequently asked
What are rolling returns in simple terms?
Rolling returns are the same fixed-period return calculated from many different start dates. For example, a three-year return is measured from January to January, then February to February, until the data ends. The result is a list of outcomes, showing how a three-year holder would have fared at different entry points, instead of a single return tied to one pair of dates.
How do you calculate rolling returns?
Pick a window and a frequency, then apply the CAGR formula to each window: (ending value ÷ starting value)^(1 ÷ years) − 1. Move the start date one step and repeat until the data ends. In a spreadsheet with monthly values in column B, =(B38/B2)^(1/3)-1 gives the first three-year figure. Summarise the list with the minimum, median and maximum.
What is a 3-year rolling return?
A 3-year rolling return is the annualised return for each three-year period within a longer history, with the start date moved forward by a set step. With ten years of month-end data you get 85 such windows. It shows the range of results a three-year investor could have received, rather than a single figure ending on one chosen date.
What is a good rolling return?
No single number qualifies, since it depends on the asset, the window and your goal. Judge it in context: a worst window you could tolerate, a median above what you need, a hurdle cleared in most windows, and a high hit rate against a Total Return benchmark on matching dates. A narrow range is only attractive when it sits at a useful level.
What is the difference between CAGR and rolling returns?
CAGR is one smoothed annual rate between two dates. Rolling returns apply the CAGR formula repeatedly to many overlapping periods of equal length, producing a distribution. So a ten-year CAGR gives you one number, while 3-year rolling returns across that same decade show every three-year result inside it. Use CAGR to describe a period and a rolling series to test consistency.
Which rolling period should I use?
Use the window closest to your real holding period. Three and five years suit most equity investors, ten years suits patient long-term capital, and one year mainly shows how rough a single year can be. Keep the span at least about twice the window where possible, because shorter records produce windows that overlap so much they mostly repeat one period.
Can rolling returns predict future performance?
No. Rolling returns describe what has already happened, and future markets can produce a window worse than the worst on record. They help you set expectations and judge past consistency, but they cannot forecast returns. Treat a strong rolling record as a reason to investigate a strategy further, alongside its risk, costs, holdings and team, not as a promise of what comes next.
Do PMS factsheets show rolling returns?
Not as a rule. SEBI's reporting requires TWRR with the benchmark's trailing return over fixed periods, and we found no rolling-return requirement in the Portfolio Managers Master Circular of July 2025. Some managers may provide them. If yours does not, request the monthly TWRR series and matching benchmark Total Return values, and build the rolling table yourself.
Keep reading
All articles
Key Functions of PoA in Portfolio Management: The Operating View
How a PMS PoA works day to day: trade execution, demat debit, bank mandates, corporate actions and fees, mapped to SEBI rules and limits.

What Is Succession Planning? A Wealth Guide for Indian Business Families
Succession planning for Indian business families: ownership, management, family constitution, holding structures and the wealth outside the business.

What Is a Private Banker? What They Do That a Distributor Doesn’t
What is a private banker? The bank role, the credit work a distributor can't do, how they are paid, and which conflicts to question.
Read it. Now pressure-test it.
Ask Nyra how this applies to your portfolio, or talk to our team, no pitch, no pressure.